Tags
development, Technology, blog, observability, DZone, FluentBit, OpenTelemetry, OTel, OpAMP
Just a quick post, we’ve had an article about OpAMP published on DZone check it out at OpenTelemetry’s OpAMP Potential Far Beyond Supporting Collectors
's Blog")
27 Monday Jul 2026
Posted in Fluent Observability, General, OpAMP
Tags
development, Technology, blog, observability, DZone, FluentBit, OpenTelemetry, OTel, OpAMP
Just a quick post, we’ve had an article about OpAMP published on DZone check it out at OpenTelemetry’s OpAMP Potential Far Beyond Supporting Collectors
20 Monday Jul 2026
Posted in Fluent Observability, General, OpAMP, Technology
Tags
configuration, Fluent Bit, logs, metrics, observability, OpAMP, Open Telemetry, OTLP
Another aspect of OpenTelemetry’s OpAMP protocol is the ability to share connections details, not just between the server side of the OpAMP protocol, but with other connections a collector like Fluent Bit could be using such as an OTel consumer for logs, traces and metrics that are being collected that could be a managed Grafana service or another Fluent Bit if you’re using a concentrator network.
This is includes Observability data generated by the collector I.e. Fluent Bit in our case.
It is true that out of the box Fluent Bit doesn’t push OTel signals for itself. But this is easily fixed. We can control logging, and metrics that are exposed (and today no traces are produced). The solution is simple, we use Fluent Bit itself to collect the logs and metrics and route them to using an OTel output plugin.
While creating a configuration for sharing seems onerous, once you’ve done it once, you can simply include the config file in every deployment. Further more, if you backend for any of the signals is not Fluent Bit conversant, just use a different Fluent Bit plugin.
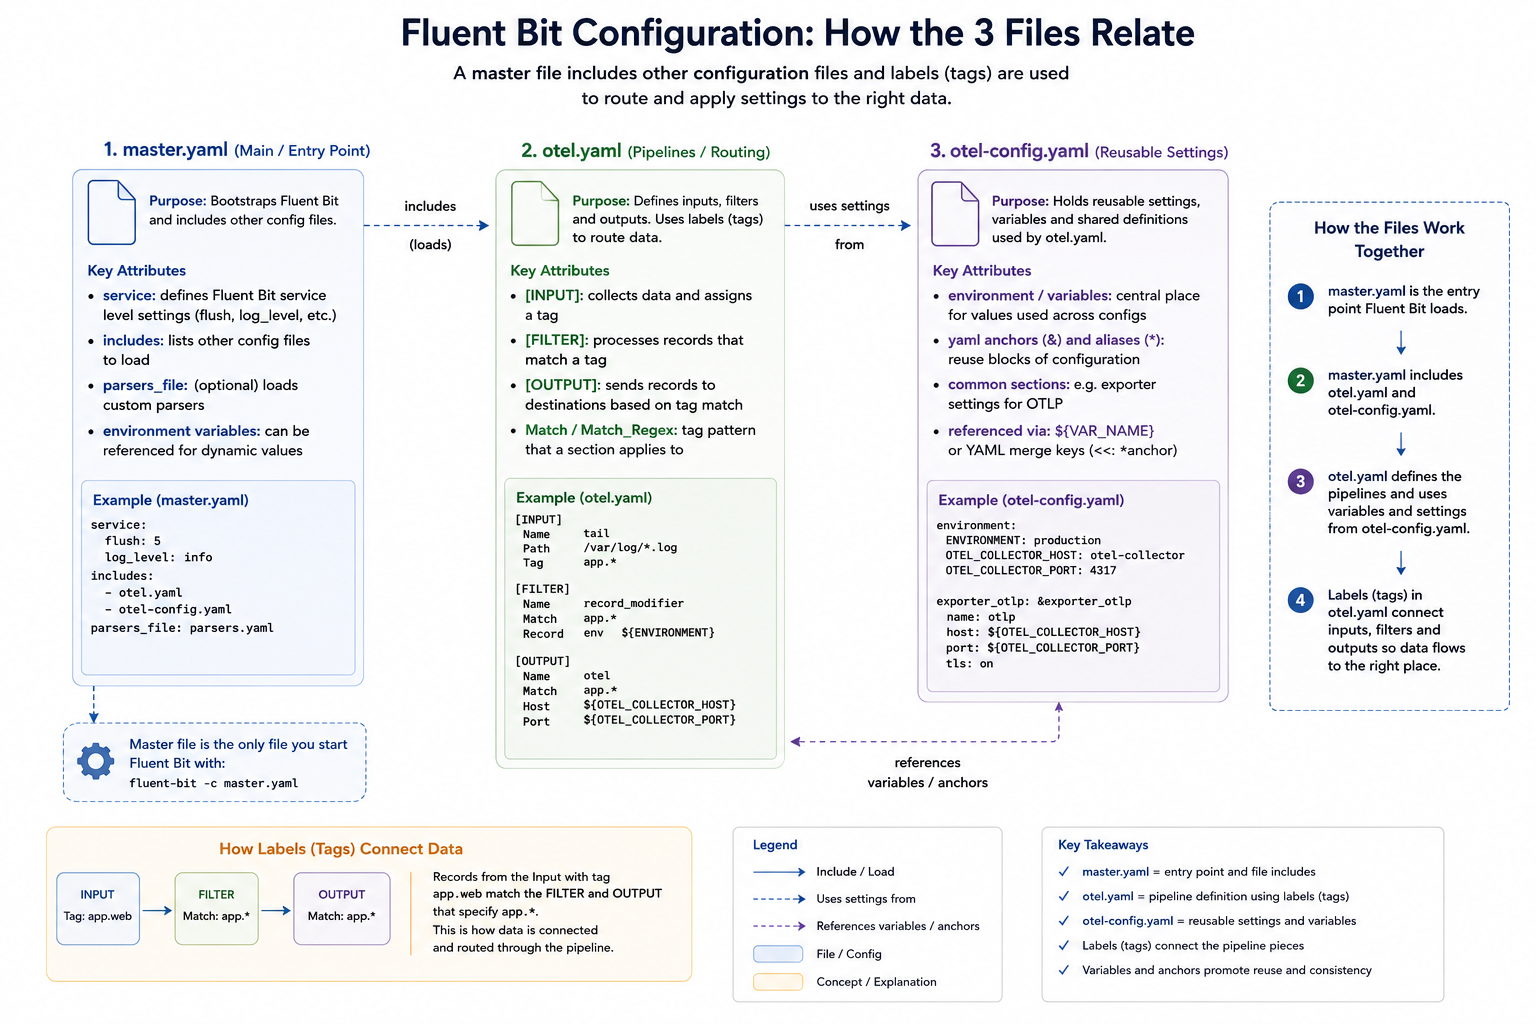
Our configuration consists of several files, which we’ll explain. We’ve adopted a multi-file setup, which works through the use of Fluent Bit’s includes capability so we can separate out the application-level observability configuration (master.yaml), the configuration to allow us to observe Fluent Bit itself (otel.yaml), and the configuration for the connection parameters (otel-config.yaml).
The master.yaml contains our application observability settings and is the configuration file we pass to Fluent Bit. In this case, we’re simply using a dummy input that’s fed to a file output; we’ve also got a wildcard stdout configuration to make it easy to observe what’s going on from the command line.
includes:
  - otel.yaml

service:
  flush: 1
  log_level: debug
  http_server: ${http_server}
  http_listen: ${http_listen}
  http_port: ${http_port}
  log_file: ${log-file}

pipeline:
  inputs:
    - name: dummy
      tag: dummy.activity
      dummy: '{"message":{"msg":"grafana-cloud test event","service":"fluent-bit","source":"dummy"}}'


  outputs:
    - name: stdout
      match: "*"
      format: json_lines

    - name: file
      match: "dummy.*"
      file: dummy.log
There are at this level, two telltale signs of self-monitoring at this level:
We’ve separated the pipeline definitions for Fluent Bit observability to reuse the configuration across many deployments. As different deployments may need to talk to different instances of the observability backend (for example, when operating in a multi-cloud arrangement we have defined the environment variables that provide the credentials and target address).
We have defined additional environment variables at this level, so that anyone needing to understand master settings and the service values needs only look here. How this layer (or layers) is established is, to an extent, concealed. It also means we can use OpAMP to generate a configuration file, but we’ll come back to that.
includes:
  - otel-config.yaml

env:
  http_server: on
  http_listen: 0.0.0.0
  http_port: 2020
  log_file: ${own-log-file}

pipeline:
  inputs:
  - name: fluentbit_metrics
    tag: fb.metrics

  - name: tail
    path: ${own-log-file}
    tag: ${own-log-file}

  outputs:
  - name: opentelemetry
    match: "*"
    host: ${otel-host}
    port: 443
    http_user: ${otel-user}
    http_passwd: ${otel-password}
    logs_uri: ${own-otel-logs}
    metrics_uri: ${otel-metrics}
    traces_uri: ${otel-traces}
    tls: on
    tls.verify: off
    log_response_payload: true
    logs_body_key: message
    add_label:
      - environment dev
      - destination grafana-cloud
The environment variables that we define to be used by the master.yaml switch the HTTP server on, and indicate which ports to use. Making this easy to check for the person or people defining the master.yaml makes it easier to avoid port collisions.
We also tell Fluent Bit where to write its logs through the service setting. To consolidate the configuration, that value references a different environment variable, so we can put all of our configurations together. Even if we didn’t have this level of redirection, it is worthwhile setting the value using an environment variable as the file location is needed both as our output for the service and the input for a plugin.. As you can see, we’ve just named the file. So the file created will be relative to wherever we run Fluent Bit from.
Let’s look at the inputs and outputs being used, and what they do:
That is the hard bit done. As a result of these inputs, we get the metrics and logs (and no traces are available). We now just need an OpenTelemetry output plugin to direct all the OTLP-represented signals. For simplicity, we’ve made use of a free account on Grafana Cloud.
This configuration file is simple, which is key to making it easy for us to manage the connections setup using OpAMP. It simply defines the connection-based attributes needed, as shown:
env: otel-user: '-my Grafana Cloud Accound Id-' otel-password: '-my Grafana Cloud Account Token-' otel-logs: '/otlp/v1/logs' otel-metrics: '/otlp/v1/metrics' otel-traces: '/otlp/v1/traces' own-log-file: 'flb.log' otel-host: 'otlp-gateway-prod-gb-south-1.grafana.net'
While populating credentials in a file isn’t ideal, it makes it pretty straightforward for an OpAMP Client (observer or supervisor) to receive the credentials for the management side of the protocol, make them available to Fluent Bit quickly, and have Fluent Bit pick them up dynamically via hot-deploy functionality. This is precisely what we have implemented in our OpAMP. This approach works for both Fluent Bit and Fluentd configurations and we can even apply a similar approach for driving clients such as Elastic Beats.
This configuration file is simple enough that we can rewrite it whenever the configuration values are amended; there is no complexity in inserting such settings into the broader configuration. Furthermore, if Fluent Bit were running as an observed process rather than a supervised (i.e., child) process, setting environment variables could become problematic.
We can mitigate credential-related challenges in the file system by restricting filesystem permissions to the file being written, so only certain users and processes can access it. When working with containers, we can also keep this part of the file system within the image by using a transient storage layer.
An alternative approach would be for the client to receive the credentials and store them in an encrypted method, such as a credentials vault, and then the launcher for the process would read and decrypt the file as it launches Fluent Bit or another collector. The way we have implemented the client for our OpAMP certainly makes this possible, but it also complicates the process and suggests that the mechanics of credential management would be better handled by a distributed vault solution.
The only niggle, is that when passing the connections, the protocol assumes that connection details are only needed for the collector. That’s fine if the collector includes the client side of the protocol. But as we know, the collector may be managed with a supervisor or observer process. We could use the connection for the collector and our supervisor, but that may not be what is wanted.
We can visualise the relationships, like this:
As you start to think about the server aspect of this, it gets potentially very complex. In simple scenarios, sending everything to a single Observability backend isn’t an issue.
But if you’re managing a multi-cloud, hybrid, or managed client setup, you’re likely to want separate backend instances for different collectors. In our setup, that means passing the different connection details to the client to populate otel-config.yaml. Understanding this deployment will require understanding the distribution. We will also need to manage potentially a concentrated catalogue of credentials, which will need to map to the collector nodes, and a means for the user to define the mapping. Creating a means to visualise the mapping, and ideally to allow the server to apply rules or infer assignments for more complex use cases such as multi-cloud, isn’t going to be simple.
We have a simple means to deploy configuration and observe our collector and the supervisor/observer process. Making server-side management in a large-scale environment easy to work with will require some consideration and potentially additional optional metadata. But the protocol supports all of this, but doesn’t mandate specifics. Which does mean that either the server has to be smart enough to know when what to do if it interacts with a client that has been built or configured to work with this server – which is an essential requirement, otherwise we lose the value of the
17 Friday Jul 2026
Posted in Fluent Observability, OpAMP, Technology
Tags
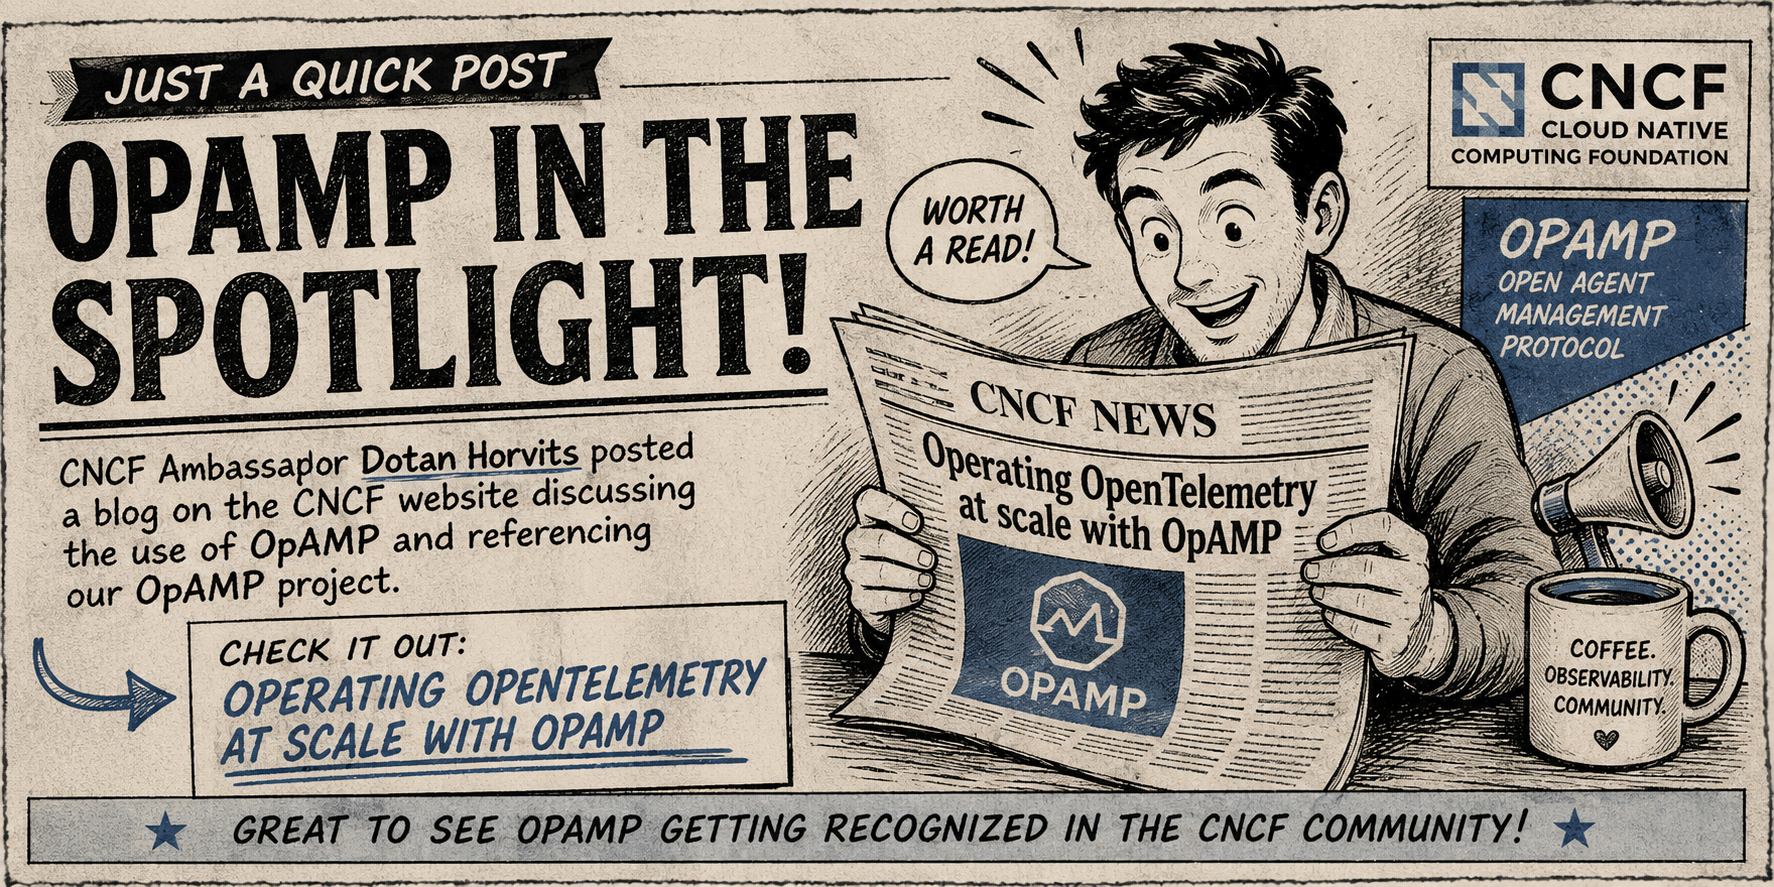
Just a quick post: CNCF Ambassador Dotan Horvits posted a blog on the CNCF website discussing the use of OpAMP and referencing our OpAMP project. Check it out at Operating OpenTelemetry at scale with OpAMP. Ignoring the work we’ve been doing, it’s an interesting read.
15 Monday Jun 2026
Posted in Fluent Observability, General, OpAMP, Technology
Tags
AI, artificial-intelligence, development, Fluent Bit, LLM, MCP, OpAMP, open telementry, Technology
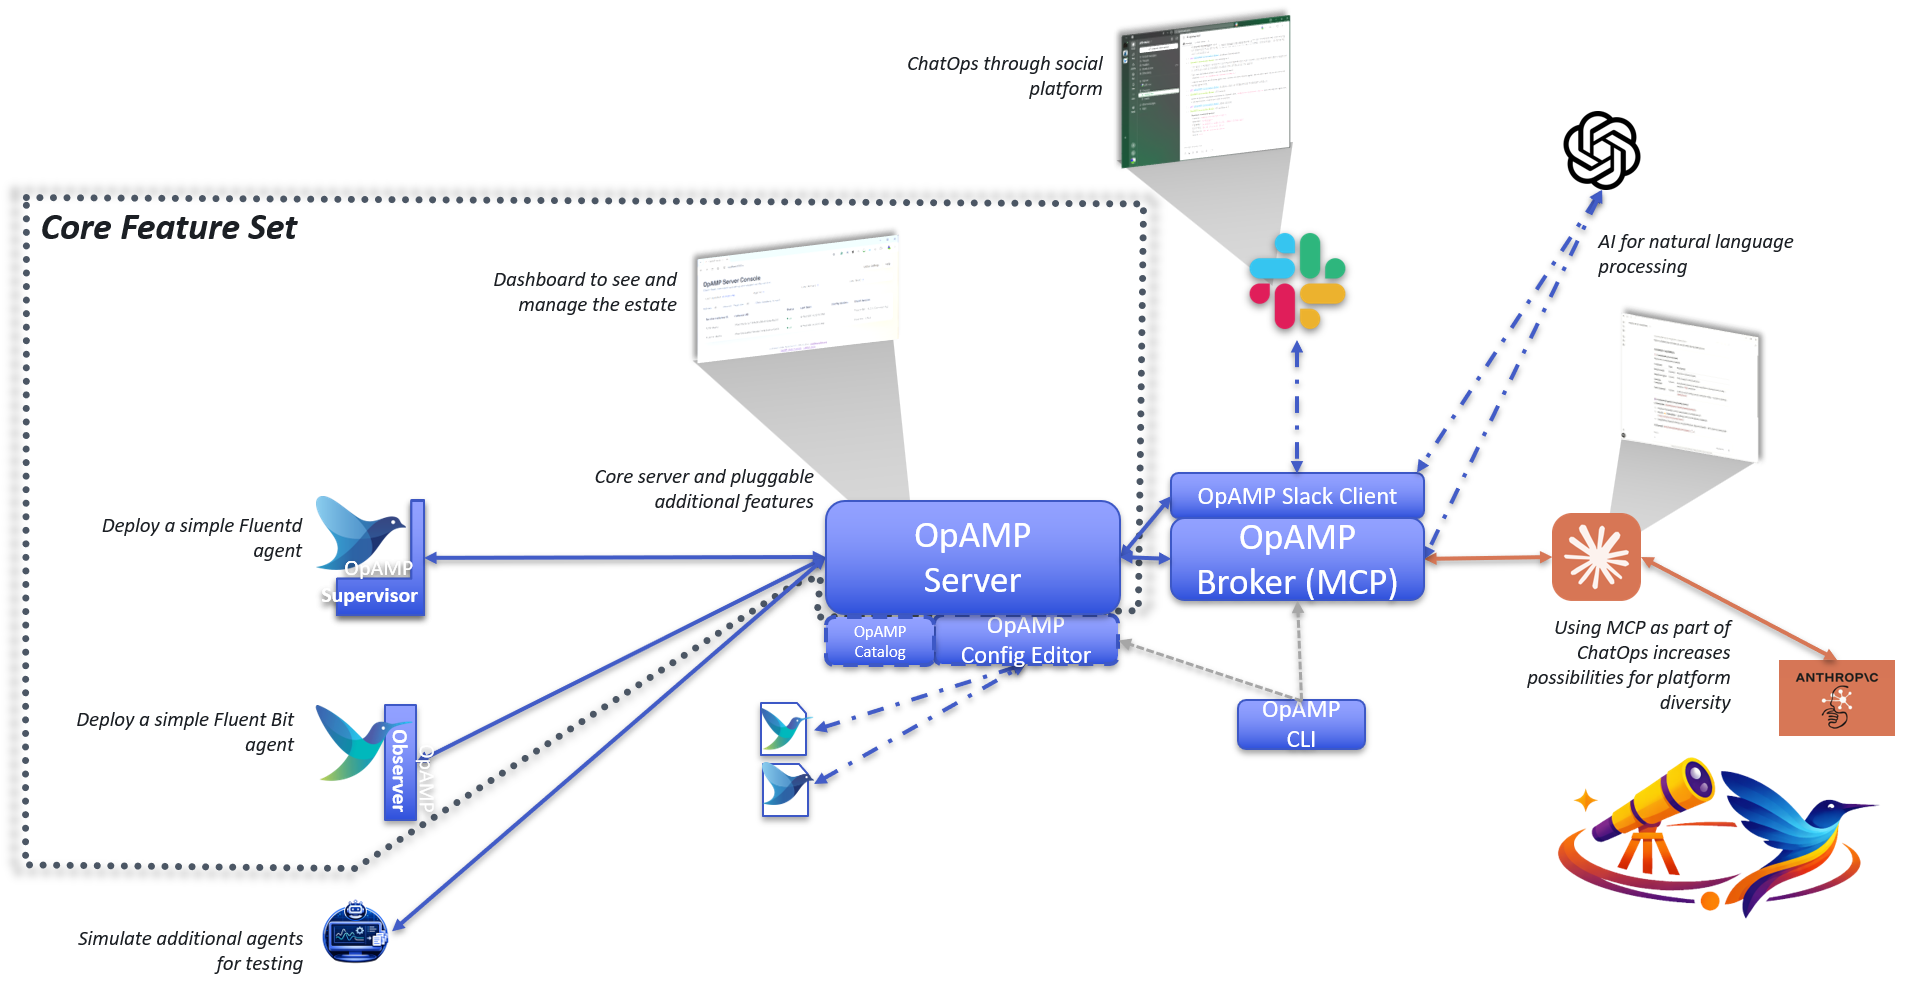
So we’ve been busy working on our OpAMP solution. We’ve made a number of enhancements since we labelled the code v0.4 back in April. For this post, we’ll look at the features added and where we’re looking next.
For a start, we demo’d what has been developed as part of CNCF Webinar about OpAMP
There has been a lot of feature development, particularly in support of working with Fluent Bit (and to a degree Fluentd).
We started building the Configuration Editor as a standalone capability. The thinking was that we would refactor it into the OpAMP server once we were happy with the functionality and had progressed far enough. But, as we saw this come together, it occurred to me that both deployments are good, as part of the OpAMP server, seeing the configuration being used is handy, but having a freestanding editor (without worrying about the connectivity to communicate with agents) is also a real use case.
So we have created the setup, where if the OpAMP is told to look for the Editor via the definition of Python endpoints in the configuration and it is deployed, it will be incorporated into the server. If the editor isn’t provided (deployed, or not identified in the configuration it isn’t offered in the navigation.

The editor is completely configuration-driven through JSON, so it only requires extending the JSON to support custom plugins or to enhance the validation rules (e.g., adding a REGEX to how a particular parameter is set). This far outweighs the current Dry run checks.
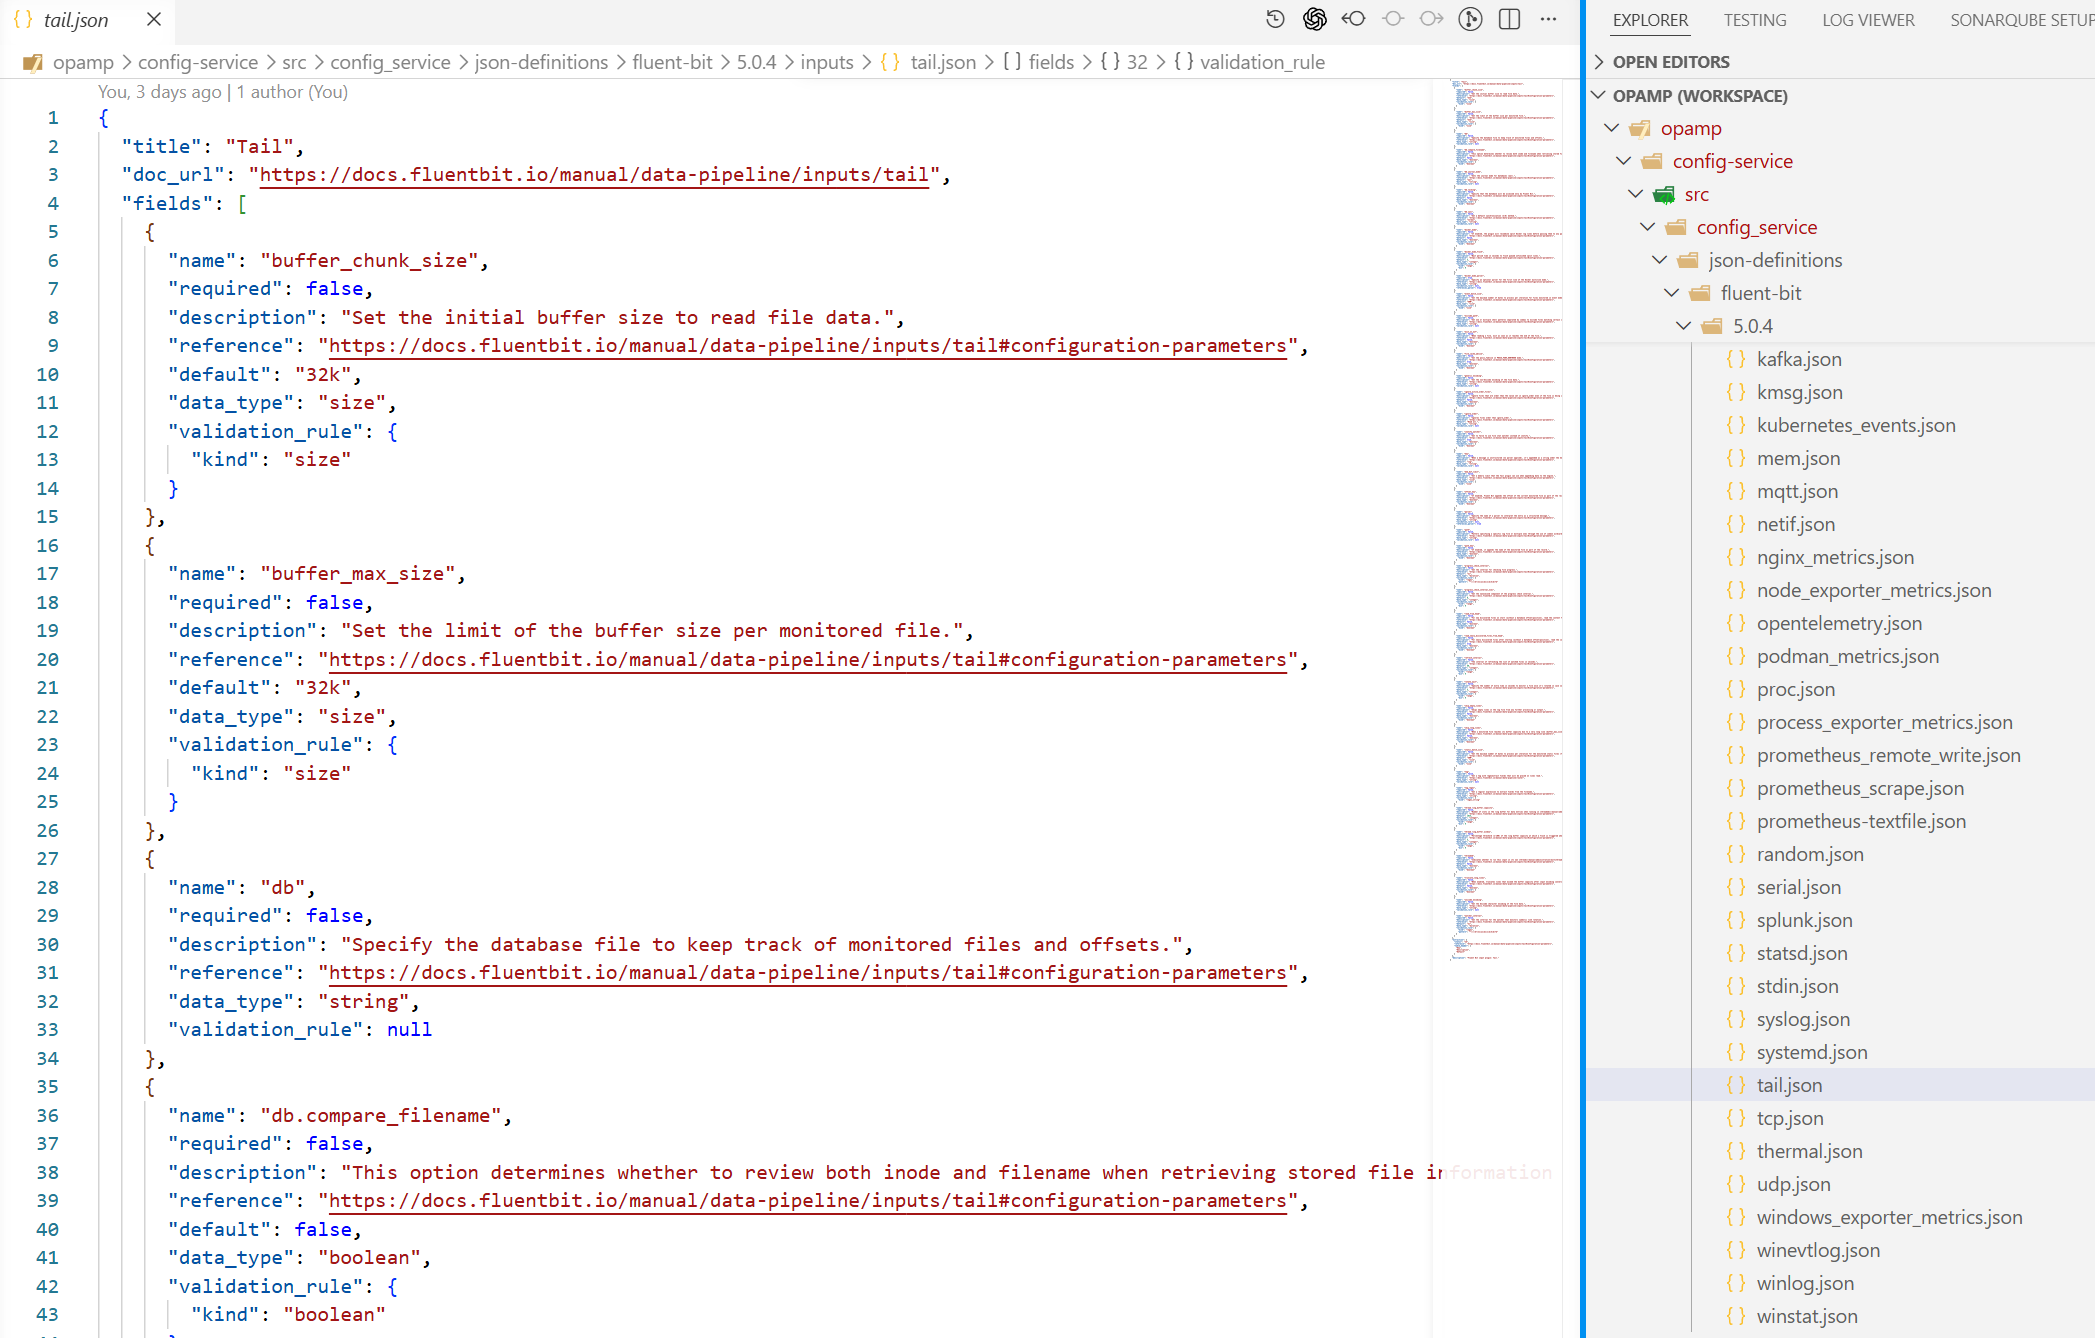
The configuration is considerable, so we refactored the structure to make it far easier to work with, and created some code that can mine Fluent Bit’s GitHub to generate an initial clean set of JSON docs. Of course these need an eyeballing to ensure they’re correct.
The catalogue viewer is a natural extension of the editor and leverages the way we tag configuration files with version details in the editor. The catalogue viewer has a configuration which tells it where to look for candidate files. These are then listed with the metadata.
The catalogue viewer presents all the identified files, which, when selected, if it knows about the config editor, will open the editor with the file. Otherwise, it opens a simple view of the file.
The catalogue viewer works in the same way as the editor in terms of authentication.
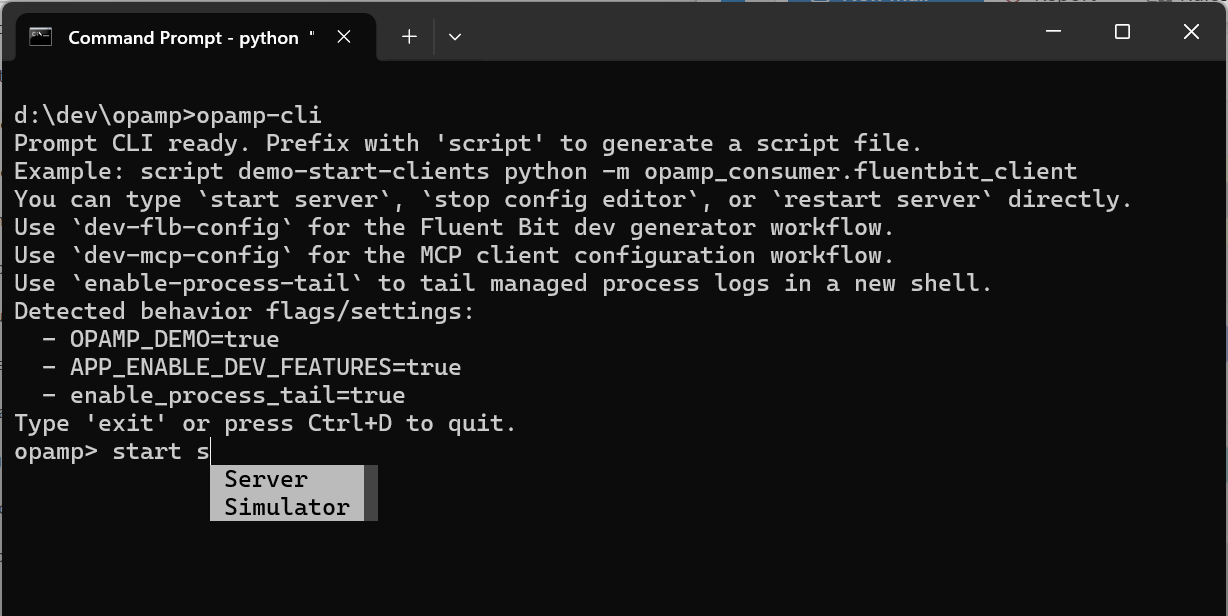
A Command Line tool maybe and odd choice of feature, but we found ourselves creating more and more scripts to support Windows and Bash shells with commonality. So we elected to leverage some frameworks to help reduce the ongoing effort required to maintain them. The utility can be used to generate the command, if you wanted embed the process of starting or stopping a process into the host OS.
The OpAMP documentation suggests that the agent logic is embedded, or wrapped with a supervisor, with the inference that the agent forks the application process. This means that introducing the OpAMP would be invasive. There is a noninvasive variant of the Supervisor that we’ve called Observer. Here, the agent know how to identify the key process by examining the host’s processes. Then tasks such as restarting require an understanding of how to get the OS to trigger, for example, if the service is known to init.d in Linux, we can use the service command.
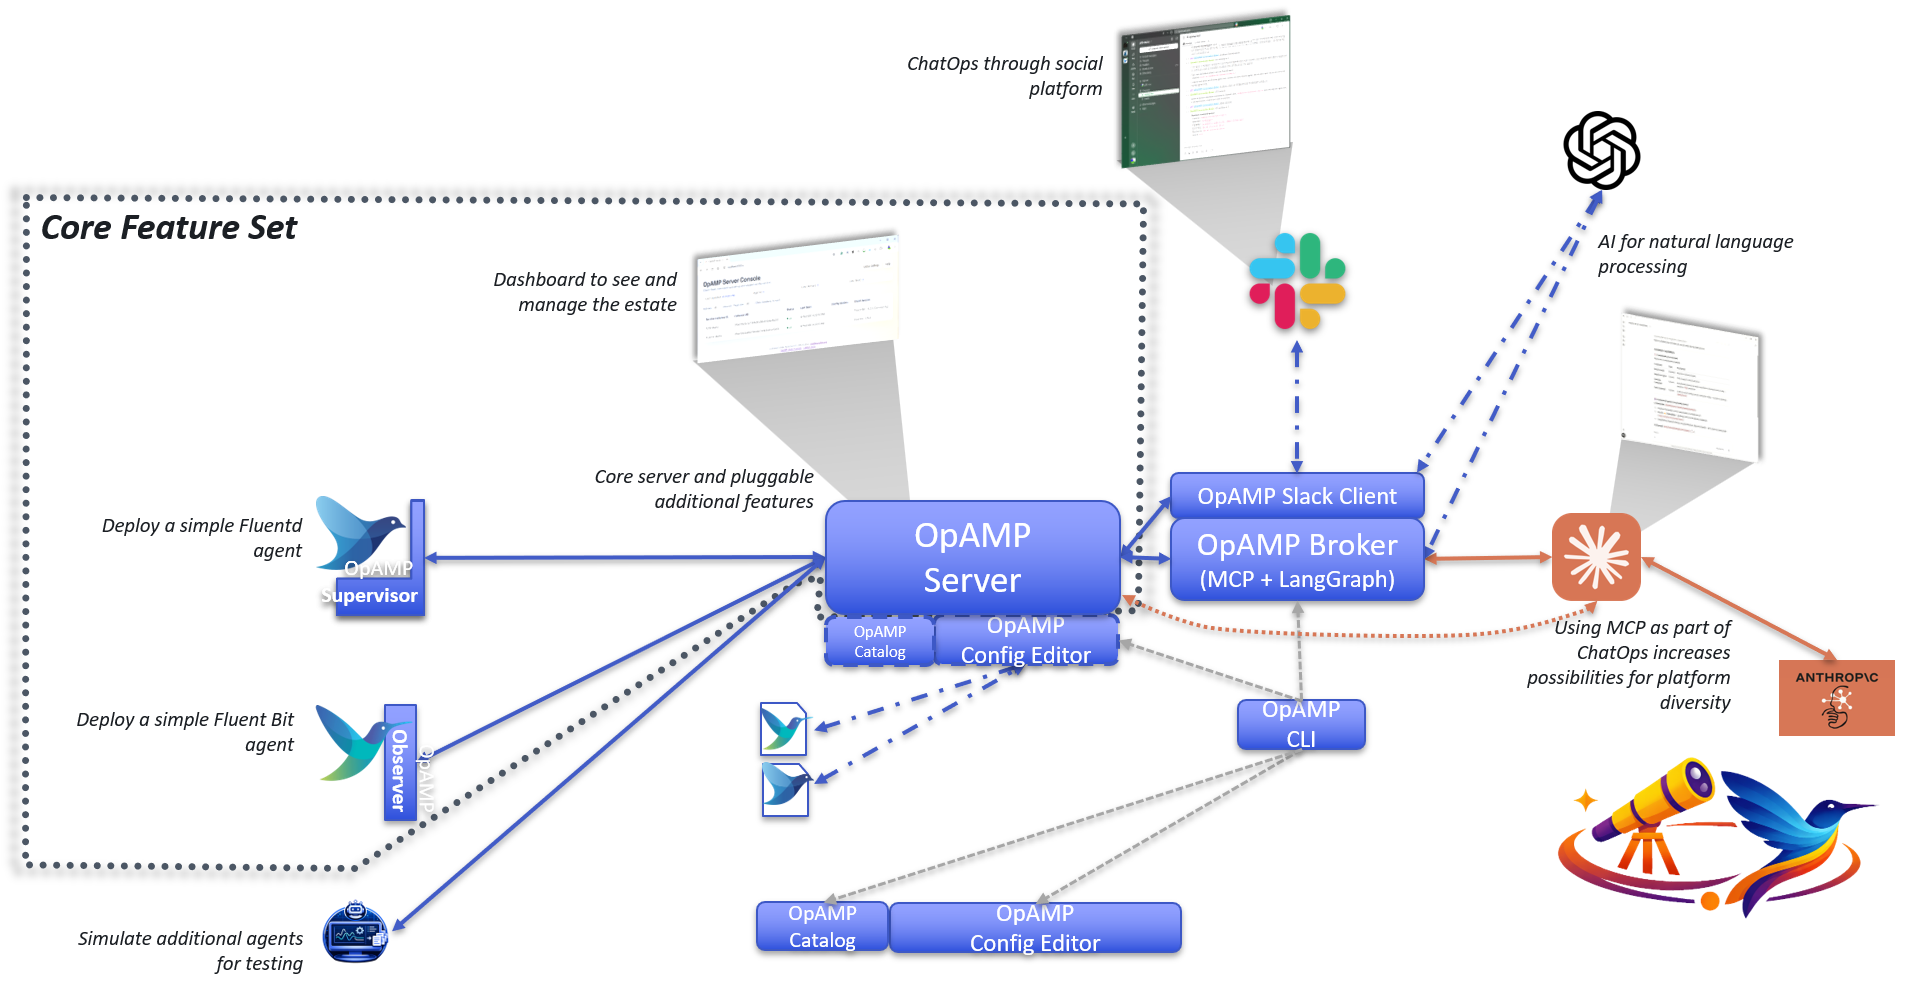
We’ve got the Slack foundations progressed, so we can use natural language VIA langgraph to then work with MCP, which exposes a subset of API capabilities. We’ve developed both the main server and the Broker to support the MCP endpoints, with the Broker acting as a proxy to the regular Server APIs. This means if we want the MCP to be usable from outside our network, then we can separate the Broker and Agent into separate networks so that the wider set of endpoints the server provides aren’t exposed.
But if you don’t want that the MCP endpoint can be switched on.
We have started to address the foundations of managing configuration deployment (for example, if our Catalogue Service is used with the Server, it can be used to select the configuration files to deploy.
Part of config deployment is understanding what is deployed, so we have developed some strategies for versioning Fluent Bit and Fluentd, and I think it will translate to other configuration files (at least into the Observability space).
What we haven’t done is fully implement the process. So we’ll focus on that
There is a lot of functionality here now, including tests with Playwright, but we really need to extend it to provide end-to-end tests in a clean environment that is set up from the various pip and wheel files.
We also want to start making these artefacts easier to retrieve, such as pulling the Wheel or PIP files from GitHub or PyPi.
02 Tuesday Jun 2026
Posted in Fluent Observability, General, OpAMP, Technology
A short post, I’m excited to share that I will be presenting a Webinar for the CNCF Malaga meetup on the 11th June 6.30pm CEST where I’ll be talking about OpAMP – registration link.
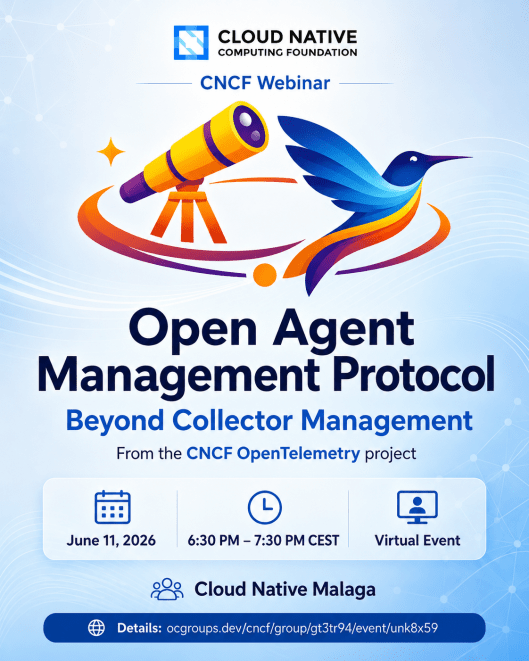
I hope you can join me to hear about the value of the OpAMP protocol, which originated from the CNCF OpenTelemetry project. I’ll be talking about what the protocol can do for us, how it works, and while it has origins within the OpenTelemetry project, it has far-reaching value for almost any deployment context.
This isn’t all theory, I’ll be demoing the functionality we’ve built that leverages the OpAMP spec. While the focus will be on Fluent Bit, it will convey the value of the protocol. We’ll also look at how it can scale in both volume and the range of client applications it can support.
27 Wednesday May 2026
Posted in Fluent Observability, Fluentbit, General, OpAMP, Technology
Fluent Bit’s documentation is spread across many static web pages; in some cases, attributes allowed for a plugin are documented across several pages. There is absolutely nothing wrong with this. Having written a book on Fluent Bit, I can say it makes sense, and if the standard docs went into further detail, it would increase the spread of content.
The problem is, once you’ve got a grip on Fluent Bit, you want a quick reference just to check the attribute names or confirm that an attribute does what you expect.
The good news is that’s what we have created …
Each quick reference page has a section at the top that provides a comma-separated list of all the plugins for the different operations, inputs, outputs, etc., with anchor links to that section. Each plugin has a table that lists all configuration attributes, including those inherited from the Fluent Bit kernel and those introduced by extending another plugin.
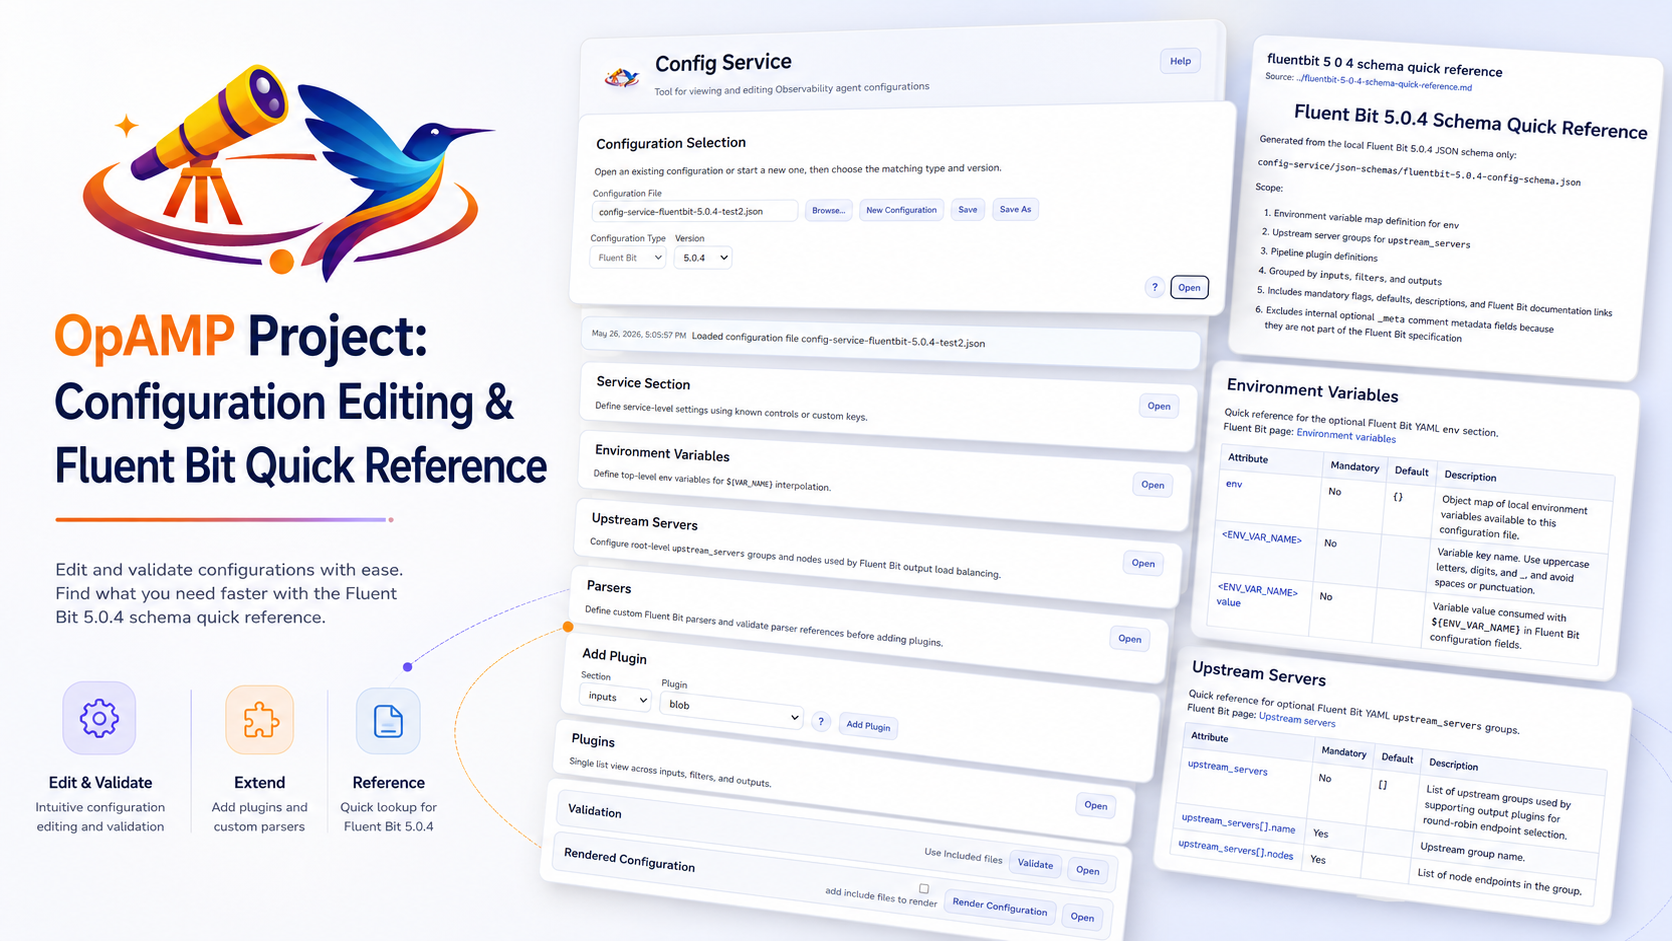
The “why” may prove even more appealing. As part of our OpAMP project, we wanted to make it easy to edit and validate Fluent Bit and Fluentd configurations before deployment using the OpAMP tooling. That tool became the config-service part of the OpAMP repo, and can be independently deployed as well as function as part of the main OpAMP service. As a result, the UI offers the same authentication and authorisation options, ranging from running without authentication to using OAuth.
The key to both the UI and documentation is the use of JSON Schemas, as they contain all the information needed to create documentation just as easily as they power the UI. We have therefore generated a markdown page using a Python script. This means the docs are easy to check (compared to an HTML file) and can be rendered within GitHub. We could extend the script to generate HTML. But rather than trying to remember to keep both document types in sync (and double-check formatting), we found a JavaScript tool (marked.js) that performs an on-the-fly transformation that, as long as we stay within the core Markdown syntax, won’t cause any issues. We’ve then enriched that output a bit by applying stylesheets.
At the moment, we have only covered a subset of Fluent Bit versions, so we will, in due course, expand to cover more versions. Today, this is just the last version from each major release. We haven’t done every version to date as it does take a lot of effort to go through the documentation to generate and check the schema, and we’re still refining things as we enhance the UI.
We are also looking to do the same for Fluentd, though this is much trickier, as the portfolio of plugins that make up the core is smaller than those incorporated into the core of Fluent Bit, and the leveraging of Ruby’s dynamic behaviour makes it very easy for people to offer plugins separately. Then, of course, there is the task of collating all that information.
16 Saturday May 2026
Posted in AI, Books, development, General, Technology
Tags
AI, artificial-intelligence, book, development, LLM, review, Technology, vibe coding, Vibe Engineering
I’ve written a bit about AI in the development process; this has been driven largely by my own experiences, colleagues’ experiences, and blog content from people I trust. So I thought it would be worthwhile to validate my perspectives against those who are more in the know on the subject. So here is my review of the book Vibe Engineering by Tomasz Lelek and Artur Skowroński.
The book opens with a very clear differentiation between vibe coding and vibe engineering (which approximates to what I’ve previously called AI-assisted development). Not only are the key conceptual differences outlined, but the consequences of vibe coding into production are also really driven home …
teams that skip the transition from prototype to engineered artifact consistently report higher defect density, longer incident resolution, and faster architectural decay
The book also shares some real horror stories of blindly trusting LLMs, particularly in operational contexts.
The crucial challenges of vibe coding beyond ideation, PoC, and possibly MVP are brilliantly distilled. Code will do something, but is it right? Is it safe? Will it scale? Can we maintain it?
Tomasz and Artur outline a form of debt called trust debt. Where we have trusted the LLM, and it accumulates issues, particularly with NFRs that are not managed and paid down, it will seriously bite, just as tech debt does. The difference is that tech debt is more readily appreciated and generally easier to understand.
debt is a direct byproduct of the dump-and-review culture. This approach uses AI to generate a large slab of code, opens a pull request, and implicitly offloads responsibility for verification to the reviewer. It’s classic diffusion of responsibility: the presence of the AI (“the model wrote it”) and a reviewer (“someone will check it”) dilutes the author’s ownership of quality
Current approaches to this kind of development can very easily lead to the issues that Human-Machine Interface researchers talk about as automation complacency and the out-of-the-loop problem
The book also highlights interesting parallels, such as those in autonomous vehicle accidents. The consequences may not be as spectacular or as tragic (today), but they can be just as harmful, given that code affects every little aspect of our lives and the decisions we make. It is only a matter of time before it is influenced by vibed code. How long before pressure and a failure to comprehend vibe coding vs vibe engineering creeps into mission-critical development?
Once the consequences and challenges are called out, the book takes us on a journey to illustrate how to better approach vibe development, specifically through defining what a successful outcome should be. The brilliantly simple thing here is that the two approaches are demonstrated with multiple different LLMs using the same prompt.
While the book provides brilliantly illustrated proofs for how to better approach vibing (moving from coding to engineering), Tomasz and Artur point out that this alone is not enough; we need to lean into broader process improvements and leverage good engineering practices.
This first chapter then sets everything up that follows, taking on a journey of re-engineering a solution. Illustrating how to prompt to extract from an existing solution the details that can then be fed as prompts to generate a new solution.
The narrative progresses through considerations such as context compression, then leverages tools to enable the LLM to take on significant tasks, such as UI design, by giving it the information it needs to work out and create React components with a consistent look and feel.
The books reveal some really good ideas that allow things to be developed far more efficiently, for example, rather than expecting the LLM to scan through code, exposing the Language Server, which provides a lot of today’s IDE smarts, such as navigation through the call chain in an application. Exposing the LSP as an MCP tool offers the LLM an efficient and more reliable approach to analysing code.
If you want to follow along and test the points that the book makes, you’re not going to need to fork out masses on LLM tokens; the authors are very clear that the cost to repeat the exercises can be done within free/trial service tiers.
I don’t want to spoil your enjoyment of reading the book by revealing its secrets here. But there is a lot of great content, which means that, with some adjustments to how the LLM is prompted and some setup, it becomes possible to significantly reduce that trust debt.
If you’re heading down the road of vibe-based development, I would highly recommend digging into this book. We’re already making some further refinements to our processes. The changes needed to transition from vibe coding to vibe engineering won’t be shocking to those with a software engineering background. But their adoption is likely to pay back significantly.

12 Tuesday May 2026
Tags
AI, artificial-intelligence, code, generative, LLM, Technology
There are a lot of posts on various platforms about how AI is generating ‘slop’, and it is actually costing a lot of time to take what was generated and put it right. Cleaning up after AI is something people are even incorporating into their online biographies. On the other hand, others indicate they’re getting good results. So what is the reality? I think what we’re seeing is a combination of factors, but there is a healthy dose of human behaviour amplifying the issue.
There is no getting around how well a publicly available foundation AI can perform, depending on the availability of content for training. Providing simple Python logic, which has been asked for with clear precision and expressed clearly, is likely to yield positive results – that’s simply a function of the amount of accessible content on the web. If you asked an AI to generate formal method notations like Z or VDM – good luck.
But when we see what, on the surface, looks good, it is easy to be taken in and start to trust the LLM. Combine that with several other factors:
As you can see, there are plenty of things we, as humans, can do to mitigate ‘AI slop’ and get AI delivering value, quality, and velocity.
The bottom line here is an issue of expectation. We wouldn’t be so harsh as to ask someone with dyscalculia to produce a company’s accounts using only a pencil and paper. Another way to look at it, you’d not ask an unqualified accountant to do your tax return. But that is often what is happening, Someone with dyscalculia could easily ‘hallucinate’ the numbers. An unqualified person is not going to know all the rules needed to complete a tax return well enough to minimise tax exposure.
to err is human; to persist in error is diabolical
Saint Augustine
It is human to make mistakes, and poorly directing (or training) an LLM is certainly an error. But we know this is possible, so we should consider what the code is for and take appropriate steps to mitigate it, working to improve how prompts are given and how context is provided to enable better outcomes.
What is clear to me is that ‘AI slop’ isn’t going away soon, and that as engineers, we have to get better at prompting to get the best code we can from an LLM. While it would be nice to think that the industry will realise that LLMs are not a panacea, and you still need those expensive engineers to prompt an LLM so that they don’t generate unnecessary reams of low-grade, brittle code.
The question really has to be, who is going to build an LLM model and agents that can pre-screen code and call out AI ‘slop’, saving code reviewers (particularly those who are looking after the open-source solutions on which so many of us depend). If Anthropic’s Mythos finds 20-year-old bugs, we should be able to help protect open-source projects from low-quality, poorly prompted AI-generated code.

08 Friday May 2026
Posted in Cloud Native, development, Fluent Observability, Fluentbit, Fluentd, General, OpAMP, Technology
Tags
AI, artificial-intelligence, configuration, development, ELK, Fluent Bit, Fluentd, LLM, observability, OpAMP, Technology
Something that vendors like Microsoft have been really good at is reducing the friction on getting started – from simplifying installations with MSI files and defaulted options through to very informative error messages in Excel when you’ve got a function slightly wrong. Apple is another good example of this; while no two Android phones are the same, my experience is that setting up an iPhone is just so much easier than setting up an Android phone. It is also the setup/configuration where most friction comes from.
Open-Source Software (OSS), as a generalisation, tend to be a bit weaker at minimising friction – this comes from several factors:
The issue that I have observed is that we often go through cycles of working with a technology. For example, you’re building a microservice. Chances are, you’ll start writing and running it locally, without worrying about containerization. Once you’re pretty happy with things, you’ll Dockerize the service, start testing it locally, and then you’ll be ready to deploy it to a cluster. Now you’ll need your YAML. It may well be weeks since you last looked at Helm charts. You end up cutting and pasting your last configuration. But now you need to use another feature of Helm, can you remember the exact settings for the feature. So now you’re trawling the net for documentation, and then it takes several tries to get it right.
AI may well step in to help developers in this area, where solutions and products are well-documented. But with the wrong model or insufficient detail in the prompt, it’s easy to make a mistake. Personally, I’d turn to AI when it becomes necessary to trawl code to better understand the configuration and its behaviour, and to set options.
Solution – well, that depends upon the configuration syntax. We have been experimenting with RJSF (React JSON Schema Form), which provides a React-based UI that can be dynamically driven by a JSON schema and validate data with AJV (an alternative stack considered would have been around JSON Forms).
{ "type": "object", "title": "Dummy", "properties": { "name": { "type": "string", "const": "dummy", "title": "Plugin" }, "copies": { "type": "integer", "description": "Number of messages to generate each time messages are generated.", "x-doc-reference": "https://docs.fluentbit.io/manual/data-pipeline/inputs/dummy#configuration-parameters", "x-doc-required": false, "x-config-data-type": "integer", "default": 1 }, "dummy": { "type": "string", "description": "Dummy JSON record.", "x-doc-reference": "https://docs.fluentbit.io/manual/data-pipeline/inputs/dummy#configuration-parameters", "x-doc-required": false, "x-config-data-type": "string", "default": "{\"message\":\"dummy\"}" }, "fixed_timestamp": { "type": "boolean", "description": "If enabled, use a fixed timestamp.", "x-doc-reference": "https://docs.fluentbit.io/manual/data-pipeline/inputs/dummy#configuration-parameters", "x-doc-required": false, "x-config-data-type": "boolean", "default": false } }}
The above fragment shows part of the Schema definition for the Dummy plugin for Fluent Bit.
By then creating a schema that defines the different plugins, attributes, etc., we can drive validation and menu items easily in the UI. Admittedly, the config file is significant given all the plugins and configuration options, but it is a fair price to pay for a UI that validates the data. Establishing the schema to start with, we’ve covered it through scripting the retrieval and scraping of the Fluent Bit pages, which are pretty consistent in structure.
We have added some custom elements into the definition, for example, x-doc-reference, which allows us to extend the React components to provide features such as a link back to the original documentation as you select attributes or plugins.
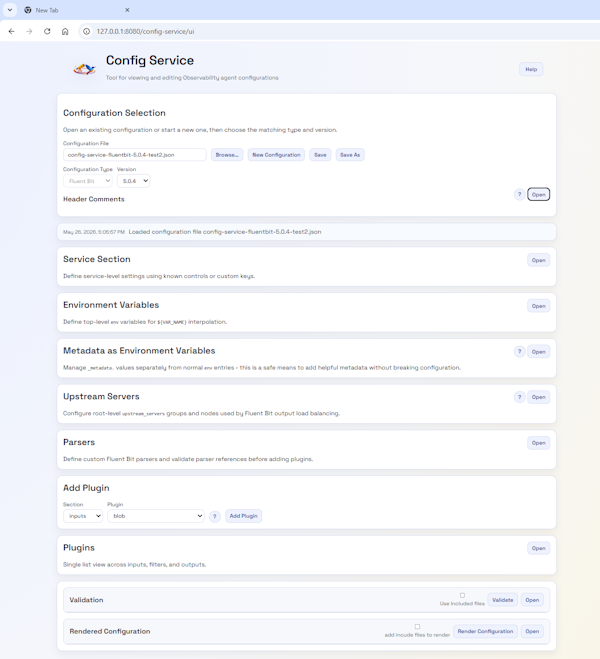
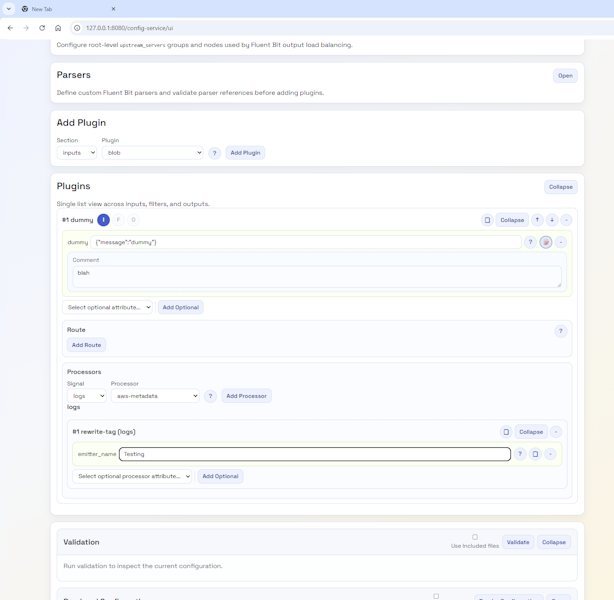
As a result, we very quickly have a UI that can look like this:
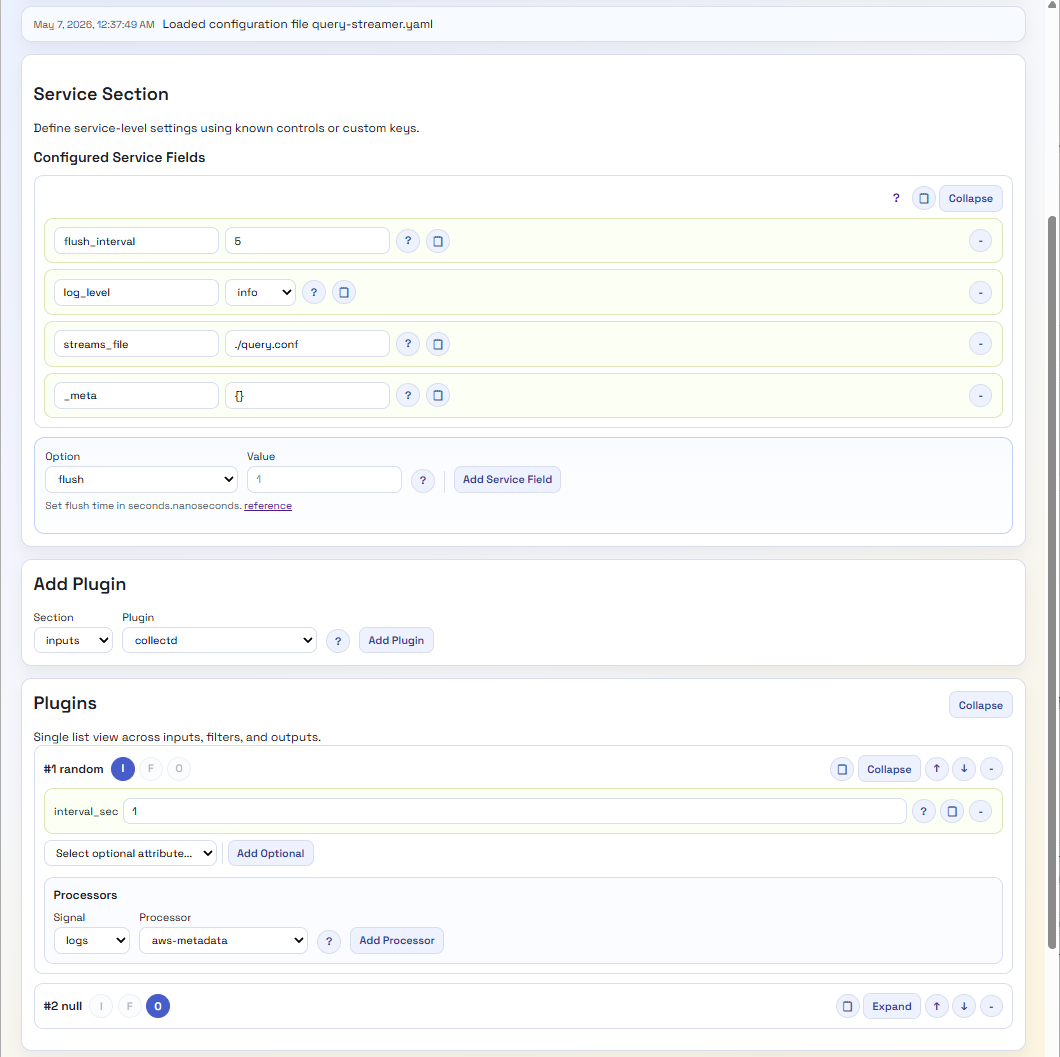
A lot easier to view and tweak, with no need to hunt for valid options. Even if we want more information, we’re just a button click away from the open-source data. Perhaps we should provide a version that hyperlinks to the Manning Live Books on Fluent Bit, etc.
There are a few other factors to consider; for example, Fluent Bit configuration is YAML, not JSON, which can be easily resolved given the relationship between the two standards. Then there are processors that can embed Lua code or a SQL-like syntax. As we’ve chosen to provide a Python backend, we’ve addressed this by providing REST endpoints which can query out of the JSON the code or SQL and perform validation using the Python Lua Parser, and the SQL syntax can be addressed using the Lark library for processing the SQL, as the syntax is simple enough to define and maintain the syntax.
We still need to address several features that Fluent Bit has, specifically:
These issues should be straightforward to overcome, although dynamically including the included elements into the UI view elements can be done. The challenge is: if any changes need to go into something that has been included, how do we push them back to the included file? Particularly if there are multiple layers of inclusion.
Fluentd configuration isn’t JSON-based notation, but it is structured. So, to apply the same mechanism, we’ll need to define a schema and a mapping mechanism. The tricky part of the schema is that Fluentd supports nesting plugins, since the way pipelines are defined for routing differs. While JSON schema will enable this with constructs such as anyOf, oneOf, object nesting, and bounded object arrays, the structure will be more complex.
The second challenge will be the transformer/renderer, so we don’t introduce issues from having to escape and unescape characters, since JSON Schema is stricter about character use.
Well, if we get this going, we’ll probably incorporate the capability into our OpAMP project and maybe create a build that lets the configuration tool run independently. Lastly, perhaps we should look to see if we can make the different layers a little more abstract, so we can plug in editors for other configurations, such as OTel Collectors or the ELK Stack.
As a bonus, perhaps transform the Schema into a quick reference web document?
07 Thursday May 2026
Posted in AI, Books, General, Technology
Tags
As a Manning author, I am fortunate to see the books in their MEAP (early-release state). If you have a Manning online subscription or have already ordered a copy, you’ll have this privilege as well.
I’ve been reading the MEAP copy of Enterprise RAG by Tyler Suard. At the point of writing, there are still 4 more chapters to come. But, of the first 6 chapters, I have to say, I’ve been impressed. With an open, conversational writing style, it makes for an engaging read (I may be biased here, as this is the writing style I prefer).
The book also challenges assumptions and preconceptions about what RAG needs to be. This starts with differentiation between how RAG is typically described and the needs of an enterprise-grade implementation.
While the book leans into Microsoft Azure to illustrate the development of an enterprise-class solution, much of what has been demonstrated could be implemented with any cloud vendor, and if you’re prepared to put in the effort, then completely open-source.
My recommendation: unless you already have business-wide RAG solutions that are well adopted in production, this book is worth taking a look at. Even for the more knowledgeable/experienced, there are some nicely teased out nuggets of insight.
Within the first couple of pages, Tyler addresses the immediate question of what distinguishes Enterprise RAG from a normal RAG. Here, the issue is elegantly laid out in the classic challenge in engineering books: do you focus on the technical functions and ideas, or on the broader challenges of using these technologies? The key here is to separate Enterprise RAG and what Tyler refers to as Naive RAG. He is tackling the difference between the basic technical mechanics of RAG and how to make RAG work at scale within enterprises, as well as the risks, challenges, and benefits of doing so. This is not to say that one approach or another is right or wrong.
In many respects, as you read through, you want to say, ‘duh, that’s obvious‘, and it is once called out. But so many AI-related projects don’t succeed because we overlook these ‘obvious’ things. AI interaction is often embodied in free text interactions, so we can’t configure the UI into showing English, Spanish, French … UI elements- but not everyone has the same native language as the developers, so we forget to allow for this. This is just one of the multitude of things that get called out.
After setting the scene, the book’s chapters are structured to follow the development process, starting with the AI equivalent of test-driven development (TDD) for Chapter 2. The ‘evals’, the evaluation of defined questions and expected results, and how this can be done given LLMs’ non-deterministic outcomes. This, of course, gives us a framework against which we can validate the RAG and prompting process.
Chapter 3 focuses on preparing the data so it can be retrieved and fed to the LLM to answer the question; here, Tyler challenges the working assumption that the data must come from a vector database. The argument made is that for the most effective RAG process, the most effective (relevant and accurate) data is needed; how the data is obtained is secondary to the effectiveness of the data. A vector database may be the right way to source data, but don’t get locked into that thinking. Having made this point, the book does adopt Azure AI Search, which combines vector search with other techniques to deliver the best results (such as using semantic, keyword and ranking techniques). In open source terms, this is like creating a hybridisation of OpenSearch and Vector search.
Chapter 4 takes us into the data retrieval logic and prompt augmentation, now that we have searchable data. This focuses on the use of the Autogen open source framework (sponsored by Microsoft). In many respects, this is the key chapter in terms of logic, as it shows how the framework is used, with multiple agents working in a swarm.
Chapter 5 moves into the non-functional considerations of deployment and scaling, and ensuring that the solution will work under pressure. Such considerations are as important to an enterprise-scale use case as the functional behaviour. While the chapter covers approaches to automation and testing, I was hoping for more. The approaches described are good for getting things moving, but there are enterprise strategy considerations that could at least be called out, such as PII and more advanced credential management. The last point, which I think is a more significant gap, is Observability; the book talks only of logging. No mention of tracing, the measuring of token consumption, etc.
Chapter 6, the last one currently available, is definitely back on track, addressing one of the key considerations: how do we set and manage user expectations? Is my solution addressing expectations? How well is the solution performing? With conventional apps, the very UI layout and labels, as well as menus, help set expectations. If a search doesn’t give you a means to filter by an attribute, you know the result will include things with values for that attribute that aren’t relevant. But AI use cases are typically textual conversations, with no visual cues indicating the limits of an interaction. There are products that can be integrated into web apps that make it easy to track and measure user actions. But with a simple chat panel, that won’t yield much insight. This means we should provide the means to indicate satisfaction (or lack of, and why). This is what the chapter goes into, illustrating how you could shape expectations,
There are some areas I’d like to see addressed, but it is possible, and based on the chapter titles, they will likely be addressed.

You must be logged in to post a comment.