's Blog")
Tags
API, Cloud, development, observability, OpAMP, OTel, Technology
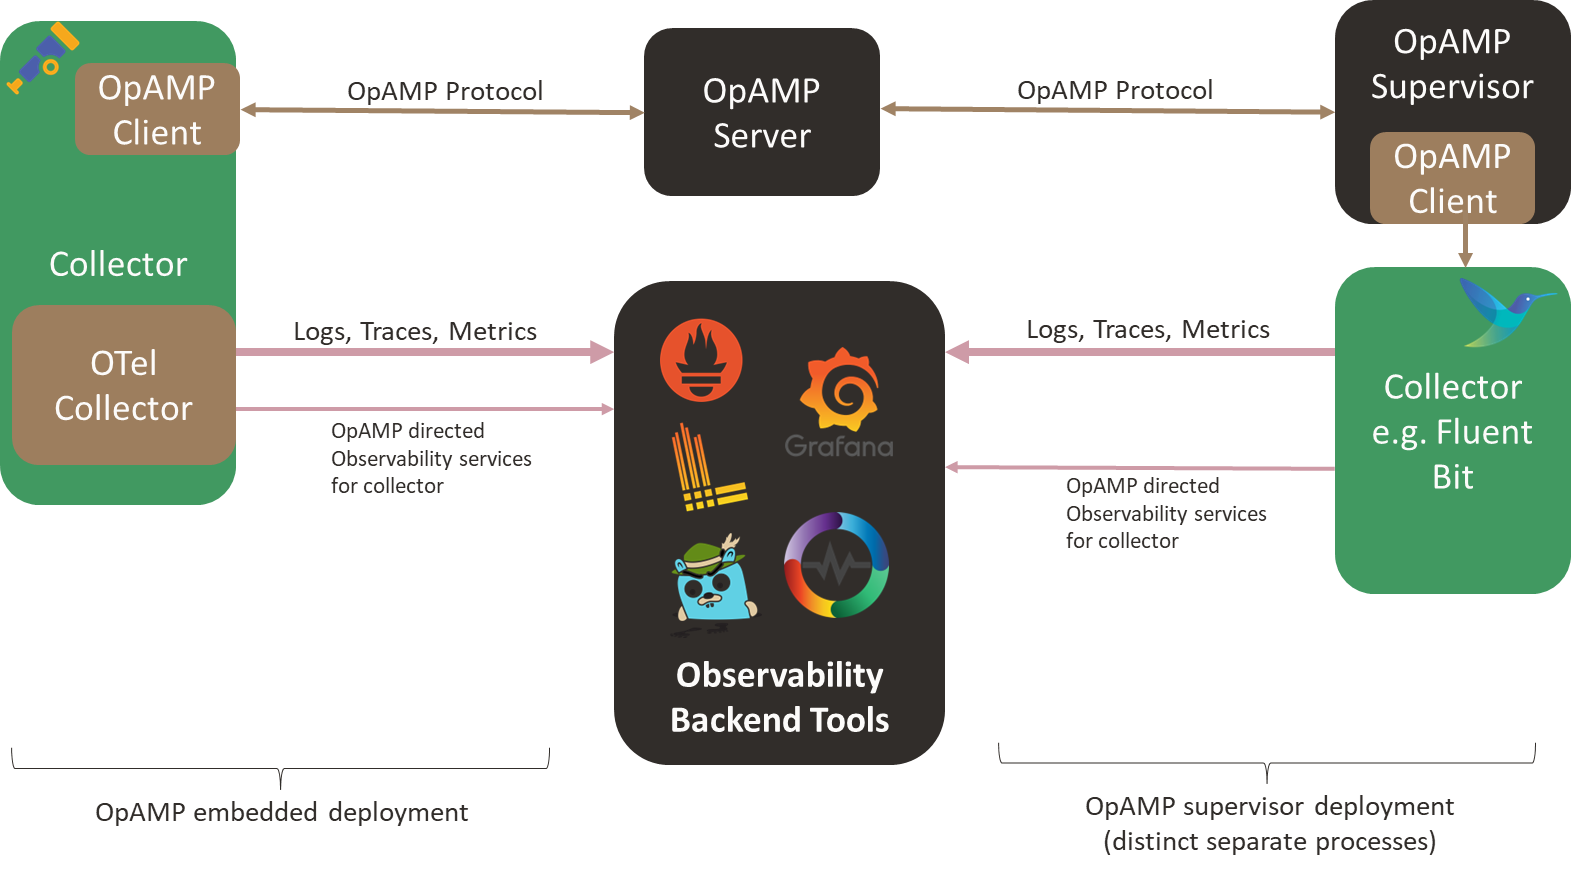
Time to share a short update on our OpAMP project to support Fluent Bit and Fluentd in a supervisor model. We’ve just put a V0.3 label on the GitHub repo (https://github.com/mp3monster/fluent-opamp). The trigger for this has been the refactoring so that the framework on the client side is as reusable as possible for both Fluentd and Fluent Bit (the benefit of implementing Opamp using a supervisor model)
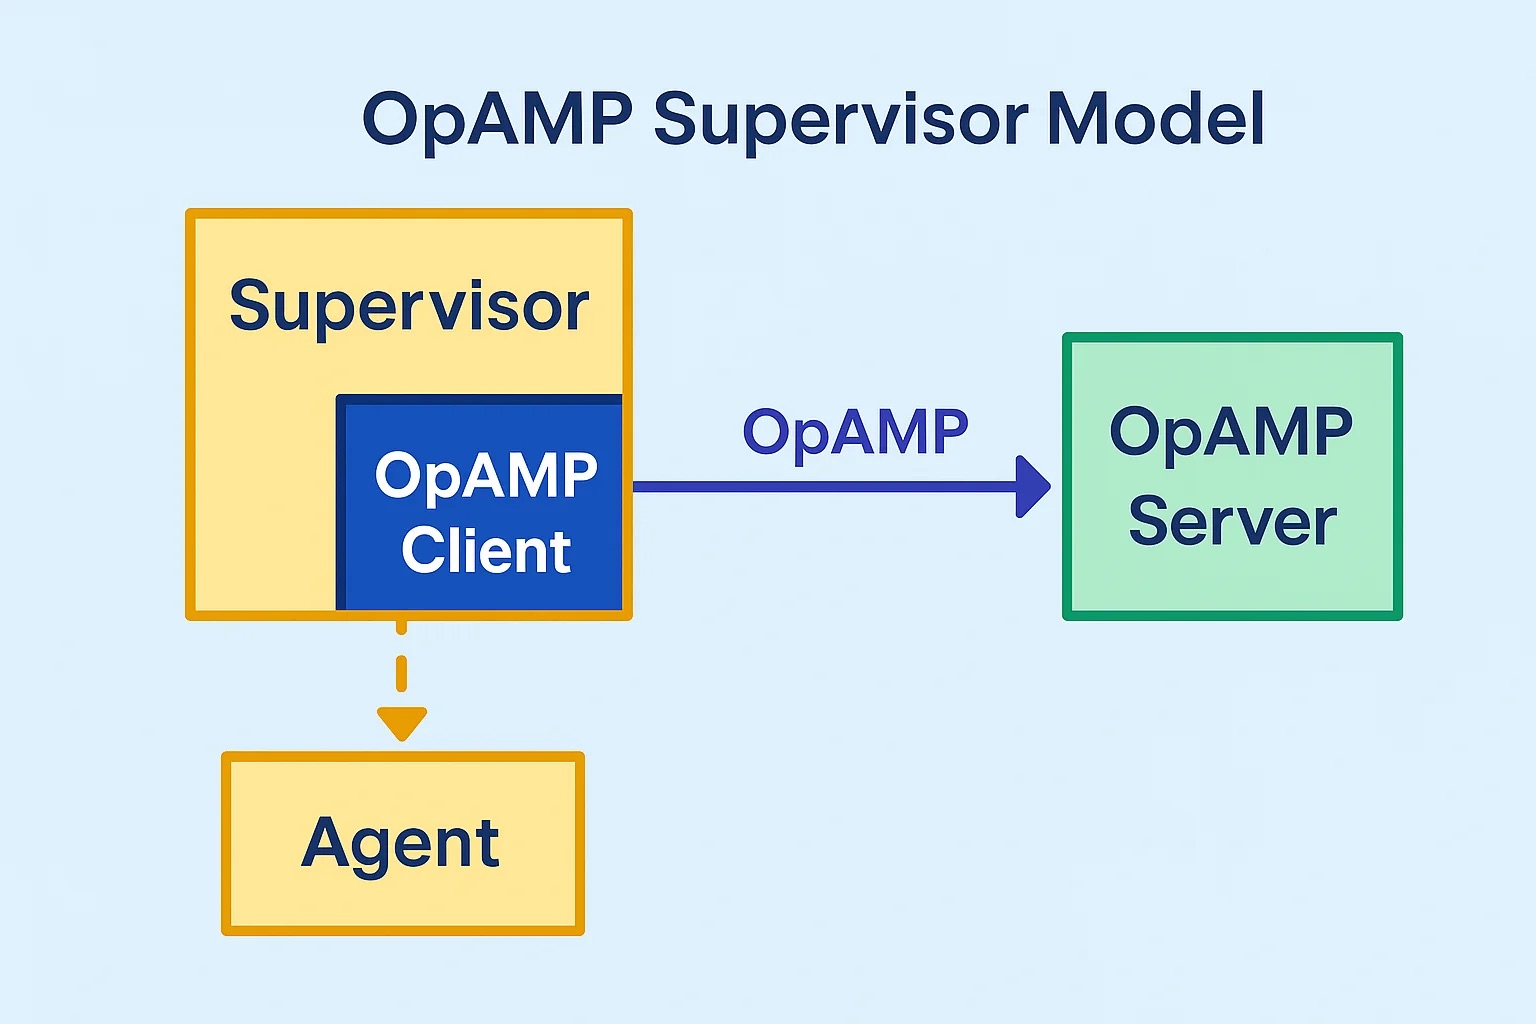
As OpAMP defines what happens between the Client and Server rather than how the client, server and agent must behave as well as the protocol we’ve introduced some features not mandated by the standard but can be delivered using the OpAMP framework. Such as shutting the agent down completely.
The following sections summarize what has recently been incorporated.
What’s New in Our OpAMP Supervisor Stack
Over the last set of releases, we focused on three areas that matter in day-to-day operations:
- Better multi-agent support through a cleaner client architecture for both Fluent Bit and Fluentd.
- Optional bearer-token authentication that can be enabled in production and disabled for fast local development and tests.
- Clear, predictable rules for when a client sends a full state refresh back to the server.
This post is a walkthrough of what changed and why.
Client Architecture Refactor: Fluent Bit and Fluentd as First-Class Implementations
We restructured the consumer so Fluent Bit and Fluentd are now explicit concrete implementations built on a shared abstract client.
Why this matters
Before this work, behavior could drift toward Fluent Bit defaults in places where Fluentd needed different handling. The new structure makes those differences deliberate and visible.
What we changed
- Shared logic is centralised in a typical abstract client and reusable mixins.
- Fluent Bit remains the default implementation with shared runtime behaviour.
- Fluentd overriding functionality for Fluentd-specific behaviour, including:
- monitor agent config parsing from
fluentd.conf/YAML - monitor agent endpoint usage for version and health
- Fluentd-specific health parsing and service type handling
- monitor agent config parsing from
Operational improvements
We’ve created scripts to make it easy to get things started quickly. The startup scripts were standardized:
scripts/run_fluentbit_supervisor.sh|cmdscripts/run_fluentd_supervisor.sh|cmdscripts/run_all_supervisors.sh|cmd
Optional Bearer-Token Authentication (With a Fast Disable Switch)
We added optional bearer-token auth for the UI and MCP end points in the server. The OPAMP spec points to different authentication strategies that need to be addressed. For bearer-token-managed endpoints (where you can direct the server to do things that are potentially much more harmful), the design goal is to keep development and unit testing simple, so we have some controllable modes..
Modes
Authentication is controlled by environment variables:
disabled(default): no auth checks.static: bearer token checked against a configured shared token.jwt: JWT bearer validation via JWKS (for example with Keycloak).
Why this model works
- Production can enforce auth with static or JWT validation.
- Local development and endpoint unit tests can run with auth disabled, avoiding unnecessary test harness complexity.
- The same app can move between dev/staging/prod by environment configuration, without code changes.
Protected endpoints
Protection is prefix-based (for example /tool, /sse, /messages, /mcp) and configurable.
This means teams can gradually expand the scope of protection over time by updating path prefixes, rather than doing an all-or-nothing rollout.
Auth observability
Authorisation rejections are logged with mode, method, path, source, and reason, making failed requests easier to troubleshoot.
Full-State Refresh Rules: More Predictable and Easier to Reason About
A major part of OpAMP behavior is deciding when to send compact updates versus a fuller state snapshot. We now fully observe the approach defined by OpAMP, but also have explicit controller-driven rules to provide robustness to the solution.
Core mechanism
The client tracks reporting flags for optional outbound sections, such as:
agent_descriptioncapabilitiescustom_capabilitieshealth
If a flag is set, that section is included on send. After inclusion, the flag resets. Controllers determine when those flags are re-enabled for a future full refresh.
Controller strategies
We support three controller types:
AlwaysSendre-enable all report flags after eachsuccessful send.SentCount: re-enable all report flags after N successful sends (fullResendAfter).TimeSend: re-enable all report flags after a configured elapsed interval.
Important behaviour detail
Controller updates happen after a successful send. This means a controller schedules what the next message should include; it does not mutate the already-transmitted message.
Server-driven override
If the server sets ReportFullState in ServerToAgent.flags, the client immediately re-enables all reporting flags so the next outbound message contains full reportable state.
This gives operators a direct way to request state re-synchronization when needed.
Security + Developer Experience Balance
A recurring theme in this work was avoiding “security vs usability” tradeoffs:
- Auth can be strict in production.
- Auth can be disabled in local/test workflows.
- Endpoint protection scope is configurable and incremental.
- Rejection logging is explicit for troubleshooting.
That same principle guided client behavior:
- Shared behavior is centralized.
- Agent-specific behavior is explicit where required.
- Full refresh rules are deterministic and configurable.
What This Enables Next
This foundation makes the next iterations easier:
- extending JWT/IdP deployment patterns (for example, broader Keycloak automation)
- adding more agent variants with fewer regressions
- improving configuration and rollout safety for mixed Fluent Bit + Fluentd estates
If you’re running both Fluent Bit and Fluentd, this release should make the platform easier to operate, easier to secure, and easier to reason about under change.


You must be logged in to post a comment.