
• Home
  • Site Aliases
    • www.cloud-native.info
  • About
    • Background
    • LinkedIn
    • Presenting Activities
    • Internet Profile
    • About
  • Books & Projects
    • Logs and Telemetry using Fluent Bit
      • Fluent Bit book
      • Book Resources in GitHub
      • Fluent Bit Classic to YAML Format configurations
    • Logging in Action with Fluentd, Kubernetes and More
      • Logging in Action with Fluentd – Book
      • Fluentd Book Resources
      • Fluentd & Fluent Bit Additional stuff
    • OpAMP
    • Log Generator
    • API & API Platform
      • API Useful Resources
    • Oracle Integration
      • Book Website
      • Useful Reading Sources
    • Publication Contributions
  • Resources
    • GitHub
    • Oracle Integration Site
    • Oracle Resources
    • Mindmaps Index
    • Useful Tech Resources
      • Fluentd & Fluent Bit Additional stuff
      • Recommended Tech Podcasts
      • Official Sources for Product Logos
      • Java and Graal Useful Links
      • DevTips
  • Music
    • Monster On Music
    • Music Listening
    • Music Reading

Phil (aka MP3Monster)'s Blog

~ from Technology to Music

Phil (aka MP3Monster)'s Blog

Tag Archives: metrics

Fluent Bit leveraging OpAMP connection sharing

20 Monday Jul 2026

Posted by mp3monster in Fluent Observability, General, OpAMP, Technology

≈ Leave a comment

Tags

configuration, Fluent Bit, logs, metrics, observability, OpAMP, Open Telemetry, OTLP

Another aspect of OpenTelemetry’s OpAMP protocol is the ability to share connections details, not just between the server side of the OpAMP protocol, but with other connections a collector like Fluent Bit could be using such as an OTel consumer for logs, traces and metrics that are being collected that could be a managed Grafana service or another Fluent Bit if you’re using a concentrator network.

This is includes Observability data generated by the collector I.e. Fluent Bit in our case.

Yes, but Fluent Bit doesn’t push its own OTel signals

It is true that out of the box Fluent Bit doesn’t push OTel signals for itself. But this is easily fixed. We can control logging, and metrics that are exposed (and today no traces are produced). The solution is simple, we use Fluent Bit itself to collect the logs and metrics and route them to using an OTel output plugin.

While creating a configuration for sharing seems onerous, once you’ve done it once, you can simply include the config file in every deployment. Further more, if you backend for any of the signals is not Fluent Bit conversant, just use a different Fluent Bit plugin.

Config walkthrough

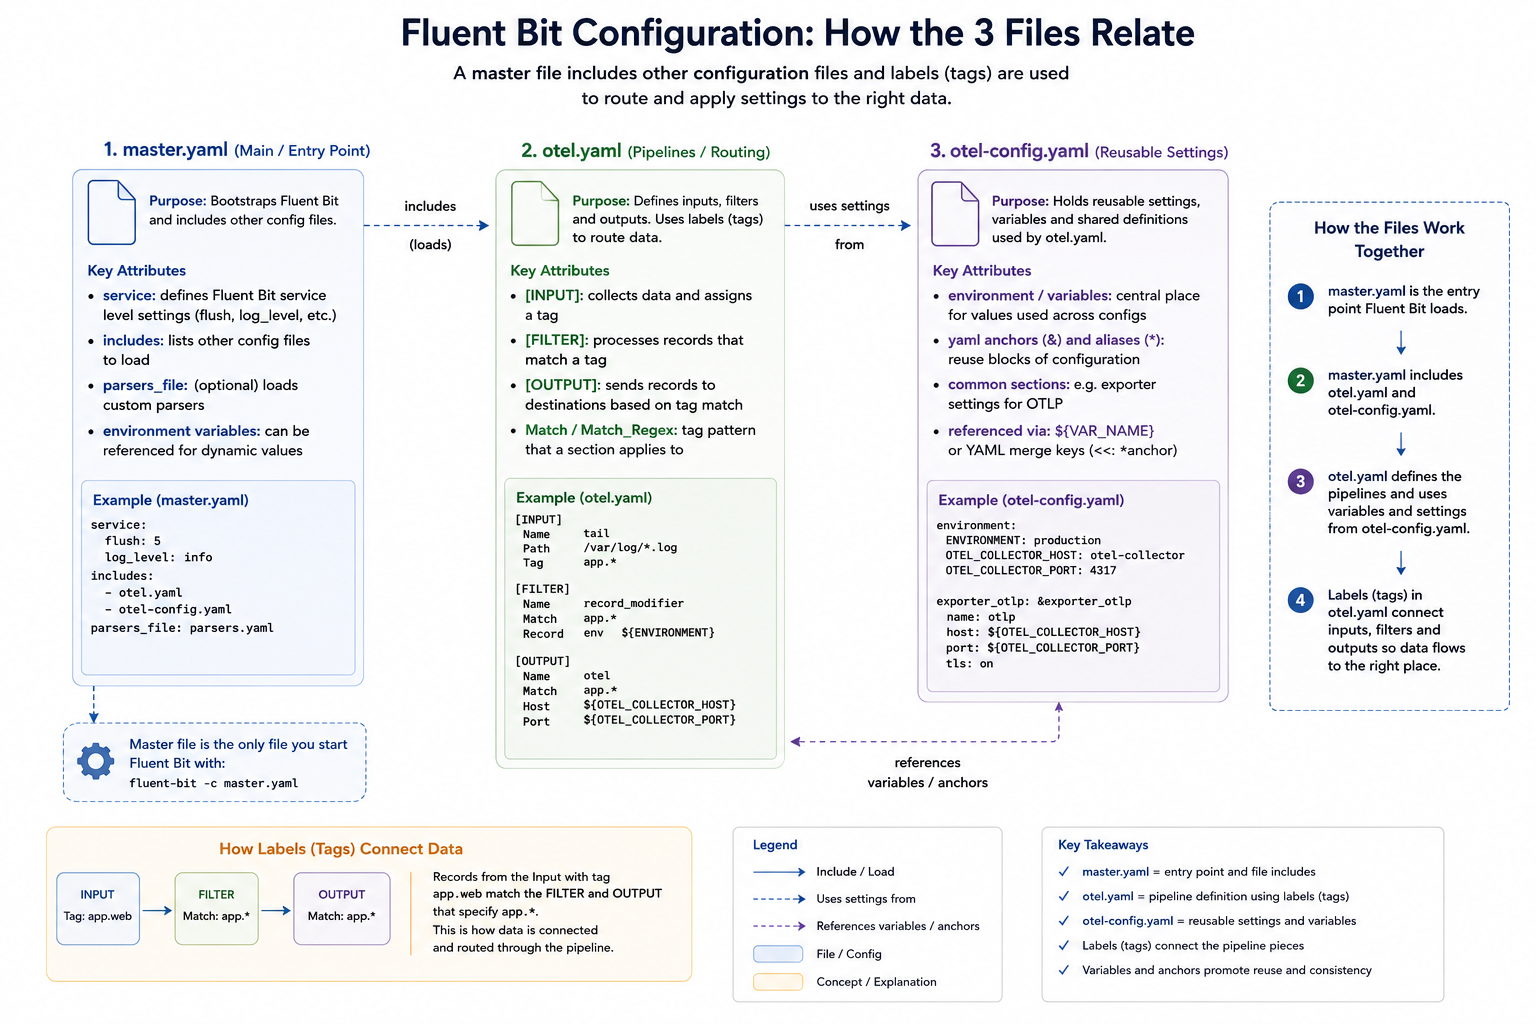
Our configuration consists of several files, which we’ll explain. We’ve adopted a multi-file setup, which works through the use of Fluent Bit’s includes capability so we can separate out the application-level observability configuration (master.yaml), the configuration to allow us to observe Fluent Bit itself (otel.yaml), and the configuration for the connection parameters (otel-config.yaml).

Master.yaml

The master.yaml contains our application observability settings and is the configuration file we pass to Fluent Bit. In this case, we’re simply using a dummy input that’s fed to a file output; we’ve also got a wildcard stdout configuration to make it easy to observe what’s going on from the command line.


includes: 
  - otel.yaml

service:
  flush: 1
  log_level: debug
  http_server: ${http_server}
  http_listen: ${http_listen}
  http_port: ${http_port}
  log_file: ${log-file}

pipeline:
  inputs:
    - name: dummy
      tag: dummy.activity
      dummy: '{"message":{"msg":"grafana-cloud test event","service":"fluent-bit","source":"dummy"}}'


  outputs:
    - name: stdout
      match: "*"
      format: json_lines

    - name: file
      match: "dummy.*"
      file: dummy.log


There are at this level, two telltale signs of self-monitoring at this level:

  • The includes declaration picks up otel.yaml, which includes additional inputs and outputs, as well as service configurations.
  • The service settings that switch on the HTTP server. It is controlled via environment variables, so you could switch this off easily. We have to implement these settings here, as within the full set of file inclusions, there can only be a single service block.
  • The service declaration also specifies where we want the log file that the Fluent Bit setup needs to go.

otel.yaml

We’ve separated the pipeline definitions for Fluent Bit observability to reuse the configuration across many deployments. As different deployments may need to talk to different instances of the observability backend (for example, when operating in a multi-cloud arrangement we have defined the environment variables that provide the credentials and target address).

We have defined additional environment variables at this level, so that anyone needing to understand master settings and the service values needs only look here. How this layer (or layers) is established is, to an extent, concealed. It also means we can use OpAMP to generate a configuration file, but we’ll come back to that.


includes: 
  - otel-config.yaml

env:
  http_server: on
  http_listen: 0.0.0.0
  http_port: 2020
  log_file: ${own-log-file}

pipeline:
  inputs:
  - name: fluentbit_metrics
    tag: fb.metrics

  - name: tail
    path: ${own-log-file}
    tag: ${own-log-file}

  outputs:
  - name: opentelemetry
    match: "*"
    host: ${otel-host}
    port: 443
    http_user: ${otel-user}
    http_passwd: ${otel-password}
    logs_uri: ${own-otel-logs}
    metrics_uri: ${otel-metrics}
    traces_uri: ${otel-traces}
    tls: on
    tls.verify: off
    log_response_payload: true
    logs_body_key: message
    add_label:
      - environment dev
      - destination grafana-cloud

The environment variables that we define to be used by the master.yaml switch the HTTP server on, and indicate which ports to use. Making this easy to check for the person or people defining the master.yaml makes it easier to avoid port collisions.

We also tell Fluent Bit where to write its logs through the service setting. To consolidate the configuration, that value references a different environment variable, so we can put all of our configurations together. Even if we didn’t have this level of redirection, it is worthwhile setting the value using an environment variable as the file location is needed both as our output for the service and the input for a plugin.. As you can see, we’ve just named the file. So the file created will be relative to wherever we run Fluent Bit from.

Let’s look at the inputs and outputs being used, and what they do:

  • Tail – this is the input that reads Fluent Bit’s logs, as we set Fluent Bit to log at debug level, we’ll see plenty of activity. Having Fluent Bit write to the file system, only for a thread in the same process to read it, is obviously inefficient. It can be optimised by using a RAMFS-like filesystem on Linux and a RAMDisk-like filesystem on Windows, so everything is in memory.
  • Fluentbit_metrics – this is the active collection of metrics, which we simply point to the server part of Fluent Bit. If you’re using Fluent Bit as a sidecar in a pod, this has to be done carefully because of how networking for containers within a pod is handled.
  • opentelemetry – This takes our different input signals we’ve been collecting and pushes them to the OTel-compliant service. If we had different backend products for different types of signals, then we’d need different or multiple plugins defined. Although OpAMP does infer an OTel-compliant backend.

That is the hard bit done. As a result of these inputs, we get the metrics and logs (and no traces are available). We now just need an OpenTelemetry output plugin to direct all the OTLP-represented signals. For simplicity, we’ve made use of a free account on Grafana Cloud.

otel-config.yaml

This configuration file is simple, which is key to making it easy for us to manage the connections setup using OpAMP. It simply defines the connection-based attributes needed, as shown:

env:
otel-user: '-my Grafana Cloud Accound Id-'
otel-password: '-my Grafana Cloud Account Token-'
otel-logs: '/otlp/v1/logs'
otel-metrics: '/otlp/v1/metrics'
otel-traces: '/otlp/v1/traces'
own-log-file: 'flb.log'
otel-host: 'otlp-gateway-prod-gb-south-1.grafana.net'

While populating credentials in a file isn’t ideal, it makes it pretty straightforward for an OpAMP Client (observer or supervisor) to receive the credentials for the management side of the protocol, make them available to Fluent Bit quickly, and have Fluent Bit pick them up dynamically via hot-deploy functionality. This is precisely what we have implemented in our OpAMP. This approach works for both Fluent Bit and Fluentd configurations and we can even apply a similar approach for driving clients such as Elastic Beats.

This configuration file is simple enough that we can rewrite it whenever the configuration values are amended; there is no complexity in inserting such settings into the broader configuration. Furthermore, if Fluent Bit were running as an observed process rather than a supervised (i.e., child) process, setting environment variables could become problematic.

We can mitigate credential-related challenges in the file system by restricting filesystem permissions to the file being written, so only certain users and processes can access it. When working with containers, we can also keep this part of the file system within the image by using a transient storage layer.

Alternative strategy for securing credentials

An alternative approach would be for the client to receive the credentials and store them in an encrypted method, such as a credentials vault, and then the launcher for the process would read and decrypt the file as it launches Fluent Bit or another collector. The way we have implemented the client for our OpAMP certainly makes this possible, but it also complicates the process and suggests that the mechanics of credential management would be better handled by a distributed vault solution.

OpAMP’s assumption

The only niggle, is that when passing the connections, the protocol assumes that connection details are only needed for the collector. That’s fine if the collector includes the client side of the protocol. But as we know, the collector may be managed with a supervisor or observer process. We could use the connection for the collector and our supervisor, but that may not be what is wanted.

Visualising the configuration

We can visualise the relationships, like this:
Unpacking the server-side aspects

As you start to think about the server aspect of this, it gets potentially very complex. In simple scenarios, sending everything to a single Observability backend isn’t an issue.

But if you’re managing a multi-cloud, hybrid, or managed client setup, you’re likely to want separate backend instances for different collectors. In our setup, that means passing the different connection details to the client to populate otel-config.yaml. Understanding this deployment will require understanding the distribution. We will also need to manage potentially a concentrated catalogue of credentials, which will need to map to the collector nodes, and a means for the user to define the mapping. Creating a means to visualise the mapping, and ideally to allow the server to apply rules or infer assignments for more complex use cases such as multi-cloud, isn’t going to be simple.

Conclusion

We have a simple means to deploy configuration and observe our collector and the supervisor/observer process. Making server-side management in a large-scale environment easy to work with will require some consideration and potentially additional optional metadata. But the protocol supports all of this, but doesn’t mandate specifics. Which does mean that either the server has to be smart enough to know when what to do if it interacts with a client that has been built or configured to work with this server – which is an essential requirement, otherwise we lose the value of the
Share this:

  • Share on Facebook (Opens in new window) Facebook
  • Share on X (Opens in new window) X
  • Share on Reddit (Opens in new window) Reddit
  • Share on LinkedIn (Opens in new window) LinkedIn
  • Email a link to a friend (Opens in new window) Email
  • Share on WhatsApp (Opens in new window) WhatsApp
  • Print (Opens in new window) Print
  • Share on Tumblr (Opens in new window) Tumblr
  • Share on Mastodon (Opens in new window) Mastodon
  • Share on Pinterest (Opens in new window) Pinterest
  • Share on Bluesky (Opens in new window) Bluesky
Like Loading...

Checking your OpenTelemetry pipeline with Telemetrygen

30 Tuesday Apr 2024

Posted by mp3monster in Fluentbit, Fluentd, General, Technology

≈ Leave a comment

Tags

Docker, docker compose, FluentBit, Go, logs, metrics, OpenTelemetry, signals, Telemetrygen, Traces

Testing OpenTelemetry configuration pipelines without resorting to instrumented applications, particularly for traces, can be a bit of a pain. Typically, you just want to validate you can get an exported/generated signal through your pipeline, which may not be the OpenTelemetry Collector (e.g., FluentBit or commercial solutions such as DataDog). This led to the creation of Tracegen, and then the larger Telementrygen.

You can use Tracegen or Telemetrygen by either downloading and running the Go app from GitHub or using the Docker file. But there are a couple of challenges:

  • On initial investigation, these utilities appear wrapped up in the larger opentelemetry-collector-contrib. While potentially useful, shaking out your OTel pipelining is somewhat overkill.
  • We can install the app locally with the following command, but then we need to set up Golang in the environment.
go install github.com/open-telemetry/opentelemetry-collector-contrib/cmd/telemetrygen@latest
  • Fortunately, there is a Docker image that just contains the tool, but to use it, we need to know what the parameters are to override the container defaults. The only irritant is that you either need to mess about with the container to get at the information (i.e., run the — help options) or install the utility (the parameters are not in the GitHub docs), so we’ve teased out all the options into the following table.

The following table’s Signal column All means it can be applied to Metrics, Traces, or Logs. Otherwise we’ve named the signal type that the parameter can be used with.

SignalParameter/FlagDescription
Trace–batchWhether to batch traces (default true)
All–ca-cert stringTrusted Certificate Authority to verify server certificate
Traces–child-spans intClient certificate file

All
–client-key stringClient private key file
All–duration durationFor how long to run the test
All-h, –help {traces|metrics|logs}help – with give you the basic help if no parameter is passed. Or the signal type help when used with the signal name e.g. telemetrygen traces --help
All–interval durationReporting interval (default 1s)
Traces–marshalWhether to marshal trace context via HTTP headers
All–mtlsWhether to require client authentication for mTLS
All–otlp-attributes map[string]stringCustom resource attributes to use. The value is expected in the format key=”value”. Note you may need to escape the quotes when using the tool from a cli. Flag may be repeated to set multiple attributes (e.g --otlp-attributes key1=\"value1\" --otlp-attributes key2=\"value2\")
All–otlp-endpoint stringDestination endpoint for exporting logs, metrics and traces
All–otlp-header map[string]stringCustom header to be passed along with each OTLP request. The value is expected in the format key=”value”. Note you may need to escape the quotes when using the tool from a cli. Flag may be repeated to set multiple headers (e.g --otlp-header key1=\"value1\" --otlp-header key2=\"value2\")
All–otlp-httpWhether to use HTTP exporter rather than a gRPC one
All–otlp-http-url-path stringWhich URL path to write to (default "/v1/traces")
All–otlp-insecureWhether to enable client transport security for the exporter’s grpc or http connection
All–rate intApproximately how many metrics per second each worker should generate. Zero means no throttling.
Traces–service stringService name to use (default "telemetrygen")
Traces–size intDesired minimum size in MB of string data for each trace generated. This can be used to test traces with large payloads, i.e. when testing the OTLP receiver endpoint max receive size.
Traces–span-duration durationThe duration of each generated span. (default 123µs)
Traces–status-code stringStatus code to use for the spans, one of (Unset, Error, Ok) or the equivalent integer (0,1,2) (default “0”)
All–telemetry-attributes map[string]stringNumber of traces to generate in each worker (ignored if the duration is provided) (default 1)
Traces–traces intNumber of traces to generate in each worker (ignored if duration is provided) (default 1)
All–workers intNumber of workers (goroutines) to run (default of 1)
Metrics–metric-type metricTypeNumber of metrics to generate in each worker (ignored if the duration is provided) (default 1)
Metrics–metrics intNumber of logs to generate in each worker (ignored if the duration is provided) (default 1)
Logs–body stringBody of the log (default “the message”)
Logs–logs intThe severity number of the log ranges from 1 to 24 (inclusive) (default 9)
Logs–severity-number int32The severity number of the log ranges from 1 to 24 (inclusive) (default 9)
Logs–severity-text stringSeverity text of the log (default “Info”)
All the configuration parameters for Telemetrygen

It is worth noting that while Tracegen has similar configuration parameters, they aren’t exactly the same in the CLI, often one dash rather than two in the name for example.

The following is a simple Docker compose file that can help you use the container to conduct local testing of your collector. In this configuration, we’re sending a trace to the host machine with HTTPS disabled.

services:
  web:
    image: ghcr.io/open-telemetry/opentelemetry-collector-contrib/telemetrygen:latest
    network_mode: host
    entrypoint:
      [
        "/telemetrygen",
        "traces",
        "--otlp-insecure",
        "--otlp-endpoint",
        "host.docker.internal:4317",
      ]

Share this:

  • Share on Facebook (Opens in new window) Facebook
  • Share on X (Opens in new window) X
  • Share on Reddit (Opens in new window) Reddit
  • Share on LinkedIn (Opens in new window) LinkedIn
  • Email a link to a friend (Opens in new window) Email
  • Share on WhatsApp (Opens in new window) WhatsApp
  • Print (Opens in new window) Print
  • Share on Tumblr (Opens in new window) Tumblr
  • Share on Mastodon (Opens in new window) Mastodon
  • Share on Pinterest (Opens in new window) Pinterest
  • Share on Bluesky (Opens in new window) Bluesky
Like Loading...

Observing the Observer (Fluent Bit monitoring)

25 Thursday Apr 2024

Posted by mp3monster in Fluentbit, General, Technology

≈ Leave a comment

Tags

development, FluentBit, Grafana, Jaeger, logs, metrics, OpenSearch, Prometheus, Traces

In the Fluent Bit book I touch upon the point that we should be observing the observer. After all, if we don’t monitor our observability stack, then we’ll be operating blind and may never know until things go catastrophically wrong, and we’re getting complaints that production business solutions are down. One of the peer review comments was it would be really good to have a visual representation in the book. While I’d love to incorporate such diagrams, for them to be readable, they do use up a lot of space on the printed page, and very long chapters can also put some readers off. So, given the point wasn’t a key theme, we simply couldn’t incorporate the diagram.

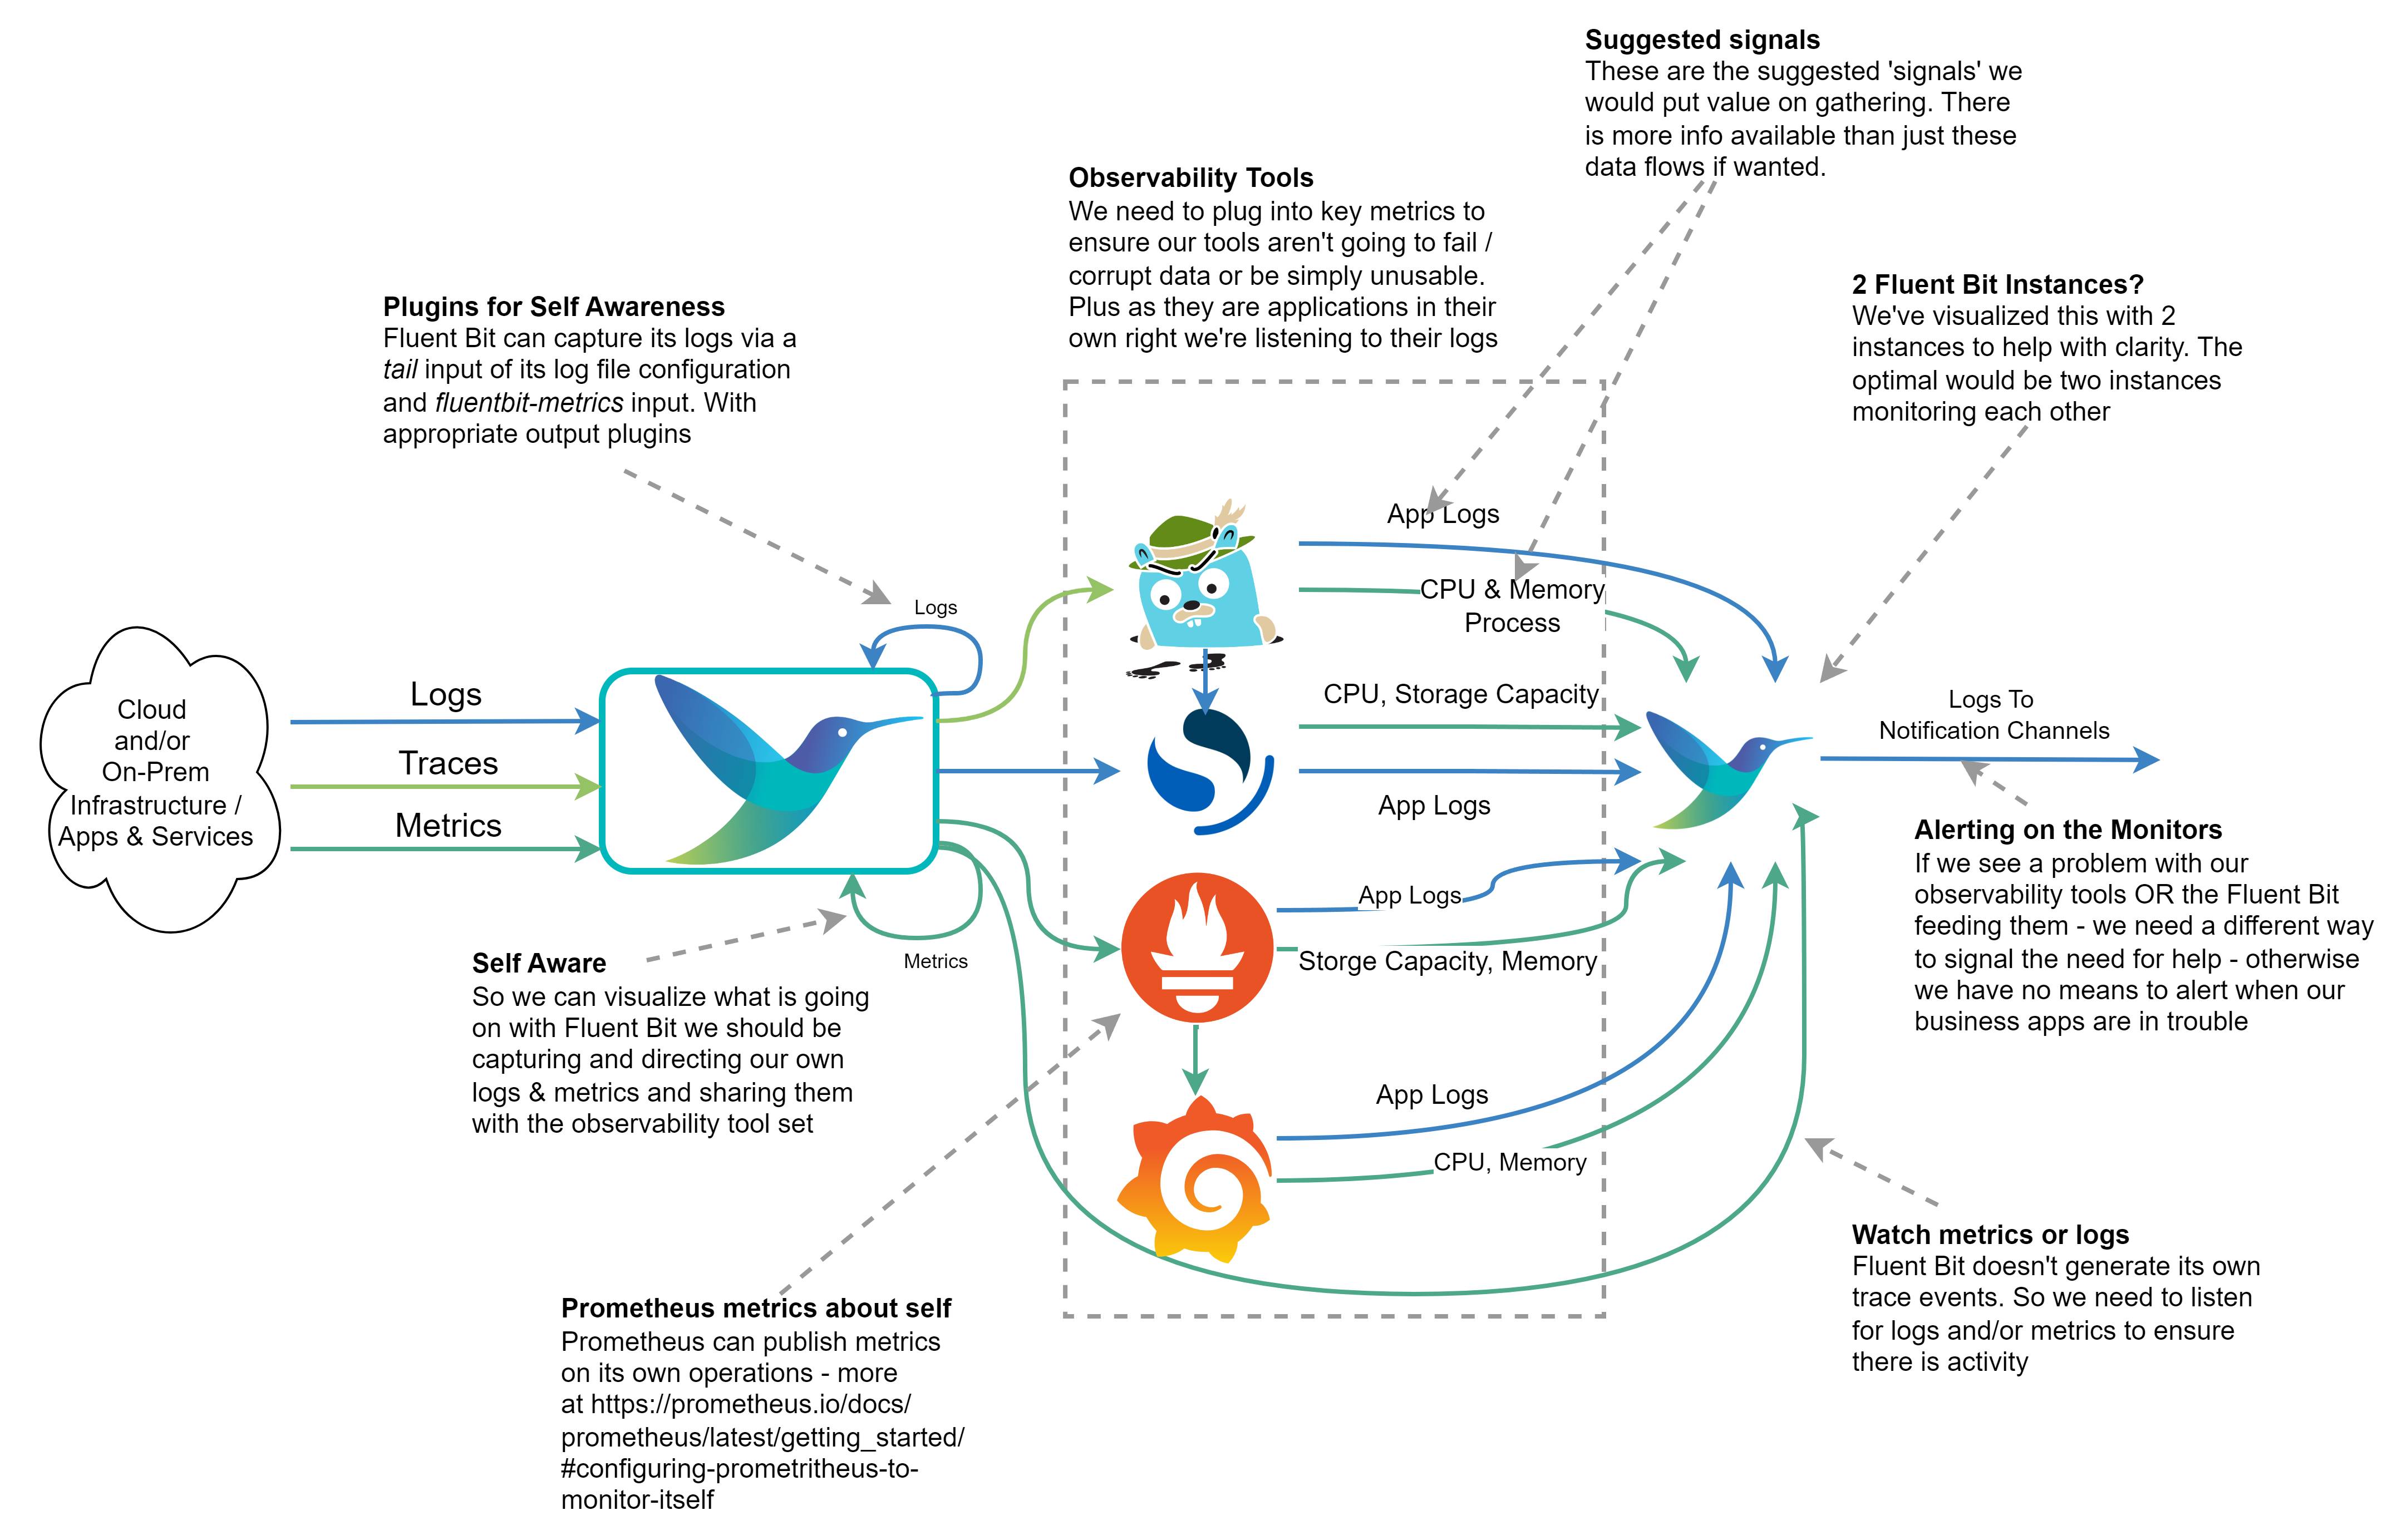
But the suggestion is a good one. So we’ve created the visual representation here.

Annotated diagram showing how Fluent Bit could be used to monitor an open-source observation stack.

The diagram shows how we can monitor our observation tech stack so we don’t become ‘blind’ without knowing about it. The Outflow from the right of the diagram would send a signal to a notification service, which could be as simple as email or as user-friendly as Slack. We’ve indicated which kinds of metrics, logs, and traces could offer the most value from our observation tech stack.

If we’re running everything within a Kubernetes cluster, it would be easy to say we don’t need such a sophisticated setup as we can use Kubernetes liveness probes if the containers are well configured. While it is true if one of our services starts to fail, a liveness check should pick it up and recycle the container. But such probes only worry about the HTTP response code, not the cause. If we don’t monitor and capture more information we’ll never understand the problem. At worst we could end up seeing Kubernetes starting and then killing our containers in a vicious cycle and struggling to resolve the cause. So collecting the logs and metrics remains just as important.

How to Publish Fluent Bit Metrics and Logs

To publish Fluent Bit’s metrics to Prometheus, we need to configure the fluentbit-metrics input plugin (it does sound odd as an input, but there are reasons that become clearer in the book). We then route the output that supports using Fluent Bit as a Prometheus node exporter or makes use of the remote write API.

The log output for Fluent Bit can be configured via the command line or in the SERVICE blog (using the attributes log_file and log_level in the configuration file. Today this is setting the log threshold and identifying the log file. We can then, of course, configure a tail input plugin against the file if we want to send the logs to OpenSearch. We can also set plugin-specific logging thresholds as overrides to the Fluent Bit wide setting in the SERVICE block of configuration.

Configuring the other monitoring tools

  • Grafana‘s configuration will allow it to publish Prometheus scrapable metrics and Traces that are OTLP compliant can be found documented here.
  • Prometheus provides metrics on itself (details here) and logging controls as part of its command line and generates logfmt or JSON logs, details here.
  • OpenSearch‘s logs can be accessed as documented here. The Logs are created with Log4j2, which means out of the box, it will be easy to parse them. Configuring the output of slow query reports does need to be switched on. OpenSearch also illustrates a pre OpenTelemetry/OpenMetrics approach to sharing internal metrics by writing them as logs. However, there are ways to convert such log events to OTLP Metrics with Fluent Bit.
  • Jaeger provides metrics endpoints that are Prometheus-compatible, along with JSON-based logs, and are documented here. There is some support for tracing.

Share this:

  • Share on Facebook (Opens in new window) Facebook
  • Share on X (Opens in new window) X
  • Share on Reddit (Opens in new window) Reddit
  • Share on LinkedIn (Opens in new window) LinkedIn
  • Email a link to a friend (Opens in new window) Email
  • Share on WhatsApp (Opens in new window) WhatsApp
  • Print (Opens in new window) Print
  • Share on Tumblr (Opens in new window) Tumblr
  • Share on Mastodon (Opens in new window) Mastodon
  • Share on Pinterest (Opens in new window) Pinterest
  • Share on Bluesky (Opens in new window) Bluesky
Like Loading...
    • About
      • Internet Profile
      • Music Buying
      • Presenting Activities
    • Books & Publications
      • Logging in Action with Fluentd, Kubernetes and More
      • Logs and Telemetry using Fluent Bit
      • Oracle Integration
      • API & API Platform
        • API Useful Resources
        • Useful Reading Sources
    • Mindmaps Index
    • Monster On Music
      • Music Listening
      • Music Reading
    • Oracle Resources
    • Useful Tech Resources
      • Fluentd & Fluent Bit Additional stuff
        • Logging Frameworks and Fluent Bit and Fluentd connectivity
        • REGEX for BIC and IBAN processing
      • Formatting etc
      • Java and Graal Useful Links
      • Official Sources for Product Logos
      • Python Setup & related tips
      • Recommended Tech Podcasts

    TOGAF 9

    Logs and Telemetry using Fluent Bit


    Logging in Action — Fluentd

    Logging in Action with Fluentd


    Oracle Ace Director Alumni

    Oracle Cloud Integration Book


    API Platform Book


    Oracle Dev Meetup London

    Blog Categories

    • App Ideas
    • Books
    • Enterprise architecture
    • General
      • ExternalWebPublications
      • LinkedIn
      • Website
    • Music
      • Music Resources
      • Music Reviews
    • Photography
    • Podcasts
    • Technology
      • AI
      • APIs & microservices
      • chatbots
      • Cloud
      • Cloud Native
      • Dev Meetup
      • development
        • languages
      • drone
      • Fluent Observability
        • Fluentbit
        • Fluentd
        • OpAMP
      • logsimulator
      • mindmap
      • OMESA
      • Oracle
        • API Platform CS
          • tools
        • ITSO & OEAF
        • OIC – ICS
        • Oracle Cloud Native
        • OUG
      • railroad diagrams
      • TOGAF

    Enter your email address to subscribe to this blog and receive notifications of new posts by email.

    Join 2,616 other subscribers

    RSS

    RSS Feed RSS - Posts

    RSS Feed RSS - Comments

    August 2026
    M T W T F S S
     12
    3456789
    10111213141516
    17181920212223
    24252627282930
    31  
    « Jul    

    Speaker Recognition

    Open Source Summit Speaker

    Twitter

    Tweets by mp3monster

    History

    Flickr Pics

    The real C4 LogoThe real C4 LogoBoxer Rebellion @ Brixton ElectricBoxer Rebellion @ Brixton Electric
    More Photos

    Social

    • View @mp3monster’s profile on Twitter
    • View philwilkins’s profile on LinkedIn
    • View mp3monster’s profile on GitHub
    • View mp3monster’s profile on Flickr
    • View mp3muncher’s profile on WordPress.org
    • View philmp3monster’s profile on Twitch
    Follow Phil (aka MP3Monster)'s Blog on WordPress.com

    Blog at WordPress.com.

    • Subscribe Subscribed
      • Phil (aka MP3Monster)'s Blog
      • Join 229 other subscribers
      • Already have a WordPress.com account? Log in now.
      • Phil (aka MP3Monster)'s Blog
      • Subscribe Subscribed
      • Sign up
      • Log in
      • Report this content
      • View site in Reader
      • Manage subscriptions
      • Collapse this bar
    Loading Comments...

    You must be logged in to post a comment.

    Privacy & Cookies: This site uses cookies. By continuing to use this website, you agree to their use.
    To find out more, including how to control cookies, see here: Our Cookie Policy
    %d