Tags
AI, chatops, development, Fluent Bit, IncidentFox, innovation, LLM, OpAMP, OTel, runbooks, SRE
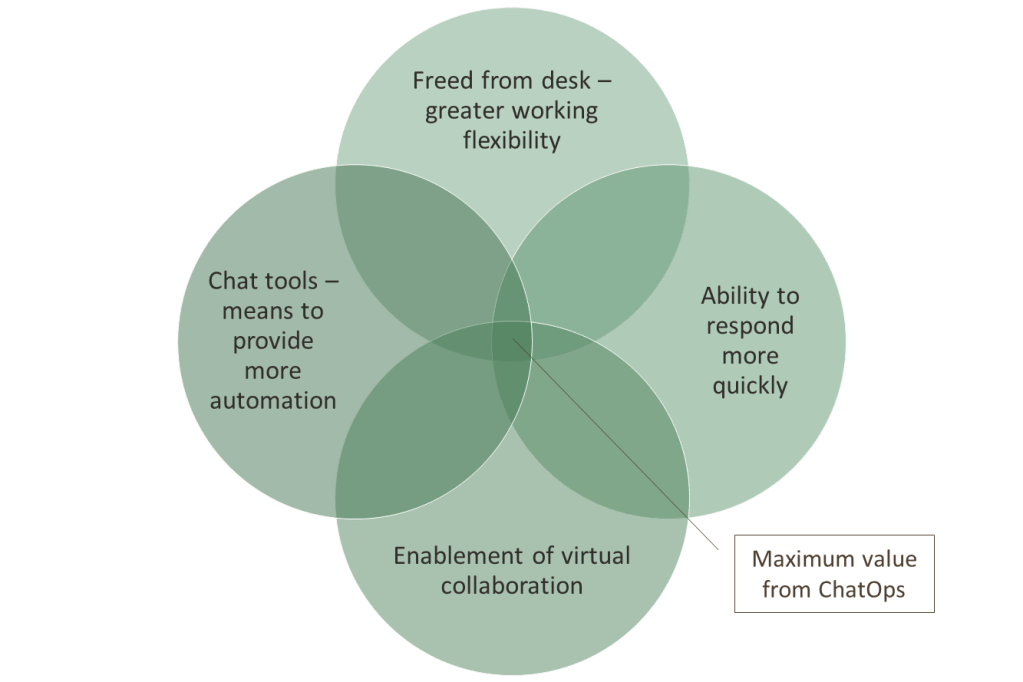
A couple of years ago, we wrote about the idea of Chat Ops, why the idea is valuable and interesting (see Fluent Bit – Powering Chat Ops, Fluent Bit with Chat Ops, for example). The essence of the idea was:
- Using a collaboration or chat platform like Slack could ease and even accelerate the response to operational issues (as systems process more data and faster).
- Conversational collaborative platforms are pervasive, usable across many devices, while still being able to enforce security. Taking away the need to log in to laptops, signing in to portals before you can even start considering what the problem is.
- The quicker we can understand and resolve things, the better, and the less potential damage that may need to be addressed. Using collaboration platforms does this through collaborative work, and the fact that we can see content quickly and easily because of the push model of tools like Slack.
- Any Observability agent tool that can detect issues as data is moved to a backend aggregation and analytics tool gives you a head start. This is something Fluent Bit can do easily.
We illustrated it this way:
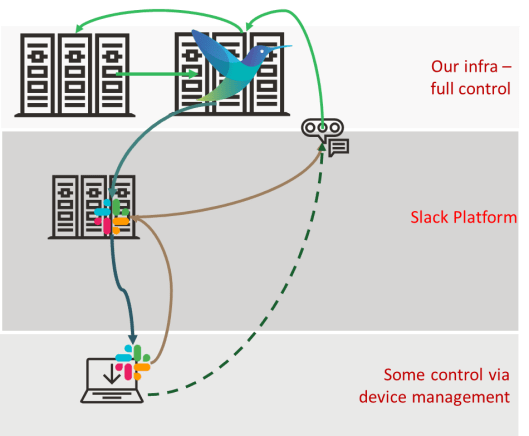
The ChatOps deployment looked like:
How do we advance this?
The demo was very light-touch to illustrate an idea, but we’ve since heard people pursuing the concept. So the question becomes: what has happened in the observability space that could make it easier to industrialize (e.g., scale, resilience, security, manageability)? One of the key advances being driven by the OpenTelemetry working groups within the CNCF is OpAMP. OpAMP provides a protocol for standardizing the management and control of agents and collectors such as Fluent Bit. I won’t go into the details of OpAMP here, as we covered that in a separate blog (here). But what it means is that we can either tap into the OpAMP protocol more directly as it provides a means to deliver custom commands to agents, or better still simplify by extending the management service so that we can talk to that, and it is responsible to sending on the command to the relevant agents and talk back to us if its knowledge about agent capabilities tells us its not possible.
This improves security (our bot only needs to talk to a single point in our infrastructure). Our agents, like Fluent Bit, can have a trust relationship with a central point. Effectively, we have introduced a better multifaceted trust layer into the answer. Not only that, as the OpAMP server has visibility into more of the agent deployment, we can also leverage its information and ask it to deploy our custom Fluent Bit configurations that help us observe and execute remediation processes.
Let’s look deeper
While industrialization is good, it occurs to me that there is more to collaboration and conversational (or chat) interfaces than we first envisaged.
Collaboration, to a large extent, is not about bringing multiple ideas to the table and choosing the best one; it is actually about knowledge mining. Our ideas and insights are built from individual knowledge banks, or as we might put it, experience. Conversational interfaces also allow us to see what has gone before (in effect, harvesting information to improve our knowledge). So perhaps we should be asking, within the context of a platform that allows us to easily access, share, and interpret knowledge for a specific context (i.e., our current problem), what can we do?
Knowledge is unstructured or semistructured information, and information is a semistructured composition of context and data. So how do we find and leverage information if not knowledge, particularly at 2am when we’re the only person on call? The answer is to facilitate enhanced information retrieval, which could be more Slack bots that we can use to provide structured commands to retrieve relevant data from our metrics tooling, traces, etc. Organizations that follow more ITIL-guided processes will most likely have runbooks, a knowledge base with error-code information, and previous incident logs documenting resolutions. All of which can bring together a wealth of information. Doing this in a collaborative conversational tool like Slack and MS Teams will save time and effort, as you will not have to sign in to different portals to track down the details.
But we can go better, with the rise of LLMs (large language models, Gen AI if you prefer), combined with techniques such as RAG (Retrieval Augmented Generation), MCP (Model Context Protocol), and further accelerate things as we no longer have to make our Slack bot requests use what structured commands. We use natural language, we can easily paste parts of the information we’re given as part of the request – all of which means that while a single LLM may take longer to execute a single request, it is more likely to surface the details faster because we’re not having to worry about getting the notation for the bot request correct, we’re not going to have to repeat requests to narrow data immediately. With agentic techniques, you can have the LLM pull data from multiple systems in a single go.
All of which is very achievable; many vendors (and open-source teams) have been seeking a competitive edge and exposing their APIs through MCP tools. There is the possibility that some of this is ‘AI washing’, but the frameworks to support MCP development are well progressed, so you can always refine or create your own MCP server. Here are just a few examples:
- Prometheus
- Loki
- Grafana
- OpenTelemetry extension OpenLLMetry
- OTEL Collector
- OpenSearch
In addition to these, which align with widely used open-source solutions, there are MCP servers for vendor-specific offerings, such as Honeycomb and Chronosphere.
The use of MCP raises an interesting possibility – as it becomes very possible to have a universal MCP client, which can be easily interfaced into any conversational tool – after all, we just need to send the text that is addressed to the client, i.e., the adaptor to Slack, MS Teams, etc. is pretty simple. This means we can start to consider things like the same tooling, supporting tools like Claude Desktop, and its mobile equivalent.
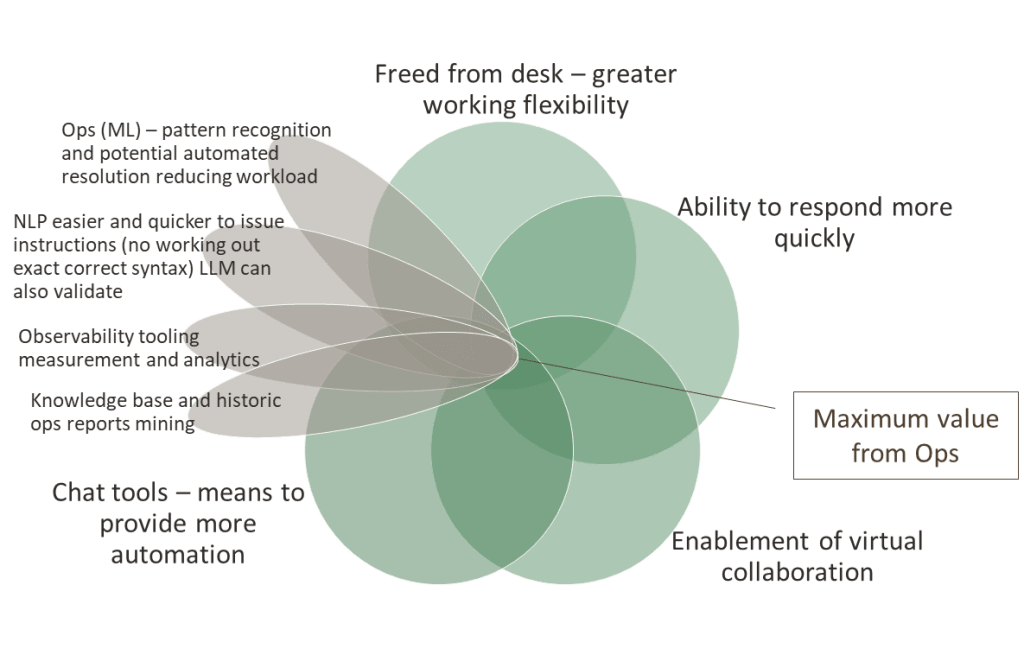
If we bring AI into the equation, consider ML and small models as well, we can start looking at exploiting pattern recognition in the occurrences of issues. This would mean the value diagram becomes more like:
We should also keep in mind the development of the new OpAMP spec from the CNCF OpenTelemetry project that provides a mechanism to centrally track and interact with all our agents, such as Fluent Bit (not to mention Fluentd, OTel Collectors, and others).
Bringing all of this together isn’t a small task, and what of these ideas already exist? Are there building blocks we can lean on to show that the ideas expressed here are achievable? This brought us to IncidentFox.ai (GitHub link – IncidentFox). IncidentFox already exploits MCP servers from several products, such as Grafana, and supports a knowledge base geared towards intelligent searching that can also tap into common sources of operational knowledge, such as Confluence.
But IncidentFox has taken the use of LLMs further with its agentic approach, recommending actions, and once it has access to source code, LLMs can be used to start looking for root causes. To do this, IncidentFox has harnessed the improvements in Gen AI reasoning and the selection and use of the MCP-enabled tools we mentioned, which enable the extraction of data and information from mainstream observability tools.
IncidentFox isn’t the only organization heading in this direction (Resolve.ai, Randoli, and Kloudfuse are building AI SRE tools, but with a fully proprietary business model), but it is supporting an open-source core. All of these solutions come under the banner of AI SRE. Interestingly, a new LLM benchmark has emerged called SRESkillsBench, in addition to the models such as Bird and Spider, which specifically evaluate LLMs against SRE tasks. This kind of information certainly is going to create some interesting debates – do you use the best LLM for specific tasks, or the LLM the vendor has worked with and optimized their prompting to get the best from it?
A lot of these tools focus on detection and diagnostics, and steer you to the relevant runbooks, there seems to be less said about how runbooks can be translated into remediation actions that can be executed. The ability to translate runbooks into executable steps will require either tooling via MCP or custom models with suitable embedded functions. Whichever approach is adopted, having a well-understood control plane, such as Kubernetes, will make it easier. But not everything is native K8s. Lots of organizations still use just virtualization, or even bare metal. We also see this with cloud vendors that offer bare-metal services due to the need for maximum compute horsepower. To address these scenarios from a centralized control, either needs to allow remote access (ssh tunnels) to all the nodes, or a means to work with a distributed tooling mechanism, which is what we had with our original chatops idea and the possibilities offered through OpAMP.
Of course, introducing LLMs opens up another set of challenges in the observability space, which OpenLLMetry (driven by TraceLoop) and LangFuse are working to address. But that’s for another blog.
What does this mean to our ChatOps proof of concept?
Sticking with an open-source/standards-based approach means there is a clear direction of enabling AI Agents to be part of the OTLP (Open Telemetry Protocol) pipeline and leverage the MCP tooling of backend observability platforms. IncidentFox doesn’t yet provide an inline OTLP capability (although some of the proprietary options have gone this way), but that is less of a concern, as Fluent Bit provides a lot of capability to help identify issues (such as timeseries/frequency measurement, error identification, etc.), which can be combined with IncidentFox’ means to instruct it to initiate an incident. We could do this with direct API calls, but what would be more interesting and flexible is that, when our Fluent Bit process notifies the Ops team in Slack of an issue, it also ensures that the IncidentFox Slack agent picks up the message, allowing it to start its own analysis. In effect, a collaboration platform can be as impactful as an integration platform.
Furthermore, now that we have early warning of an issue via Fluent Bit, we can interact with IncidentFox through its tooling to start interrogating the diverse range of tools well before the new problem’s details have been fully ingested into the backend tooling and been detected as an issue. So we can now get a jump start by prompting IncidentFox, which can mine for information and recommendations. This is where, at 2am, we can still work collaboratively, albeit with a collaborator that is not another person but an LLM.
As I’ve mentioned, the challenge is making the runbook executable in environments that don’t provide a strong control plane, such as K8s. Here, we can further develop our ChatOps concept. By providing a set of MCP tools for Fluent Bit (IncidentFox supports providing your own tools), the runbook can describe remediation steps, and the use of the LLM ensures the Fluent Bit tool is invoked appropriately.
This would still mean that the central point of Incident Fox would need to talk with each Fluent Bit deployment, better than just opening up SSH directly. But we could be smarter. OpAMP provides a central coordination point, and through its Supervisor or embedded logic in an observability client, the protocol’s support for custom commands could be exploited. So we expose the way we interact with Fluent Bit via the custom command mechanism, and we have a robust, controlled mechanism. Furthermore, the concept could be extended to exploit the aggregated knowledge of agents and their configuration (or pushing out new configurations to solve operational problems as OpAMP has been designed to enable), we can automate the determination of whether the remediation action needs to be executed across operational nodes.
Let’s walk through a hypothetical (but plausible) scenario. We have manually deployed systems across a load-balanced set of servers in a pre-production environment used for load testing, each with TLS certificates. As it is a pre-production environment, we use self-signed certificates. We are starting to see errors because the certificates have expired, and someone forgot to recycle them. Fluent Bit has been forwarding the various error log messages to Loki, but the high frequency of the errors causes it to send details to Slack for the Ops team. This, in turn, nudges IncidentFox to act, determines the root issue, and finds remediation in a runbook that points to running a script on the host to provide a fresh self-signed certificate. As we have a Fluent Bit ops pipeline that can trigger that script, and it is deemed low risk, we allow IncidentFox to execute the runbook unsupervised. To execute the run book, it uses the OpAMP server to send the custom command to Fluent Bit. But the runbook says other nodes should be checked. As a result, IncidentFox works with the OpAMP server via its MCP tooling to identify which other Fluent Bit deployments are monitoring other nodes and to direct the custom command to those nodes as well.
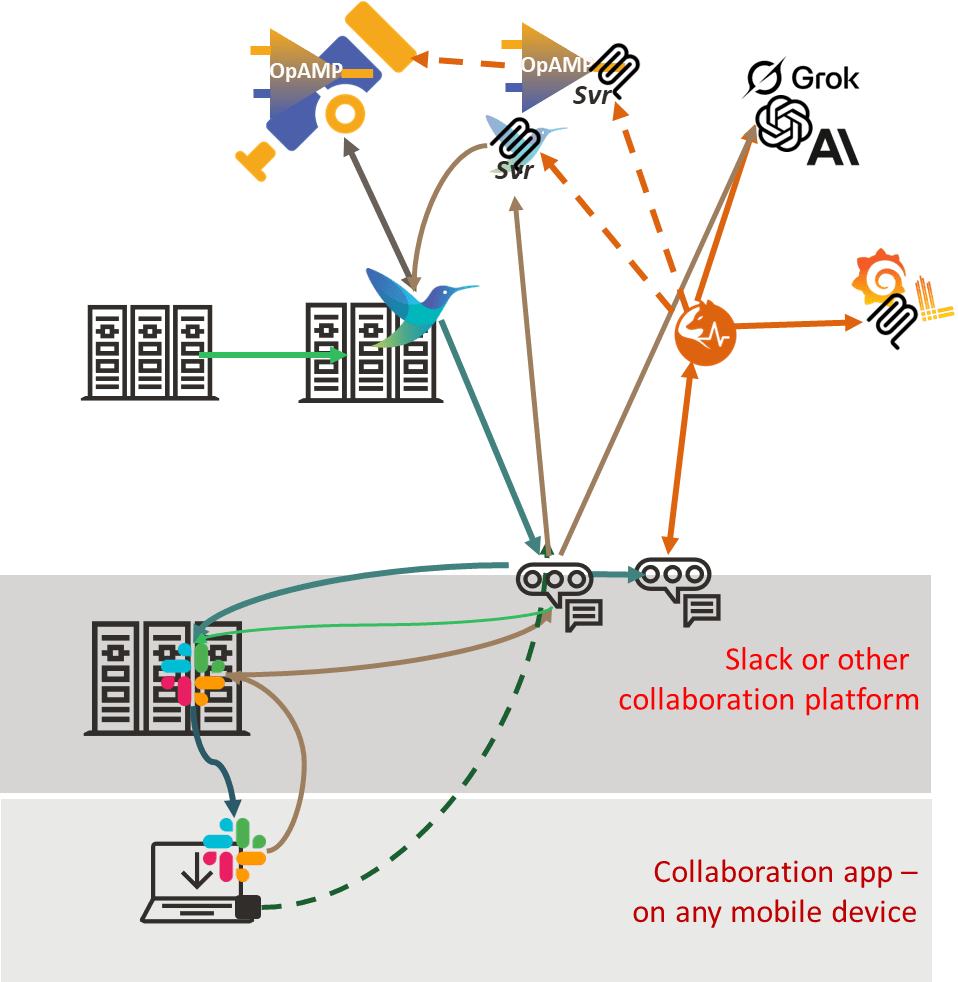
To achieve this, we need an architecture along the following lines, in addition to IncidentFox and the associated MCP tools, we would need to have the OpAMP server, either the OpAMP client embeddable into Fluent Bit or an OpAMP supervisor that understands how to pass custom commands, something it perhaps could do by using another MCP interface to Fluent Bit directly.
Conclusion
As you can see, there has been significant advancement in how LLMs and MCP tooling can be used to enable operational support activities. To turn this into a reality, the core Fluent Bit committers need to ideally press on with supporting OpAMP. A standardized MCP tooling arrangement for an open-source OpAMP server will also make a significant advancement. Although we could get things working directly with MCP using Fluent Bit.
IncidentFox being able to function as an OpAMP server itself would really enable it shift the narrative, particularly if it provided a means to plug into a supervisor to handle custom actions.
Root cause analysis – understanding deployment changes
Looking at all of this, one dimension of operational issues is the ability to correlate an issue with environmental changes. That means understanding not only software versions, but also the live configuration. Again, not too difficult when your control plane is K8s. But trickier outside of that ecosystem. You need to identify when the change was defined and when it was applied. Is it time for some functionality that understands when details such as file stamps for configurations or certain binary files change? Perhaps a proxy service that can spot API calls to configuration endpoints and file system changes to configuration files? Then have that information logged centrally so that problems can be correlated to a system configuration or deployment problem.
Updates
Since writing this, we came across Mezmo, which, like Resolve.ai, is developing a proprietary solution but is looking to make an open-source offering. As part of that journey, they have sponsored an O’Reilly Report on Context Engineering for Observability.


You must be logged in to post a comment.