So we’ve been busy working on our OpAMP solution. We’ve made a number of enhancements since we labelled the code v0.4 back in April. For this post, we’ll look at the features added and where we’re looking next.
There has been a lot of feature development, particularly in support of working with Fluent Bit (and to a degree Fluentd).
Standalone or OpAMP server plugin for editor
We started building the Configuration Editor as a standalone capability. The thinking was that we would refactor it into the OpAMP server once we were happy with the functionality and had progressed far enough. But, as we saw this come together, it occurred to me that both deployments are good, as part of the OpAMP server, seeing the configuration being used is handy, but having a freestanding editor (without worrying about the connectivity to communicate with agents) is also a real use case.
So we have created the setup, where if the OpAMP is told to look for the Editor via the definition of Python endpoints in the configuration and it is deployed, it will be incorporated into the server. If the editor isn’t provided (deployed, or not identified in the configuration it isn’t offered in the navigation.
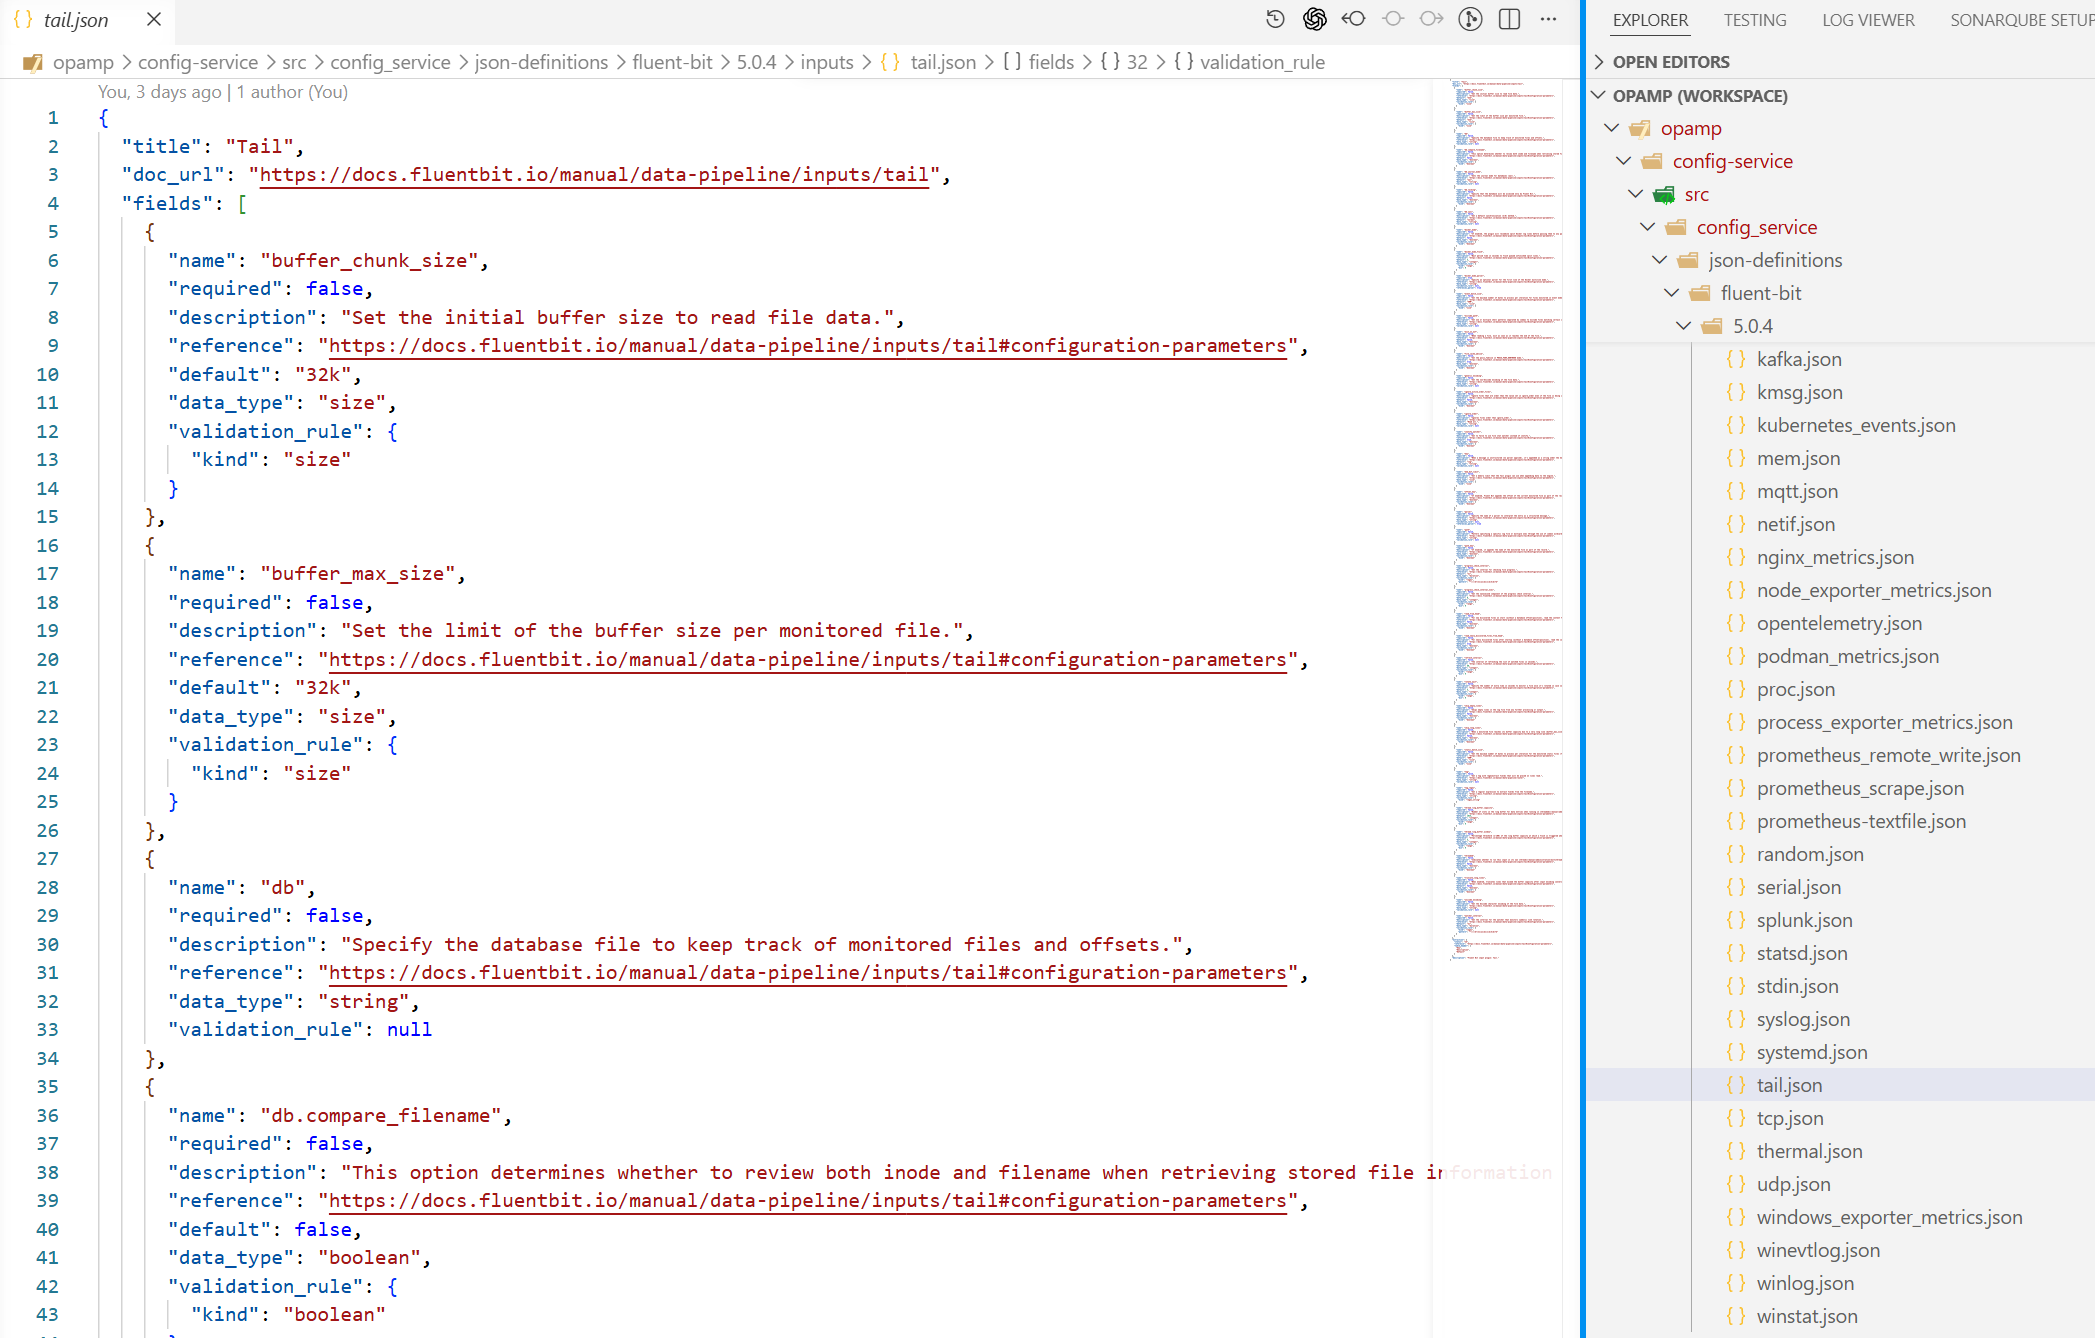
The editor is completely configuration-driven through JSON, so it only requires extending the JSON to support custom plugins or to enhance the validation rules (e.g., adding a REGEX to how a particular parameter is set). This far outweighs the current Dry run checks.
The configuration is considerable, so we refactored the structure to make it far easier to work with, and created some code that can mine Fluent Bit’s GitHub to generate an initial clean set of JSON docs. Of course these need an eyeballing to ensure they’re correct.
Catalog viewer
The catalogue viewer is a natural extension of the editor and leverages the way we tag configuration files with version details in the editor. The catalogue viewer has a configuration which tells it where to look for candidate files. These are then listed with the metadata.
The catalogue viewer presents all the identified files, which, when selected, if it knows about the config editor, will open the editor with the file. Otherwise, it opens a simple view of the file.
The catalogue viewer works in the same way as the editor in terms of authentication.
CLI
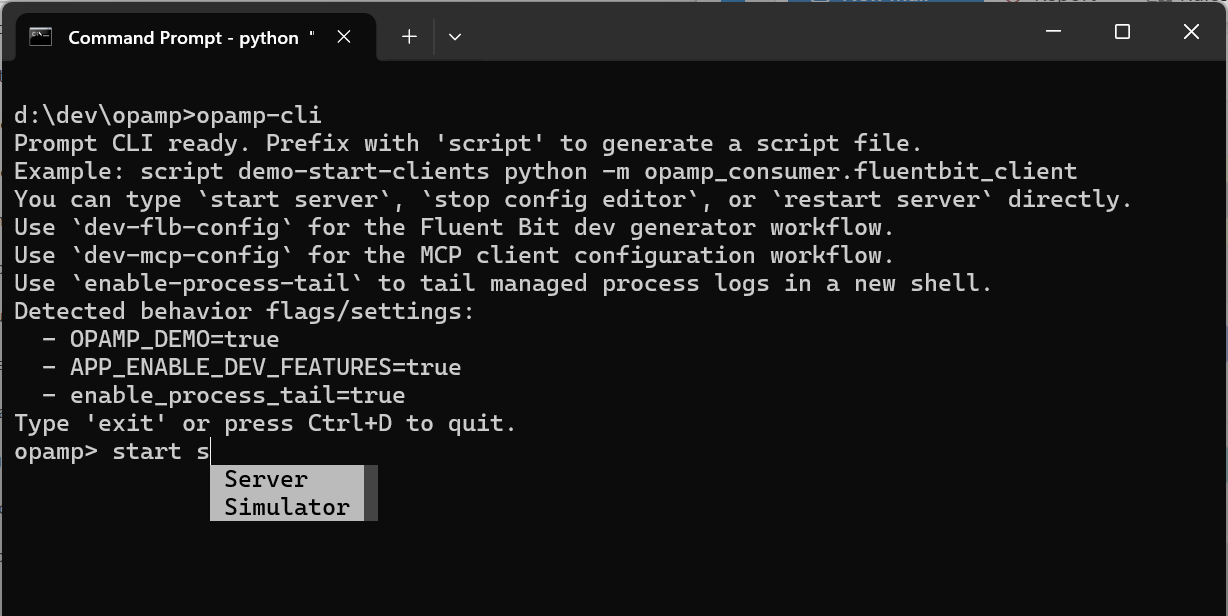
A Command Line tool maybe and odd choice of feature, but we found ourselves creating more and more scripts to support Windows and Bash shells with commonality. So we elected to leverage some frameworks to help reduce the ongoing effort required to maintain them. The utility can be used to generate the command, if you wanted embed the process of starting or stopping a process into the host OS.
Agent as Supervisor or observer
The OpAMP documentation suggests that the agent logic is embedded, or wrapped with a supervisor, with the inference that the agent forks the application process. This means that introducing the OpAMP would be invasive. There is a noninvasive variant of the Supervisor that we’ve called Observer. Here, the agent know how to identify the key process by examining the host’s processes. Then tasks such as restarting require an understanding of how to get the OS to trigger, for example, if the service is known to init.d in Linux, we can use the service command.
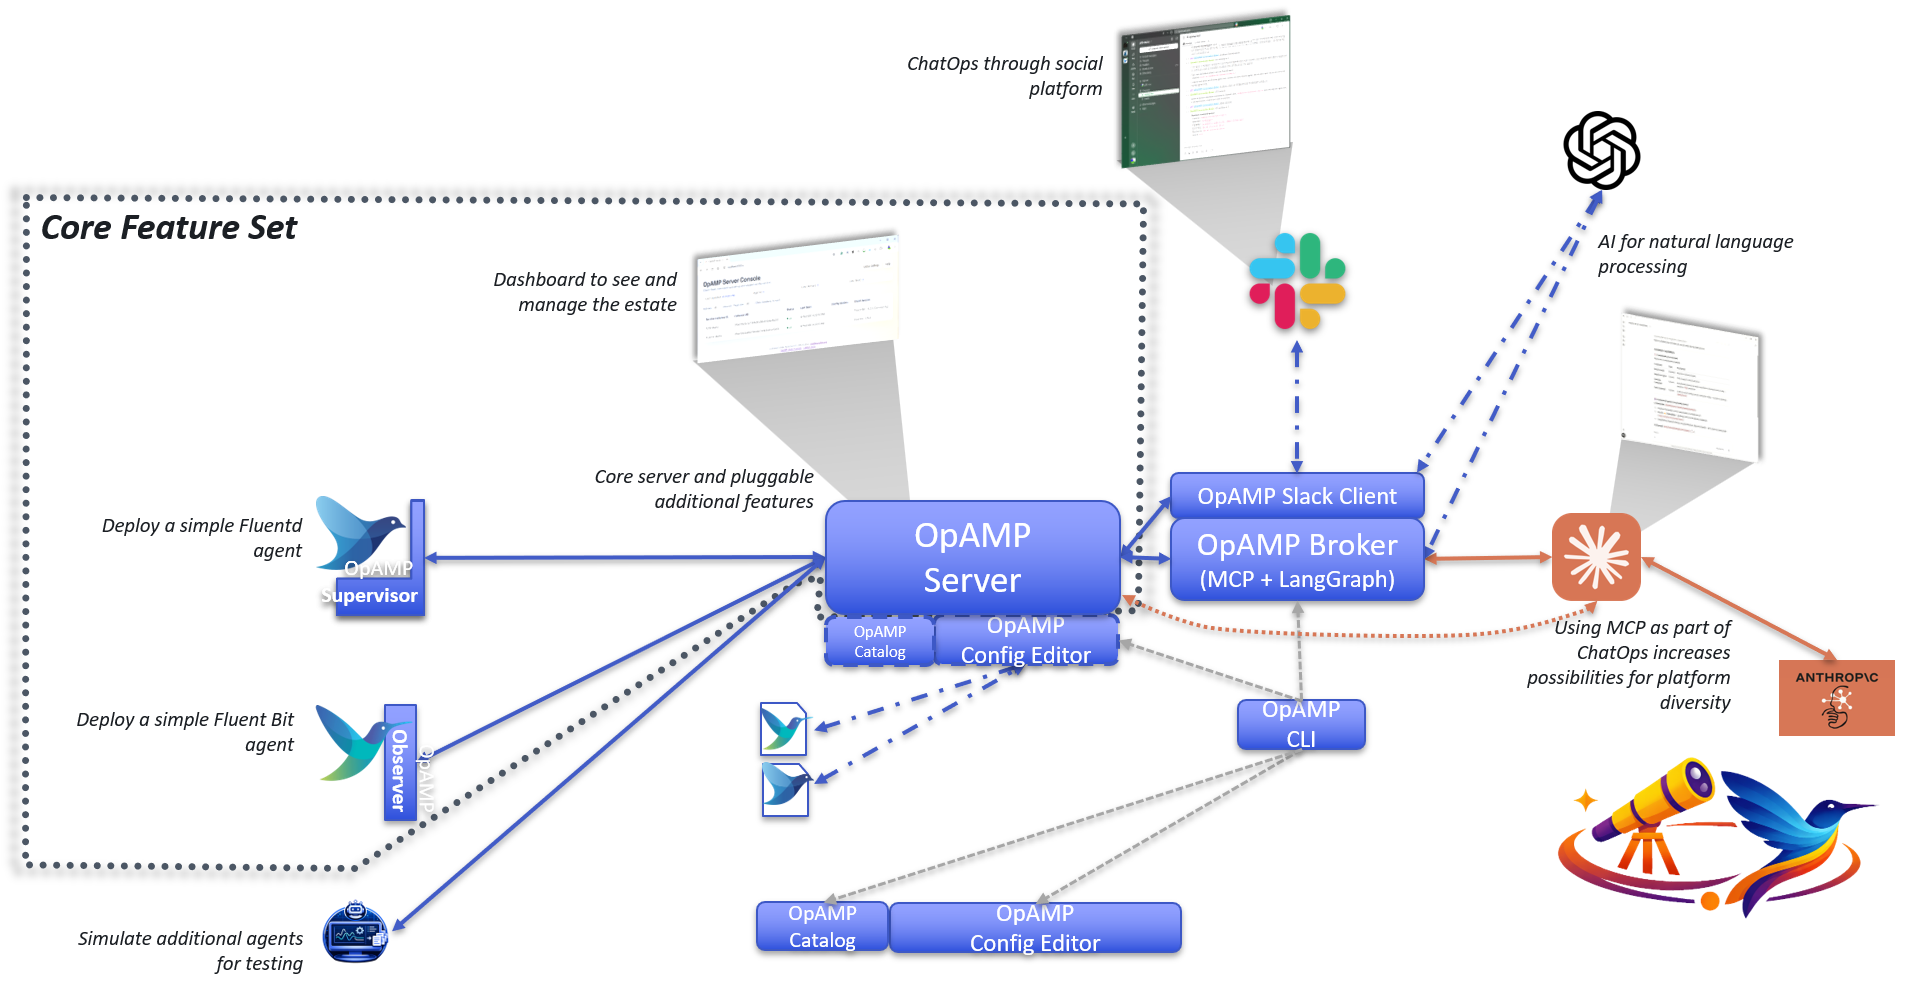
Architecture view
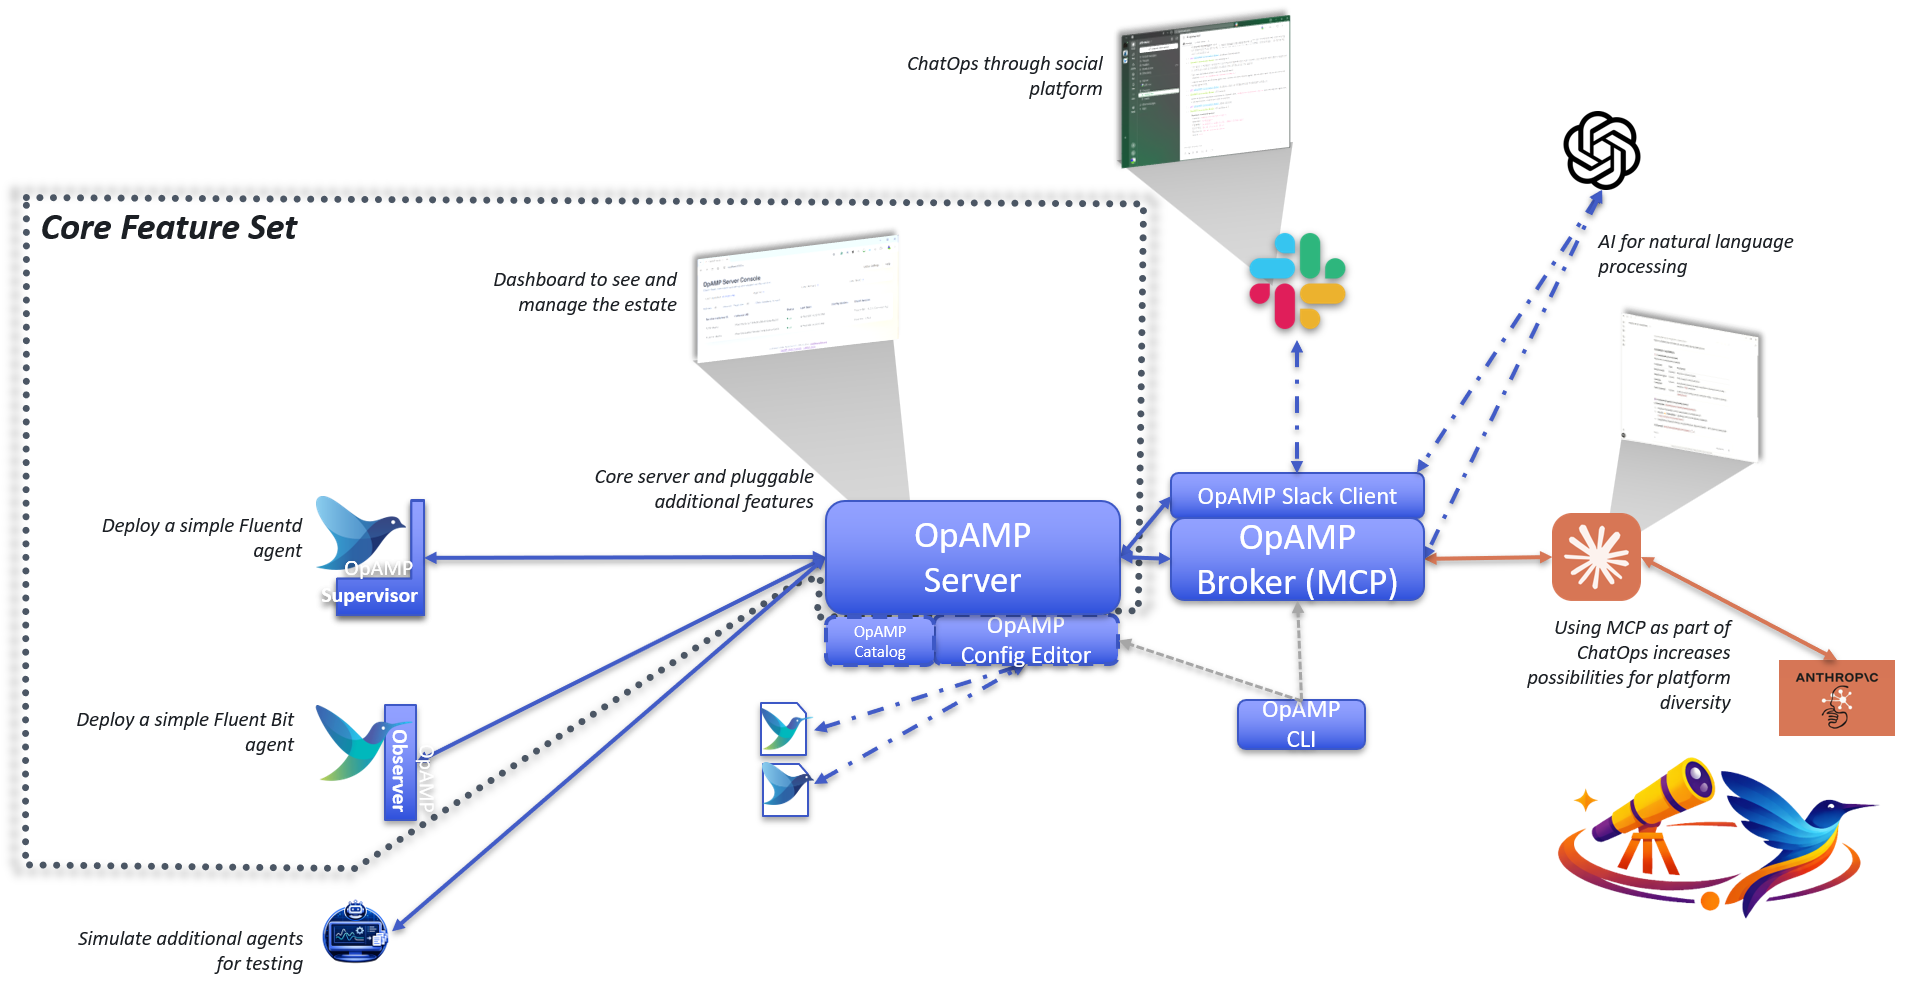
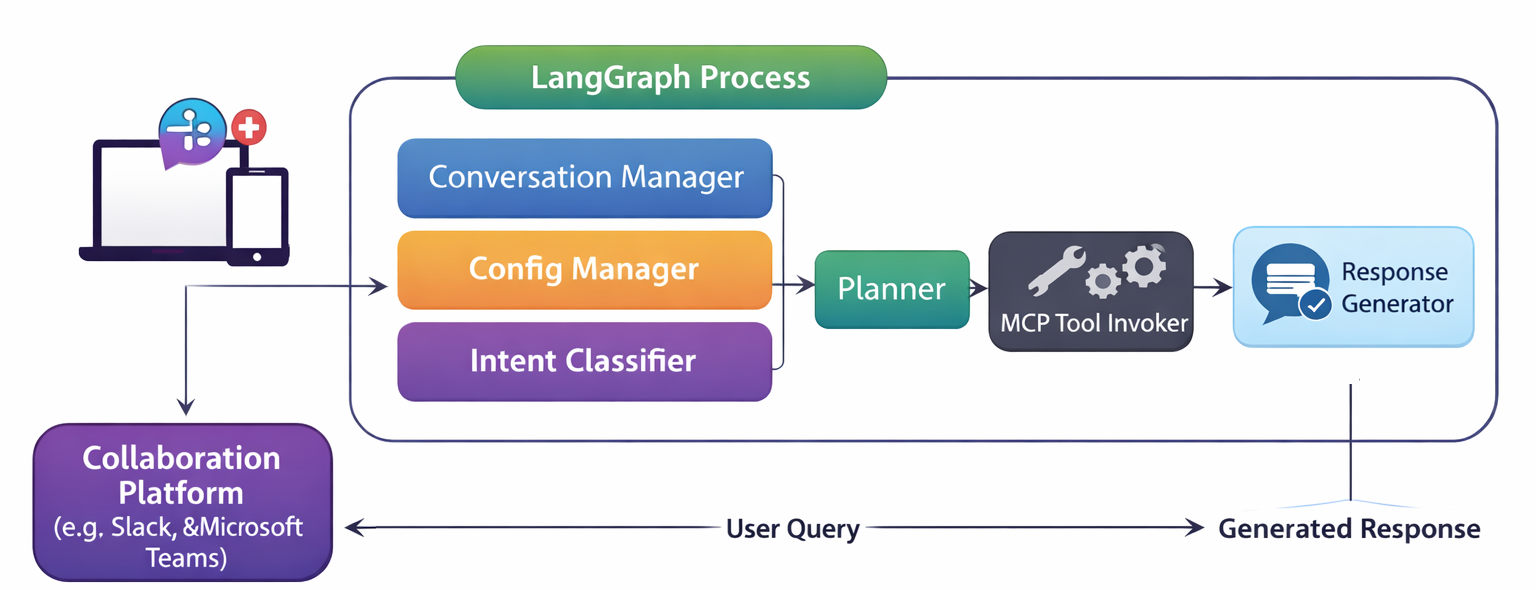
MCP and Slack for ChatOps
We’ve got the Slack foundations progressed, so we can use natural language VIA langgraph to then work with MCP, which exposes a subset of API capabilities. We’ve developed both the main server and the Broker to support the MCP endpoints, with the Broker acting as a proxy to the regular Server APIs. This means if we want the MCP to be usable from outside our network, then we can separate the Broker and Agent into separate networks so that the wider set of endpoints the server provides aren’t exposed.
But if you don’t want that the MCP endpoint can be switched on.
What next …
Config deployment
We have started to address the foundations of managing configuration deployment (for example, if our Catalogue Service is used with the Server, it can be used to select the configuration files to deploy.
Part of config deployment is understanding what is deployed, so we have developed some strategies for versioning Fluent Bit and Fluentd, and I think it will translate to other configuration files (at least into the Observability space).
What we haven’t done is fully implement the process. So we’ll focus on that
E2E Testing
There is a lot of functionality here now, including tests with Playwright, but we really need to extend it to provide end-to-end tests in a clean environment that is set up from the various pip and wheel files.
Deployment Artefact access
We also want to start making these artefacts easier to retrieve, such as pulling the Wheel or PIP files from GitHub or PyPi.
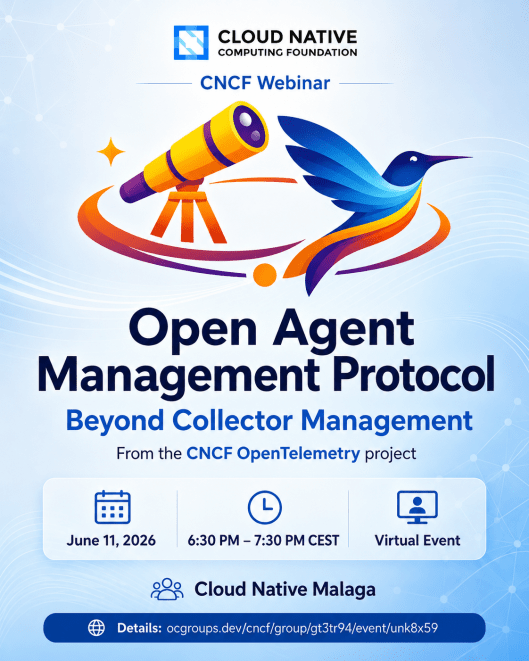
A short post, I’m excited to share that I will be presenting a Webinar for the CNCF Malaga meetup on the 11th June 6.30pm CEST where I’ll be talking about OpAMP – registration link.
I hope you can join me to hear about the value of the OpAMP protocol, which originated from the CNCF OpenTelemetry project. I’ll be talking about what the protocol can do for us, how it works, and while it has origins within the OpenTelemetry project, it has far-reaching value for almost any deployment context.
This isn’t all theory, I’ll be demoing the functionality we’ve built that leverages the OpAMP spec. While the focus will be on Fluent Bit, it will convey the value of the protocol. We’ll also look at how it can scale in both volume and the range of client applications it can support.
Fluent Bit’s documentation is spread across many static web pages; in some cases, attributes allowed for a plugin are documented across several pages. There is absolutely nothing wrong with this. Having written a book on Fluent Bit, I can say it makes sense, and if the standard docs went into further detail, it would increase the spread of content.
The problem is, once you’ve got a grip on Fluent Bit, you want a quick reference just to check the attribute names or confirm that an attribute does what you expect.
Each quick reference page has a section at the top that provides a comma-separated list of all the plugins for the different operations, inputs, outputs, etc., with anchor links to that section. Each plugin has a table that lists all configuration attributes, including those inherited from the Fluent Bit kernel and those introduced by extending another plugin.
Why and how …
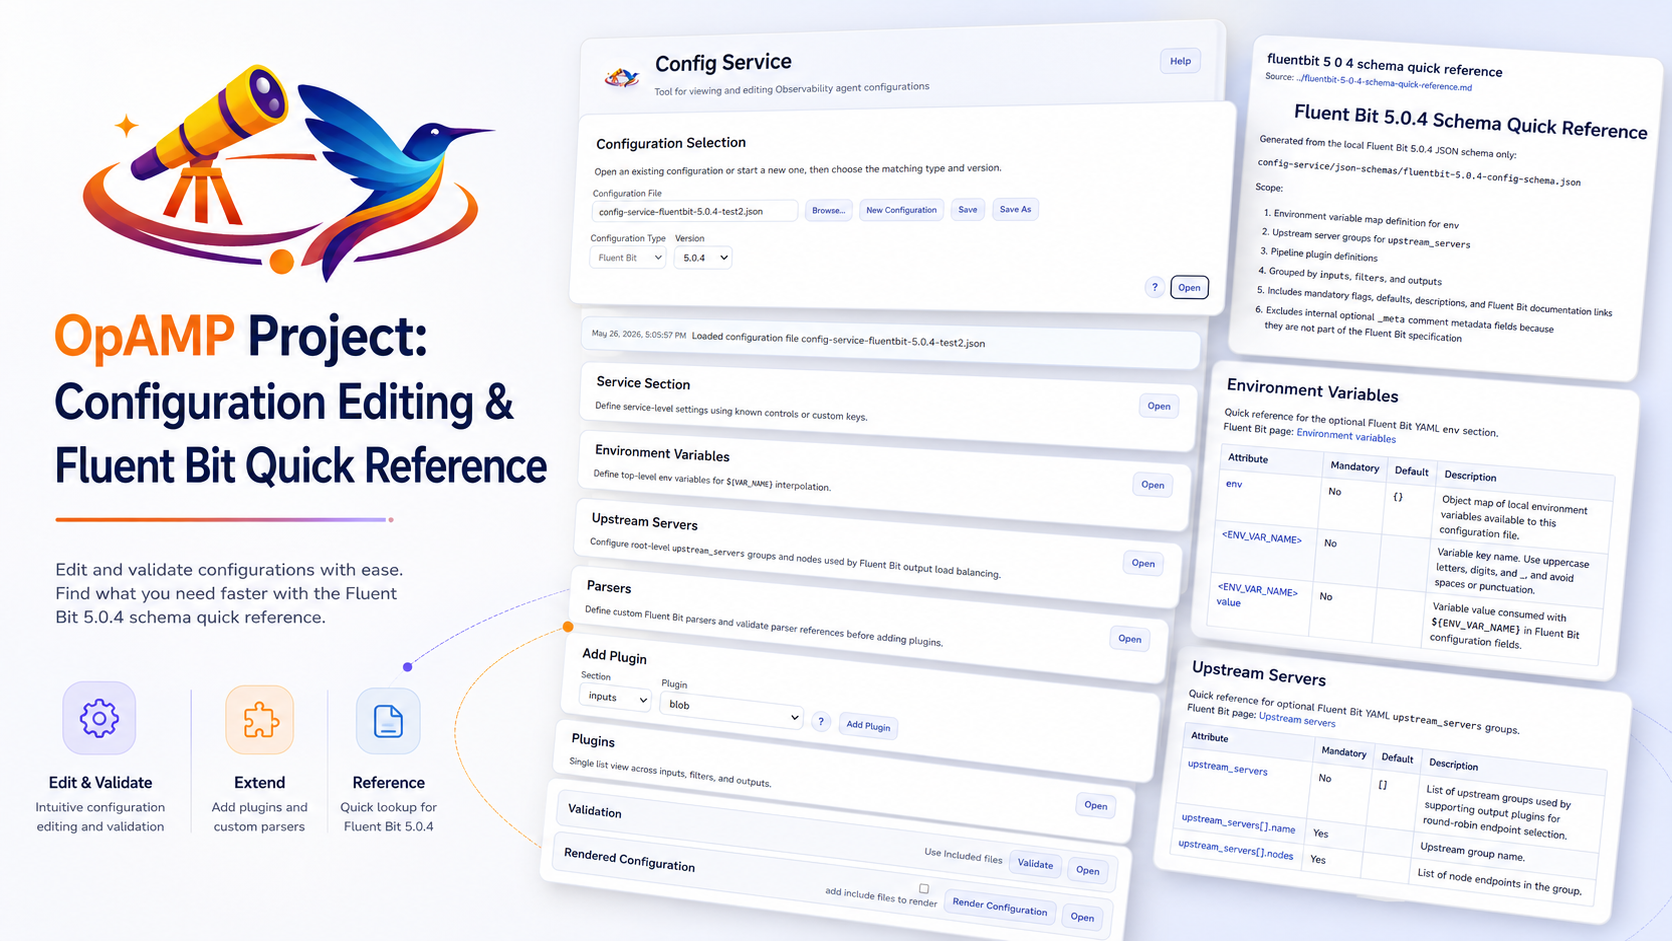
The “why” may prove even more appealing. As part of our OpAMP project, we wanted to make it easy to edit and validate Fluent Bit and Fluentd configurations before deployment using the OpAMP tooling. That tool became the config-service part of the OpAMP repo, and can be independently deployed as well as function as part of the main OpAMP service. As a result, the UI offers the same authentication and authorisation options, ranging from running without authentication to using OAuth.
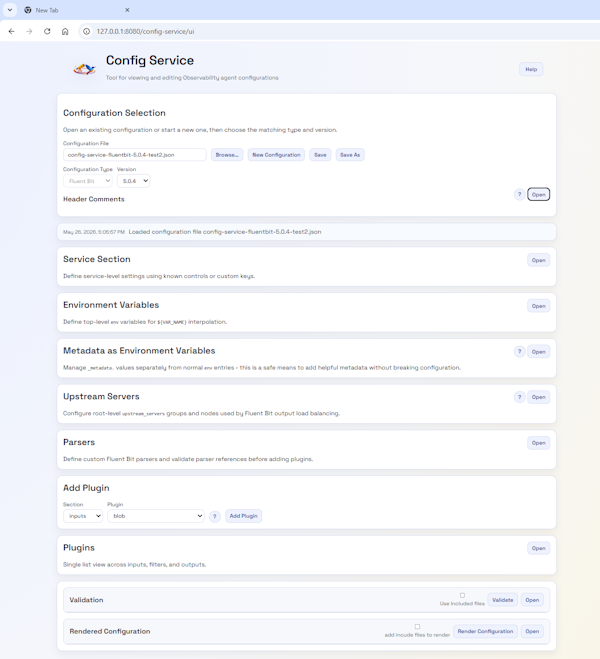
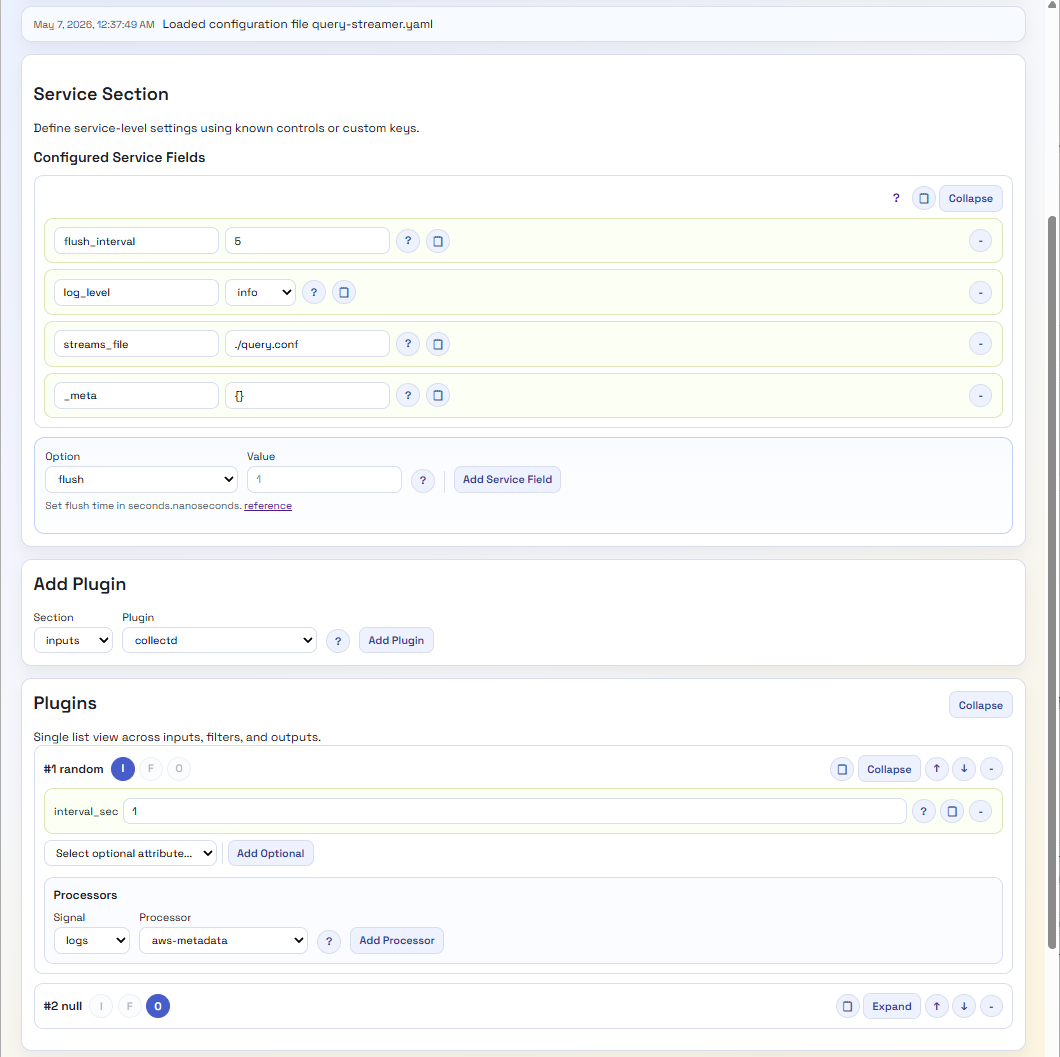
All the different editable components collapsedPlugins part of the editor
The key to both the UI and documentation is the use of JSON Schemas, as they contain all the information needed to create documentation just as easily as they power the UI. We have therefore generated a markdown page using a Python script. This means the docs are easy to check (compared to an HTML file) and can be rendered within GitHub. We could extend the script to generate HTML. But rather than trying to remember to keep both document types in sync (and double-check formatting), we found a JavaScript tool (marked.js) that performs an on-the-fly transformation that, as long as we stay within the core Markdown syntax, won’t cause any issues. We’ve then enriched that output a bit by applying stylesheets.
To come…
At the moment, we have only covered a subset of Fluent Bit versions, so we will, in due course, expand to cover more versions. Today, this is just the last version from each major release. We haven’t done every version to date as it does take a lot of effort to go through the documentation to generate and check the schema, and we’re still refining things as we enhance the UI.
We are also looking to do the same for Fluentd, though this is much trickier, as the portfolio of plugins that make up the core is smaller than those incorporated into the core of Fluent Bit, and the leveraging of Ruby’s dynamic behaviour makes it very easy for people to offer plugins separately. Then, of course, there is the task of collating all that information.
I’ve written a bit about AI in the development process; this has been driven largely by my own experiences, colleagues’ experiences, and blog content from people I trust. So I thought it would be worthwhile to validate my perspectives against those who are more in the know on the subject. So here is my review of the book Vibe Engineering by Tomasz Lelek and Artur Skowroński.
The book opens with a very clear differentiation between vibe coding and vibe engineering (which approximates to what I’ve previously called AI-assisted development). Not only are the key conceptual differences outlined, but the consequences of vibe coding into production are also really driven home …
teams that skip the transition from prototype to engineered artifact consistently report higher defect density, longer incident resolution, and faster architectural decay
The book also shares some real horror stories of blindly trusting LLMs, particularly in operational contexts.
The crucial challenges of vibe coding beyond ideation, PoC, and possibly MVP are brilliantly distilled. Code will do something, but is it right? Is it safe? Will it scale? Can we maintain it?
Tomasz and Artur outline a form of debt called trust debt. Where we have trusted the LLM, and it accumulates issues, particularly with NFRs that are not managed and paid down, it will seriously bite, just as tech debt does. The difference is that tech debt is more readily appreciated and generally easier to understand.
debt is a direct byproduct of the dump-and-review culture. This approach uses AI to generate a large slab of code, opens a pull request, and implicitly offloads responsibility for verification to the reviewer. It’s classic diffusion of responsibility: the presence of the AI (“the model wrote it”) and a reviewer (“someone will check it”) dilutes the author’s ownership of quality
Current approaches to this kind of development can very easily lead to the issues that Human-Machine Interface researchers talk about as automation complacency and the out-of-the-loop problem
The book also highlights interesting parallels, such as those in autonomous vehicle accidents. The consequences may not be as spectacular or as tragic (today), but they can be just as harmful, given that code affects every little aspect of our lives and the decisions we make. It is only a matter of time before it is influenced by vibed code. How long before pressure and a failure to comprehend vibe coding vs vibe engineering creeps into mission-critical development?
Once the consequences and challenges are called out, the book takes us on a journey to illustrate how to better approach vibe development, specifically through defining what a successful outcome should be. The brilliantly simple thing here is that the two approaches are demonstrated with multiple different LLMs using the same prompt.
While the book provides brilliantly illustrated proofs for how to better approach vibing (moving from coding to engineering), Tomasz and Artur point out that this alone is not enough; we need to lean into broader process improvements and leverage good engineering practices.
This first chapter then sets everything up that follows, taking on a journey of re-engineering a solution. Illustrating how to prompt to extract from an existing solution the details that can then be fed as prompts to generate a new solution.
The narrative progresses through considerations such as context compression, then leverages tools to enable the LLM to take on significant tasks, such as UI design, by giving it the information it needs to work out and create React components with a consistent look and feel.
The books reveal some really good ideas that allow things to be developed far more efficiently, for example, rather than expecting the LLM to scan through code, exposing the Language Server, which provides a lot of today’s IDE smarts, such as navigation through the call chain in an application. Exposing the LSP as an MCP tool offers the LLM an efficient and more reliable approach to analysing code.
If you want to follow along and test the points that the book makes, you’re not going to need to fork out masses on LLM tokens; the authors are very clear that the cost to repeat the exercises can be done within free/trial service tiers.
Conclusion
I don’t want to spoil your enjoyment of reading the book by revealing its secrets here. But there is a lot of great content, which means that, with some adjustments to how the LLM is prompted and some setup, it becomes possible to significantly reduce that trust debt.
If you’re heading down the road of vibe-based development, I would highly recommend digging into this book. We’re already making some further refinements to our processes. The changes needed to transition from vibe coding to vibe engineering won’t be shocking to those with a software engineering background. But their adoption is likely to pay back significantly.
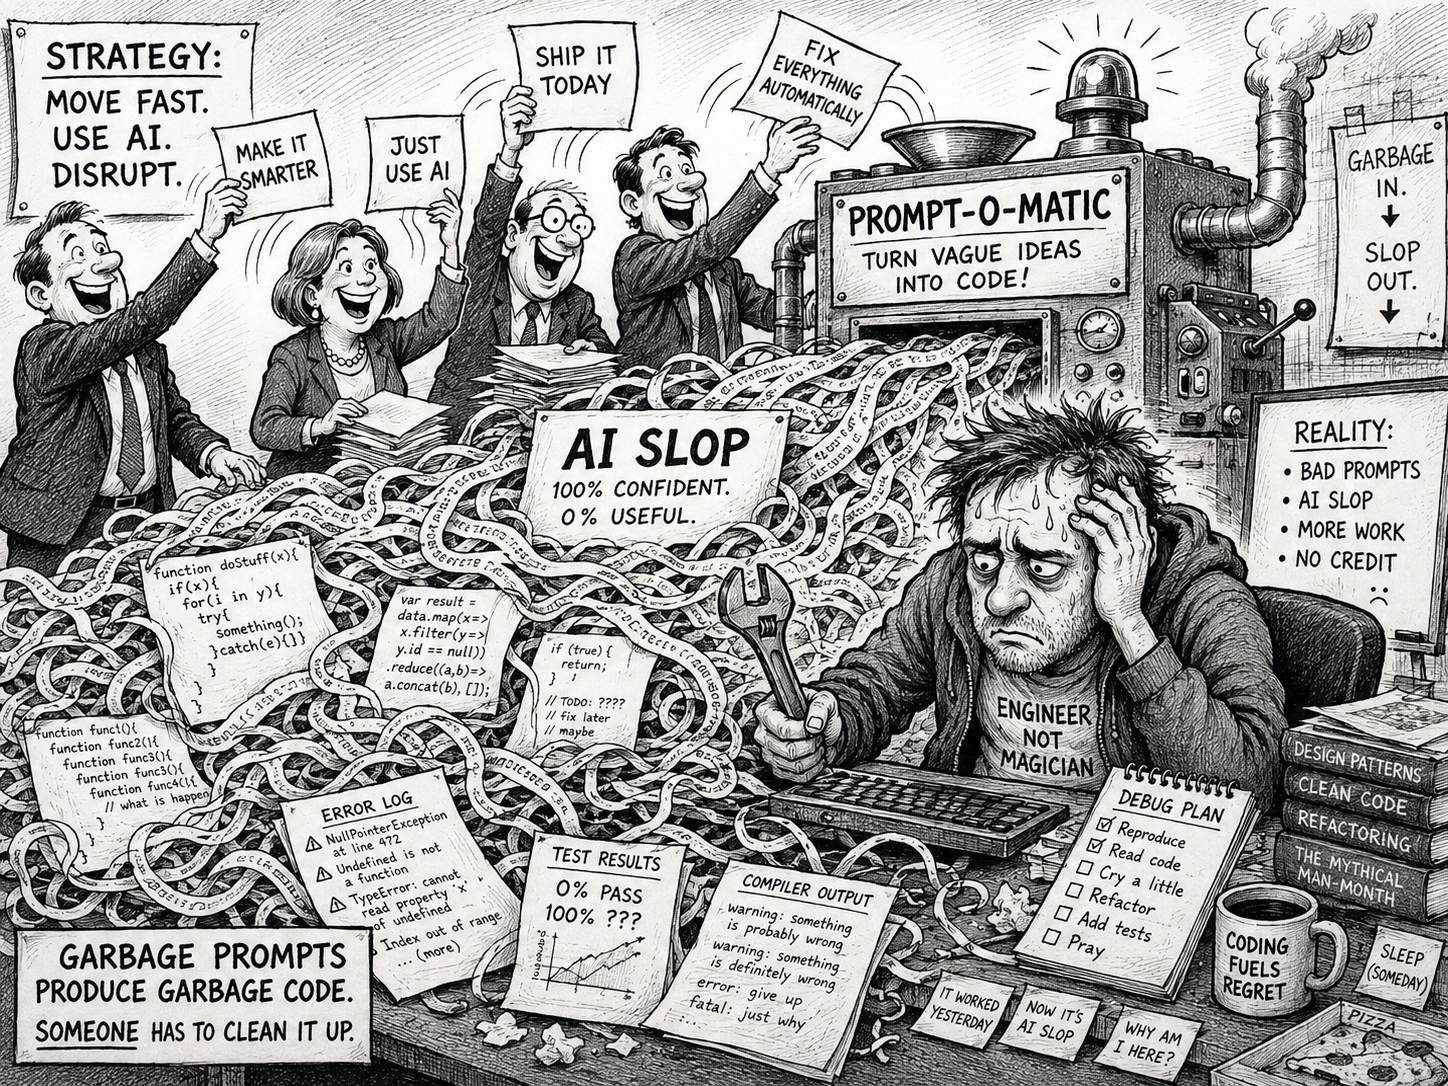
There are a lot of posts on various platforms about how AI is generating ‘slop’, and it is actually costing a lot of time to take what was generated and put it right. Cleaning up after AI is something people are even incorporating into their online biographies. On the other hand, others indicate they’re getting good results. So what is the reality? I think what we’re seeing is a combination of factors, but there is a healthy dose of human behaviour amplifying the issue.
There is no getting around how well a publicly available foundation AI can perform, depending on the availability of content for training. Providing simple Python logic, which has been asked for with clear precision and expressed clearly, is likely to yield positive results – that’s simply a function of the amount of accessible content on the web. If you asked an AI to generate formal method notations like Z or VDM – good luck.
But when we see what, on the surface, looks good, it is easy to be taken in and start to trust the LLM. Combine that with several other factors:
Humans, by our nature, will tend to minimise effort (or, if you want to be crass with language, lazy). You can see this through things like UX design principles that advocate avoiding ‘cognitive load‘ and ‘choice overload’ (the idea that we can only cope with so much information in working memory, going beyond that, we are more likely to make mistakes or need to apply more cognitive effort), through to George Kingsley Zipf’s Human Behavior and the Principle of Least Effort.
When we hand a task to an AI, the way LLMs work means that it will seek to provide an answer, rather than say sorry, can’t get an answer (if we did that, then the principle of least effort would explain why we’d give up with it). So we’re going to get a result, whereas the non-LLM route means we won’t see its incorrect until we’ve finished. When it comes to coding, the LLM is unlikely to make the coding errors we can make as humans, but the code it produces may not be as elegant or efficient, may not address all the edge cases, and may even miss the problem we want to solve. But the outcome will be executable.
Next issue is the quality of prompting: as humans, we have (generally) good long-term memory, and even if we forget specifics, we build a strong contextual understanding that we use. But the LLM doesn’t have this; it doesn’t know whether we’re trying an idea out or writing code that needs to be bombproof and extremely scalable. We have to define that very explicitly. If we’re working with a new or junior developer, we understand that we shouldn’t make these assumptions and will seek verbal and nonverbal feedback if there are issues with clarity or expectations.
When building things manually, each step we take to create the solution (whether that’s code or a PowerPoint) is slower, and we have more time to evaluate what we want to do, how we want to do it, and why we want to do things a particular way. In some respects, the LLM approach is like code reviewing. For a proper review, the reviewer is going to walk through each line of code and evaluate it – a process that can be lengthy. But under time pressure, what often happens is we’ll take a 1st fast pass to look for the ‘bad smells’ and pick up on any obvious issues. Then zero in on the bad smells, or at least the worst ones, and look more closely. But the time pressure, knowing the tooling we have to help eliminate issues, and the mental effort to quickly understand a lot of code take their toll. This, to varying degrees, is exactly what happens with LLM artefacts, except that the rate at which code can be properly reviewed is now a real issue relative to the rate of generation.
Commerce has always been about either innovating to compete or doing things more quickly and cheaply. That pressure has grown as technology has advanced, creating the potential to do more. As a result, it is not surprising to see that pressure results in code being generated, even if that is likely to drive an unwitting accumulation of technical debt that will bite in the years to come. Furthermore, recognising poor-quality code takes experience. Which means expensive engineers. It is possible to appreciate that a non-technical person can generate a basic desktop utility using ChatGPT.
As you can see, there are plenty of things we, as humans, can do to mitigate ‘AI slop’ and get AI delivering value, quality, and velocity.
Conclusion
The bottom line here is an issue of expectation. We wouldn’t be so harsh as to ask someone with dyscalculia to produce a company’s accounts using only a pencil and paper. Another way to look at it, you’d not ask an unqualified accountant to do your tax return. But that is often what is happening, Someone with dyscalculia could easily ‘hallucinate’ the numbers. An unqualified person is not going to know all the rules needed to complete a tax return well enough to minimise tax exposure.
to err is human; to persist in error is diabolical
Saint Augustine
It is human to make mistakes, and poorly directing (or training) an LLM is certainly an error. But we know this is possible, so we should consider what the code is for and take appropriate steps to mitigate it, working to improve how prompts are given and how context is provided to enable better outcomes.
What is clear to me is that ‘AI slop’ isn’t going away soon, and that as engineers, we have to get better at prompting to get the best code we can from an LLM. While it would be nice to think that the industry will realise that LLMs are not a panacea, and you still need those expensive engineers to prompt an LLM so that they don’t generate unnecessary reams of low-grade, brittle code.
The question really has to be, who is going to build an LLM model and agents that can pre-screen code and call out AI ‘slop’, saving code reviewers (particularly those who are looking after the open-source solutions on which so many of us depend). If Anthropic’s Mythos finds 20-year-old bugs, we should be able to help protect open-source projects from low-quality, poorly prompted AI-generated code.
Something that vendors like Microsoft have been really good at is reducing the friction on getting started – from simplifying installations with MSI files and defaulted options through to very informative error messages in Excel when you’ve got a function slightly wrong. Apple is another good example of this; while no two Android phones are the same, my experience is that setting up an iPhone is just so much easier than setting up an Android phone. It is also the setup/configuration where most friction comes from.
Open-Source Software (OSS), as a generalisation, tend to be a bit weaker at minimising friction – this comes from several factors:
When OSS is part of a business model, vendors can reduce that friction, making their enhanced version more attractive.
OSS contributors are typically focused on the core problem space and are usually close enough to the fine details to not need those fancy features to keep the rest of us out of trouble.
The expectation is that tools to make configuration easy are embedded in the application, making it heavier, when the aim is to keep things as light as possible.
Occasionally, a little bit of intellectual snobbery can creep in
The common challenge
The issue that I have observed is that we often go through cycles of working with a technology. For example, you’re building a microservice. Chances are, you’ll start writing and running it locally, without worrying about containerization. Once you’re pretty happy with things, you’ll Dockerize the service, start testing it locally, and then you’ll be ready to deploy it to a cluster. Now you’ll need your YAML. It may well be weeks since you last looked at Helm charts. You end up cutting and pasting your last configuration. But now you need to use another feature of Helm, can you remember the exact settings for the feature. So now you’re trawling the net for documentation, and then it takes several tries to get it right.
AI may well step in to help developers in this area, where solutions and products are well-documented. But with the wrong model or insufficient detail in the prompt, it’s easy to make a mistake. Personally, I’d turn to AI when it becomes necessary to trawl code to better understand the configuration and its behaviour, and to set options.
Experimental Solution
Solution – well, that depends upon the configuration syntax. We have been experimenting with RJSF (React JSON Schema Form), which provides a React-based UI that can be dynamically driven by a JSON schema and validate data with AJV (an alternative stack considered would have been around JSON Forms).
{
"type":"object",
"title":"Dummy",
"properties":{
"name":{
"type":"string",
"const":"dummy",
"title":"Plugin"
},
"copies":{
"type":"integer",
"description":"Number of messages to generate each time messages are generated.",
The above fragment shows part of the Schema definition for the Dummy plugin for Fluent Bit.
By then creating a schema that defines the different plugins, attributes, etc., we can drive validation and menu items easily in the UI. Admittedly, the config file is significant given all the plugins and configuration options, but it is a fair price to pay for a UI that validates the data. Establishing the schema to start with, we’ve covered it through scripting the retrieval and scraping of the Fluent Bit pages, which are pretty consistent in structure.
We have added some custom elements into the definition, for example, x-doc-reference, which allows us to extend the React components to provide features such as a link back to the original documentation as you select attributes or plugins.
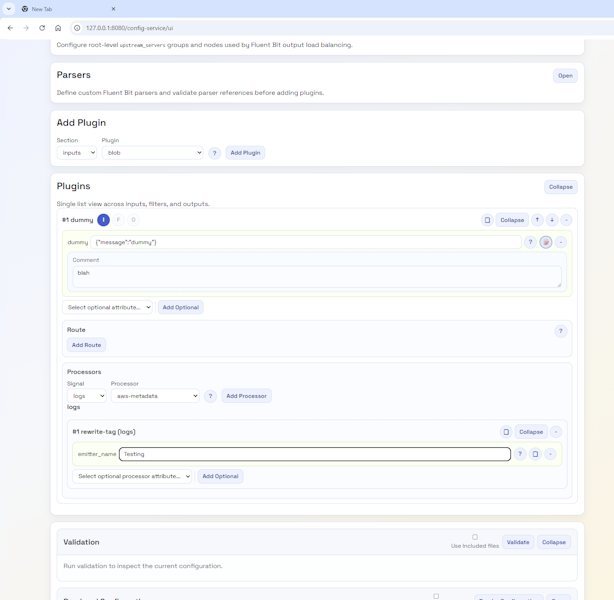
As a result, we very quickly have a UI that can look like this:
A lot easier to view and tweak, with no need to hunt for valid options. Even if we want more information, we’re just a button click away from the open-source data. Perhaps we should provide a version that hyperlinks to the Manning Live Books on Fluent Bit, etc.
There are a few other factors to consider; for example, Fluent Bit configuration is YAML, not JSON, which can be easily resolved given the relationship between the two standards. Then there are processors that can embed Lua code or a SQL-like syntax. As we’ve chosen to provide a Python backend, we’ve addressed this by providing REST endpoints which can query out of the JSON the code or SQL and perform validation using the Python Lua Parser, and the SQL syntax can be addressed using the Lark library for processing the SQL, as the syntax is simple enough to define and maintain the syntax.
Outstanding Gaps for Fluent Bit
We still need to address several features that Fluent Bit has, specifically:
Environment variables
Includes
These issues should be straightforward to overcome, although dynamically including the included elements into the UI view elements can be done. The challenge is: if any changes need to go into something that has been included, how do we push them back to the included file? Particularly if there are multiple layers of inclusion.
What about Fluentd?
Fluentd configuration isn’t JSON-based notation, but it is structured. So, to apply the same mechanism, we’ll need to define a schema and a mapping mechanism. The tricky part of the schema is that Fluentd supports nesting plugins, since the way pipelines are defined for routing differs. While JSON schema will enable this with constructs such as anyOf, oneOf, object nesting, and bounded object arrays, the structure will be more complex.
The second challenge will be the transformer/renderer, so we don’t introduce issues from having to escape and unescape characters, since JSON Schema is stricter about character use.
Then What?
Well, if we get this going, we’ll probably incorporate the capability into our OpAMP project and maybe create a build that lets the configuration tool run independently. Lastly, perhaps we should look to see if we can make the different layers a little more abstract, so we can plug in editors for other configurations, such as OTel Collectors or the ELK Stack.
As a bonus, perhaps transform the Schema into a quick reference web document?
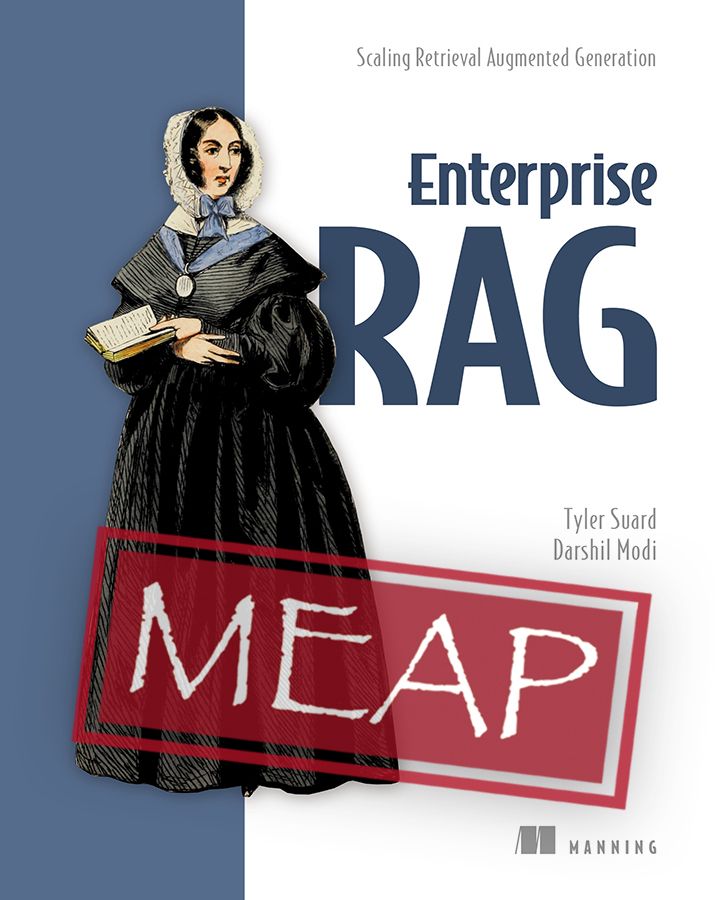
As a Manning author, I am fortunate to see the books in their MEAP (early-release state). If you have a Manning online subscription or have already ordered a copy, you’ll have this privilege as well.
I’ve been reading the MEAP copy of Enterprise RAG by Tyler Suard. At the point of writing, there are still 4 more chapters to come. But, of the first 6 chapters, I have to say, I’ve been impressed. With an open, conversational writing style, it makes for an engaging read (I may be biased here, as this is the writing style I prefer).
The book also challenges assumptions and preconceptions about what RAG needs to be. This starts with differentiation between how RAG is typically described and the needs of an enterprise-grade implementation.
While the book leans into Microsoft Azure to illustrate the development of an enterprise-class solution, much of what has been demonstrated could be implemented with any cloud vendor, and if you’re prepared to put in the effort, then completely open-source.
My recommendation: unless you already have business-wide RAG solutions that are well adopted in production, this book is worth taking a look at. Even for the more knowledgeable/experienced, there are some nicely teased out nuggets of insight.
RAG vs Enterprise RAG?
Within the first couple of pages, Tyler addresses the immediate question of what distinguishes Enterprise RAG from a normal RAG. Here, the issue is elegantly laid out in the classic challenge in engineering books: do you focus on the technical functions and ideas, or on the broader challenges of using these technologies? The key here is to separate Enterprise RAG and what Tyler refers to as Naive RAG. He is tackling the difference between the basic technical mechanics of RAG and how to make RAG work at scale within enterprises, as well as the risks, challenges, and benefits of doing so. This is not to say that one approach or another is right or wrong.
In many respects, as you read through, you want to say, ‘duh, that’s obvious‘, and it is once called out. But so many AI-related projects don’t succeed because we overlook these ‘obvious’ things. AI interaction is often embodied in free text interactions, so we can’t configure the UI into showing English, Spanish, French … UI elements- but not everyone has the same native language as the developers, so we forget to allow for this. This is just one of the multitude of things that get called out.
Walking through the chapters
After setting the scene, the book’s chapters are structured to follow the development process, starting with the AI equivalent of test-driven development (TDD) for Chapter 2. The ‘evals’, the evaluation of defined questions and expected results, and how this can be done given LLMs’ non-deterministic outcomes. This, of course, gives us a framework against which we can validate the RAG and prompting process.
Chapter 3 focuses on preparing the data so it can be retrieved and fed to the LLM to answer the question; here, Tyler challenges the working assumption that the data must come from a vector database. The argument made is that for the most effective RAG process, the most effective (relevant and accurate) data is needed; how the data is obtained is secondary to the effectiveness of the data. A vector database may be the right way to source data, but don’t get locked into that thinking. Having made this point, the book does adopt Azure AI Search, which combines vector search with other techniques to deliver the best results (such as using semantic, keyword and ranking techniques). In open source terms, this is like creating a hybridisation of OpenSearch and Vector search.
Chapter 4 takes us into the data retrieval logic and prompt augmentation, now that we have searchable data. This focuses on the use of the Autogen open source framework (sponsored by Microsoft). In many respects, this is the key chapter in terms of logic, as it shows how the framework is used, with multiple agents working in a swarm.
Chapter 5 moves into the non-functional considerations of deployment and scaling, and ensuring that the solution will work under pressure. Such considerations are as important to an enterprise-scale use case as the functional behaviour. While the chapter covers approaches to automation and testing, I was hoping for more. The approaches described are good for getting things moving, but there are enterprise strategy considerations that could at least be called out, such as PII and more advanced credential management. The last point, which I think is a more significant gap, is Observability; the book talks only of logging. No mention of tracing, the measuring of token consumption, etc.
Chapter 6, the last one currently available, is definitely back on track, addressing one of the key considerations: how do we set and manage user expectations? Is my solution addressing expectations? How well is the solution performing? With conventional apps, the very UI layout and labels, as well as menus, help set expectations. If a search doesn’t give you a means to filter by an attribute, you know the result will include things with values for that attribute that aren’t relevant. But AI use cases are typically textual conversations, with no visual cues indicating the limits of an interaction. There are products that can be integrated into web apps that make it easy to track and measure user actions. But with a simple chat panel, that won’t yield much insight. This means we should provide the means to indicate satisfaction (or lack of, and why). This is what the chapter goes into, illustrating how you could shape expectations,
There are some areas I’d like to see addressed, but it is possible, and based on the chapter titles, they will likely be addressed.
an informal noun referring to the mood, atmosphere, or aura produced by a particular person, thing, or place that is sensed or felt
This is deeply at odds with the idea of software engineering, where the OED describes engineering as:
the activity of applying scientific and mathematical knowledge to the design, building, and control of structures, machines, systems, and processes
While there is a place for vibing – to explore and help test ideas, when it comes to enterprise solutions with icy, typically have large footprints, or will grow to have large footprints and high data volumes, therefore need a more disciplined approach to ensure all those non-functional considerations can be addressed, and sustained. Put it another way, would you take an artesian approach to building and maintaining a petrochemical refinery?
This is why I try to separate the idea of vibe coding from a more disciplined AI-assisted development. A name that doesn’t roll off the tongue well, but conveys the idea that the engineer is in control and can impose discipline to drive the NFRs.
Hopefully, this also helps address nuance, which is often missing in discussions about the use of AI in software engineering, which is definitely polarising viewpoints (like many things today).
Spec-driven development
Spec Driven Development (SDD) is a growing topic in the A.I. assisted development space, and growing as a reflection of the fact that LLMs are improving rapidly, best illustrated at the moment with Mythos. The basis of SDD is to help drive consistency, structure, sustainability and rigour into the AI dev process (back to vibe coding). Consistency and structure allow us to start to easily agentify or tool aspects of development.
Getting a consistent, clear explanation of what constitutes SDD isn’t necessarily straightforward, but the best definition is in an article by Birgitta Böckeler on Martin Fowler’s website. The article dives into not just a basic explanation, but also characterises the differing approaches. The article teased out three versions of the idea, which paraphrasing are:
Spec First – very much like the old-fashioned, here are the requirements that are used to generate a first iteration of the code base. Then subsequent refinements, improvements and general evolution are introduced through successive direct code changes, and/or direct prompting of the LLM to modify different pieces, and add functionality.
Spec Anchored – the Spec is retained for ongoing reference and maintained.
Spec as Source – we don’t really care bout the code, we want a change, we only edit the spec. Code is almost a form of conversation memory, which prevents the LLM from recreating from scratch and producing an answer that looks a bit different, potentially resulting in API names that differ, etc.
This evolution, particularly as people move or are pushed by leadership fearing losing a competitive edge through perceived lower development velocity, increasingly towards a spec-only approach, left me thinking about the agile manifesto and its declaration:
‘we value working code over documentation‘.
While this still has to be true, as ultimately, working code delivers the value. But the heading for the documentation has to be clear, concise, and sized for LLMs’ working documentation, as that is how we get to working code. This isn’t just to bash out some instructions and unleash the LLM; it does need to be refined and iterated on (in many ways, just like a book). We should prompt the LLM to seek clarification rather than let it make assumptions. Furthermore, we need the documentation to be accurate because an LLM will exhibit childlike trust, and if it is working with misaligned content, you’re in a 50/50 position. Unleashing an LLM on your codebase may lead to the wrong outcome. Perhaps, we need to extend the Agile manifesto, with a statement like:
we value correct, accurate, clear and concise documentation over any documentation
In other words, when using an LLM in your development context, it is better to get the LLM to reverse engineer the code to create documentation of your current state (even if that is at the price of losing the original context, design ideals, requirements, etc.) than to allow the LLM to see inaccurate and poor documentation. If this new principle is true, then we need to move away from Spec first to atleast Spec anchored approach.
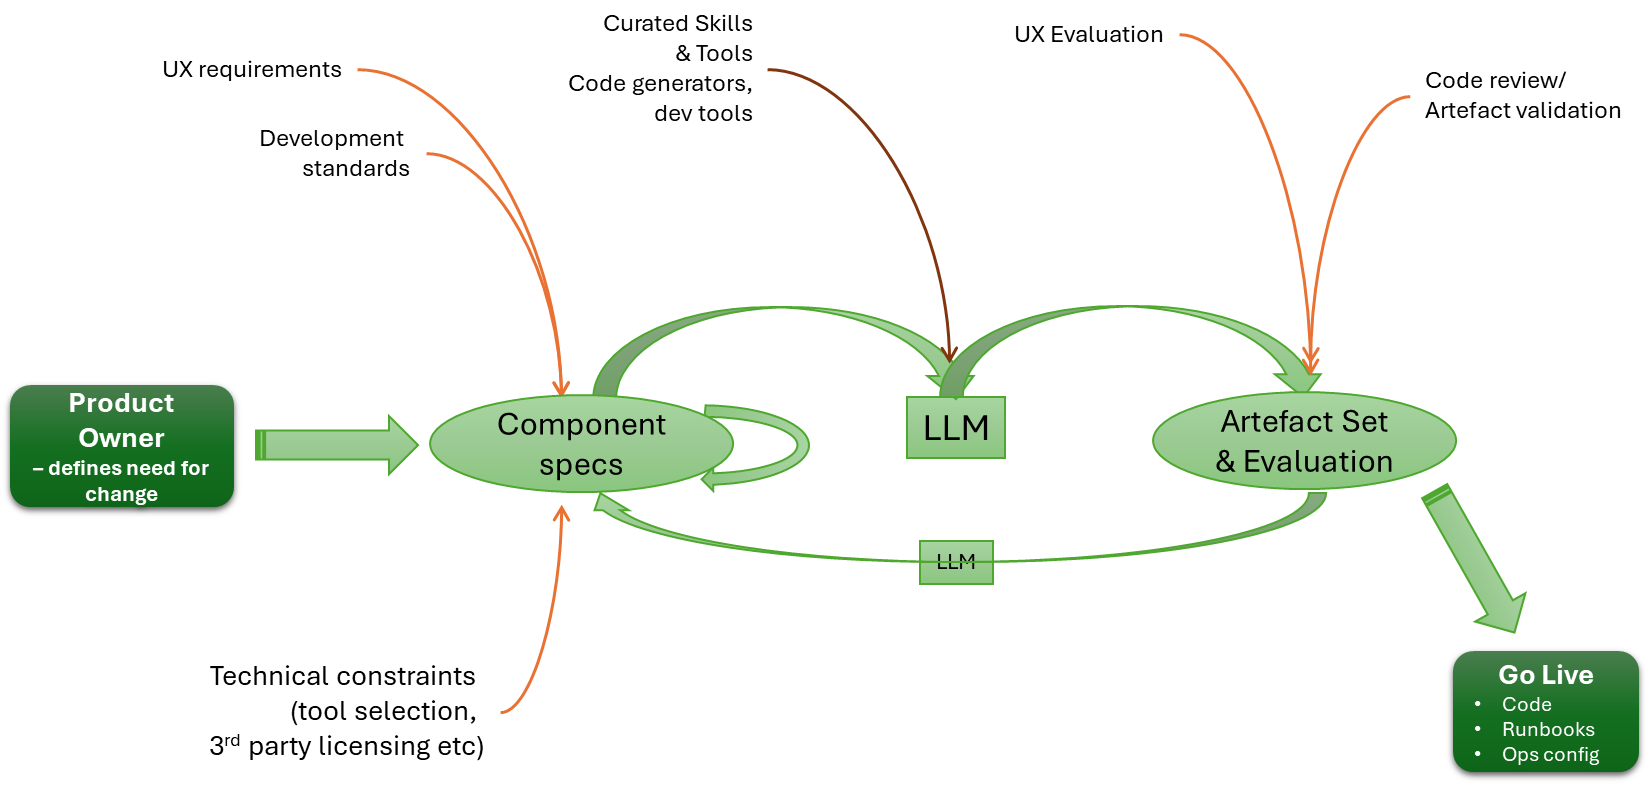
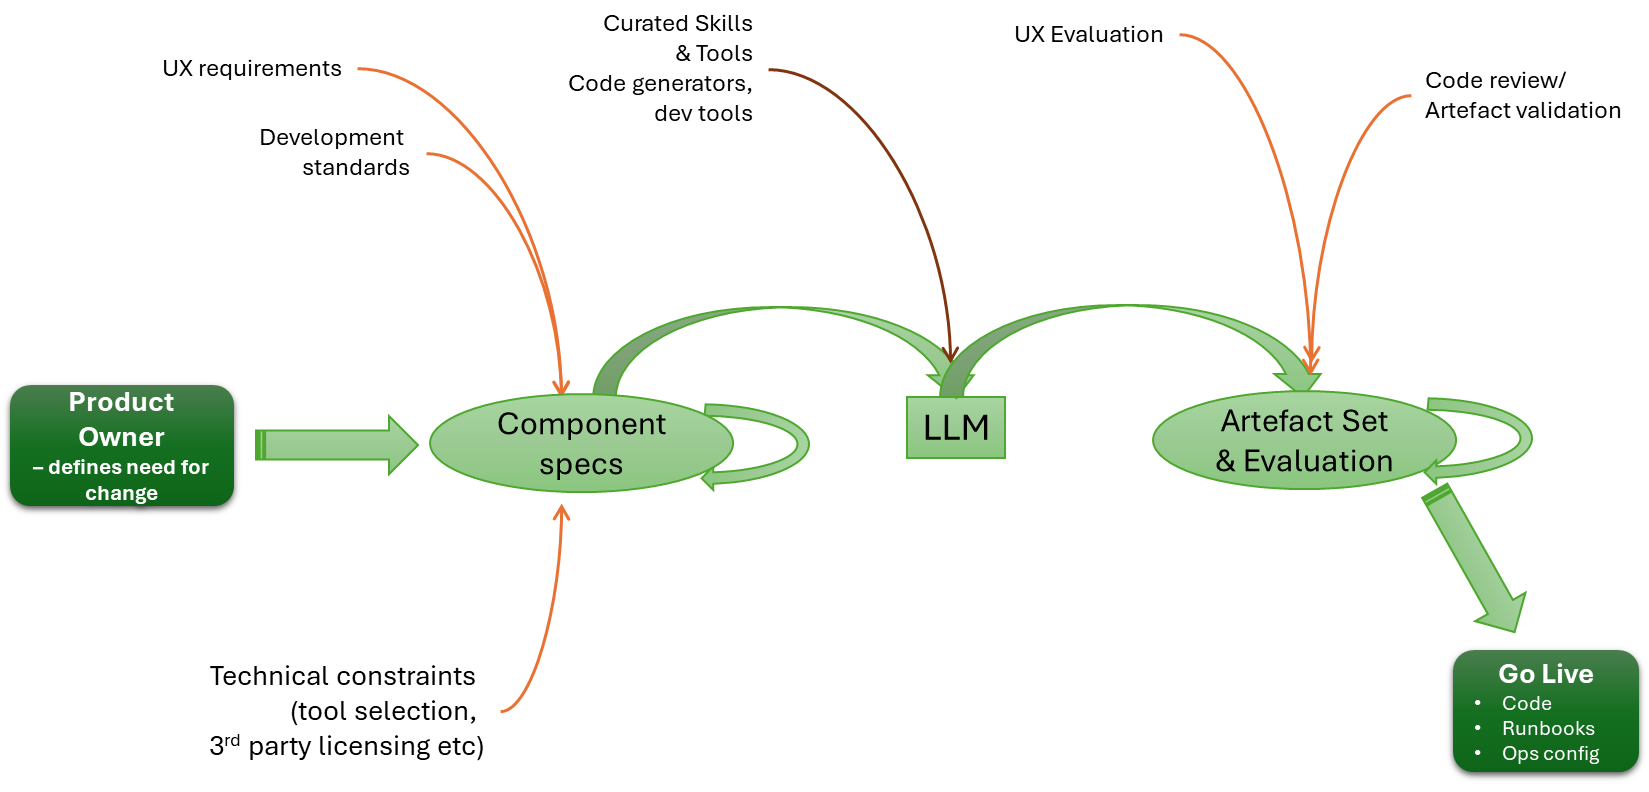
Given this, we should see the heart of an engineering process looking something like:
This is what we should expect with a Spec Anchored or Spec as Source. Whereas with Spec First, the return flow will never happen.With Spec First, our process is more like this: once the code for the first iteration is generated, we just iterate on it.
I think one of the challenges with the view of everything is that, as the Spec lead, there is an expectation that, to do it, we go from a very high-level definition straight to code. The reality is that we need the process to be more human-like. We use the LLM to take requirements and drive a high-level design. We then use the LLM to break the HLD into multiple LLDs. Importantly, we iterate on the process, until the decomposition of detail is right. The LLM cycle focuses on just one output at a time. We can certainly then use the LLM to determine consistency and integrity across all the LLDs.
From Requirements to Architectural Views
There is a natural extension to this. If we are to swing back to a document-led approach (albeit with a very different journey from document to working code), could we see increased adoption of TOGAF and other architectural frameworks? Many in the past have used such frameworks as part of the argument as to why things should be code first, as often the framework artefacts are seen as the end, rather than the process and techniques as a means to an end (i.e. we do architecture, therefore I must create a large document set, rather than we do architecture to ensure we get the details we need from code correct).
Certainly, using an LLM to help with the creation and maintenance of architectural views, including making it easier to search for and address inconsistencies across different viewpoints, without necessarily needing very prescriptive, complex, and expensive toolsets.
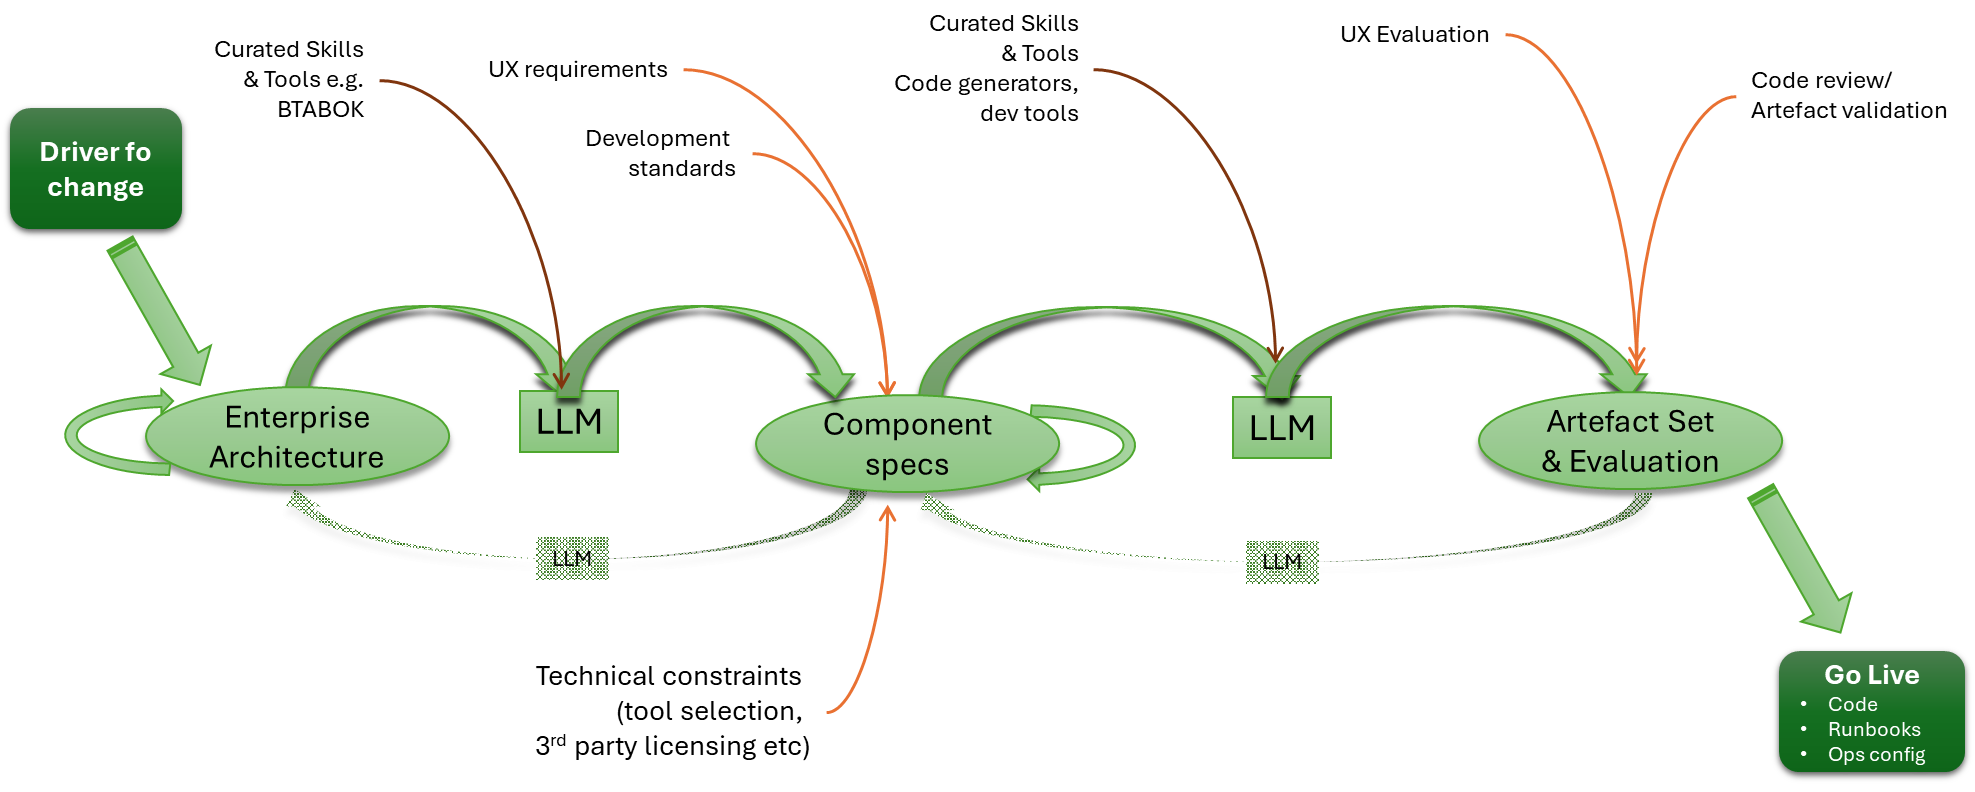
The document flow if we start with architectural frameworks, from Zachman, TOGAF, C4 etc. Note the return flow needed for Spec Anchored or Spec as Source is rarely happens.
A step in this direction may well be projects such as Common Architecture Language Model (CALM), which is supported by the Fintech Open Source Foundation (FINOS), a child organisation of the Linux Foundation. While I haven’t investigated CALM very deeply, the essence is to define the architectural building blocks in a structured manner, which means that, from the definitions, more detailed diagrams can be generated and AI can be used to analyse the artefacts, etc. This sounds like a potential stepping stone between the organisation/enterprise models of Zachman and TOGAF, which aim to describe how both businesses operate and the underlying technology.
Could we see a time when docs and code stay aligned?
My experience has shown that when a spec has been involved in the process, it has exhibited the characteristics of the Spec First approach, and that the most consistently accurate documents are the user manuals, purely because they have to be created from what the code does. But such documents aren’t meant to tell you about the inner workings of a solution. This is true to the point that organisations have abandoned their architectural models, as they can’t be trusted as an as-is reflection and must start from scratch.
But to achieve the value of Spec Anchored or Spec as Source, we have to ensure that the feedback loop is working: the LLM feeds a backup stream with any changes, and downstream inputs, such as the impact of tool selection, can shift the solution. While the feedback loop should be a lot easier, it still requires commitment and effort to ensure that flow happens (certainly, since it is typically not a regularly practised behaviour).
Flies in the ointment
Trying to drive even a Spec Anchored philosophy is going to be difficult if the LLMs aren’t so great at generating quality code, or quality low-level designs that lead to the code generation. These factors are going to be dependent on choice of LLM being used, how the LLM is prompted, and most crucially the target programming languages (A.I. Codex does well with Python and Java, but I doubt it would make a good job of something like Erlang or Lisp).
The second problem is that there is a common error of people wanting to jump in and cut code (or documents), which often comes from:
Rather than stopping to ask the question, has this problem been solved before, and in a way I can leverage? We plough on creating new unproven code.
The view that the only place where a solution can come from is within the engineering team.
While it will be easy to blame the LLM for problems coming from these actions, are very much human.
Conclusion
As we’ve worked through much of this picture, the irony is that, in many respects, we’re no further forward. We can still make the same mistakes (failing to work through the NFRs properly, failing to define what should happen when something is wrong – aka ‘unhappy paths’, which make recovery simpler). We just have coding and document writing speed shift from 30-40Hz (the speed of a keyboard warrior) to GHz. The same problems can occur because influential decisions are still human (and remember, LLMs are, at their heart, just a computational representation of common thinking (wisdom of crowds, you might say) and therefore still vulnerable).
Going faster means mistakes happen more quickly, and uncorrected mistakes create more mess. To use an analogy, if you crash a car into a wall at 10mph, you’ll damage the bodywork, but it won’t be catastrophic. For many men, the biggest damage will be to the ego. You have the same crash at 100mph, and the outcome will be fatal. While the ability (or lack of) to absorb the energy is what will be the killer, it is actually the fact that you no longer have the time to think and change direction that is the true cause.
Perhaps what we should be seeking from AI is not to get to the end faster, but to use the acceleration to create time to consider what it is we want to achieve and how we continue building on our long-term, more sustainable achievements. This isn’t anti-agile. But it is anti ‘fail fast, fail frequently’ which has been a conflation of ideas without full understanding, and becoming more regularly challenged (like this Forbes Article)
I’ve written a few times about how OpAMP (Open Agent Management Protocol) may emerge from the OpenTelemetry CNCF project, but like OTLP (OpenTelemetry Protocol), it applies to just about any observability agent, not just the OTel Collector. As a side project, giving a real-world use case work on my Python skills, as well as an excuse to work with FastMCP (and LangGraph shortly). But also to bring the evolved idea of ChatOps (see here and here).
One of the goals of ChatOps was to free us from having to actively log into specific tools to mine for information once metrics, traces, and logs reach the aggregating back ends, but being able to. If we leverage a decent LLM with Model Context Protocol tools through an app such as Claude Desktop or ChatGPT (or their mobile variants). Ideally, we have a means to free ourselves to use social collaboration tools, rather than being tied to a specific LLM toolkit.
With a UI and the ability to communicate with Fluentd and Fluent Bit without imposing changes on the agent code base (we use a supervisor model), issue commands, track what is going on, and have the option of authentication. (more improvements in this space to come).
New ChatOps – Phase 1
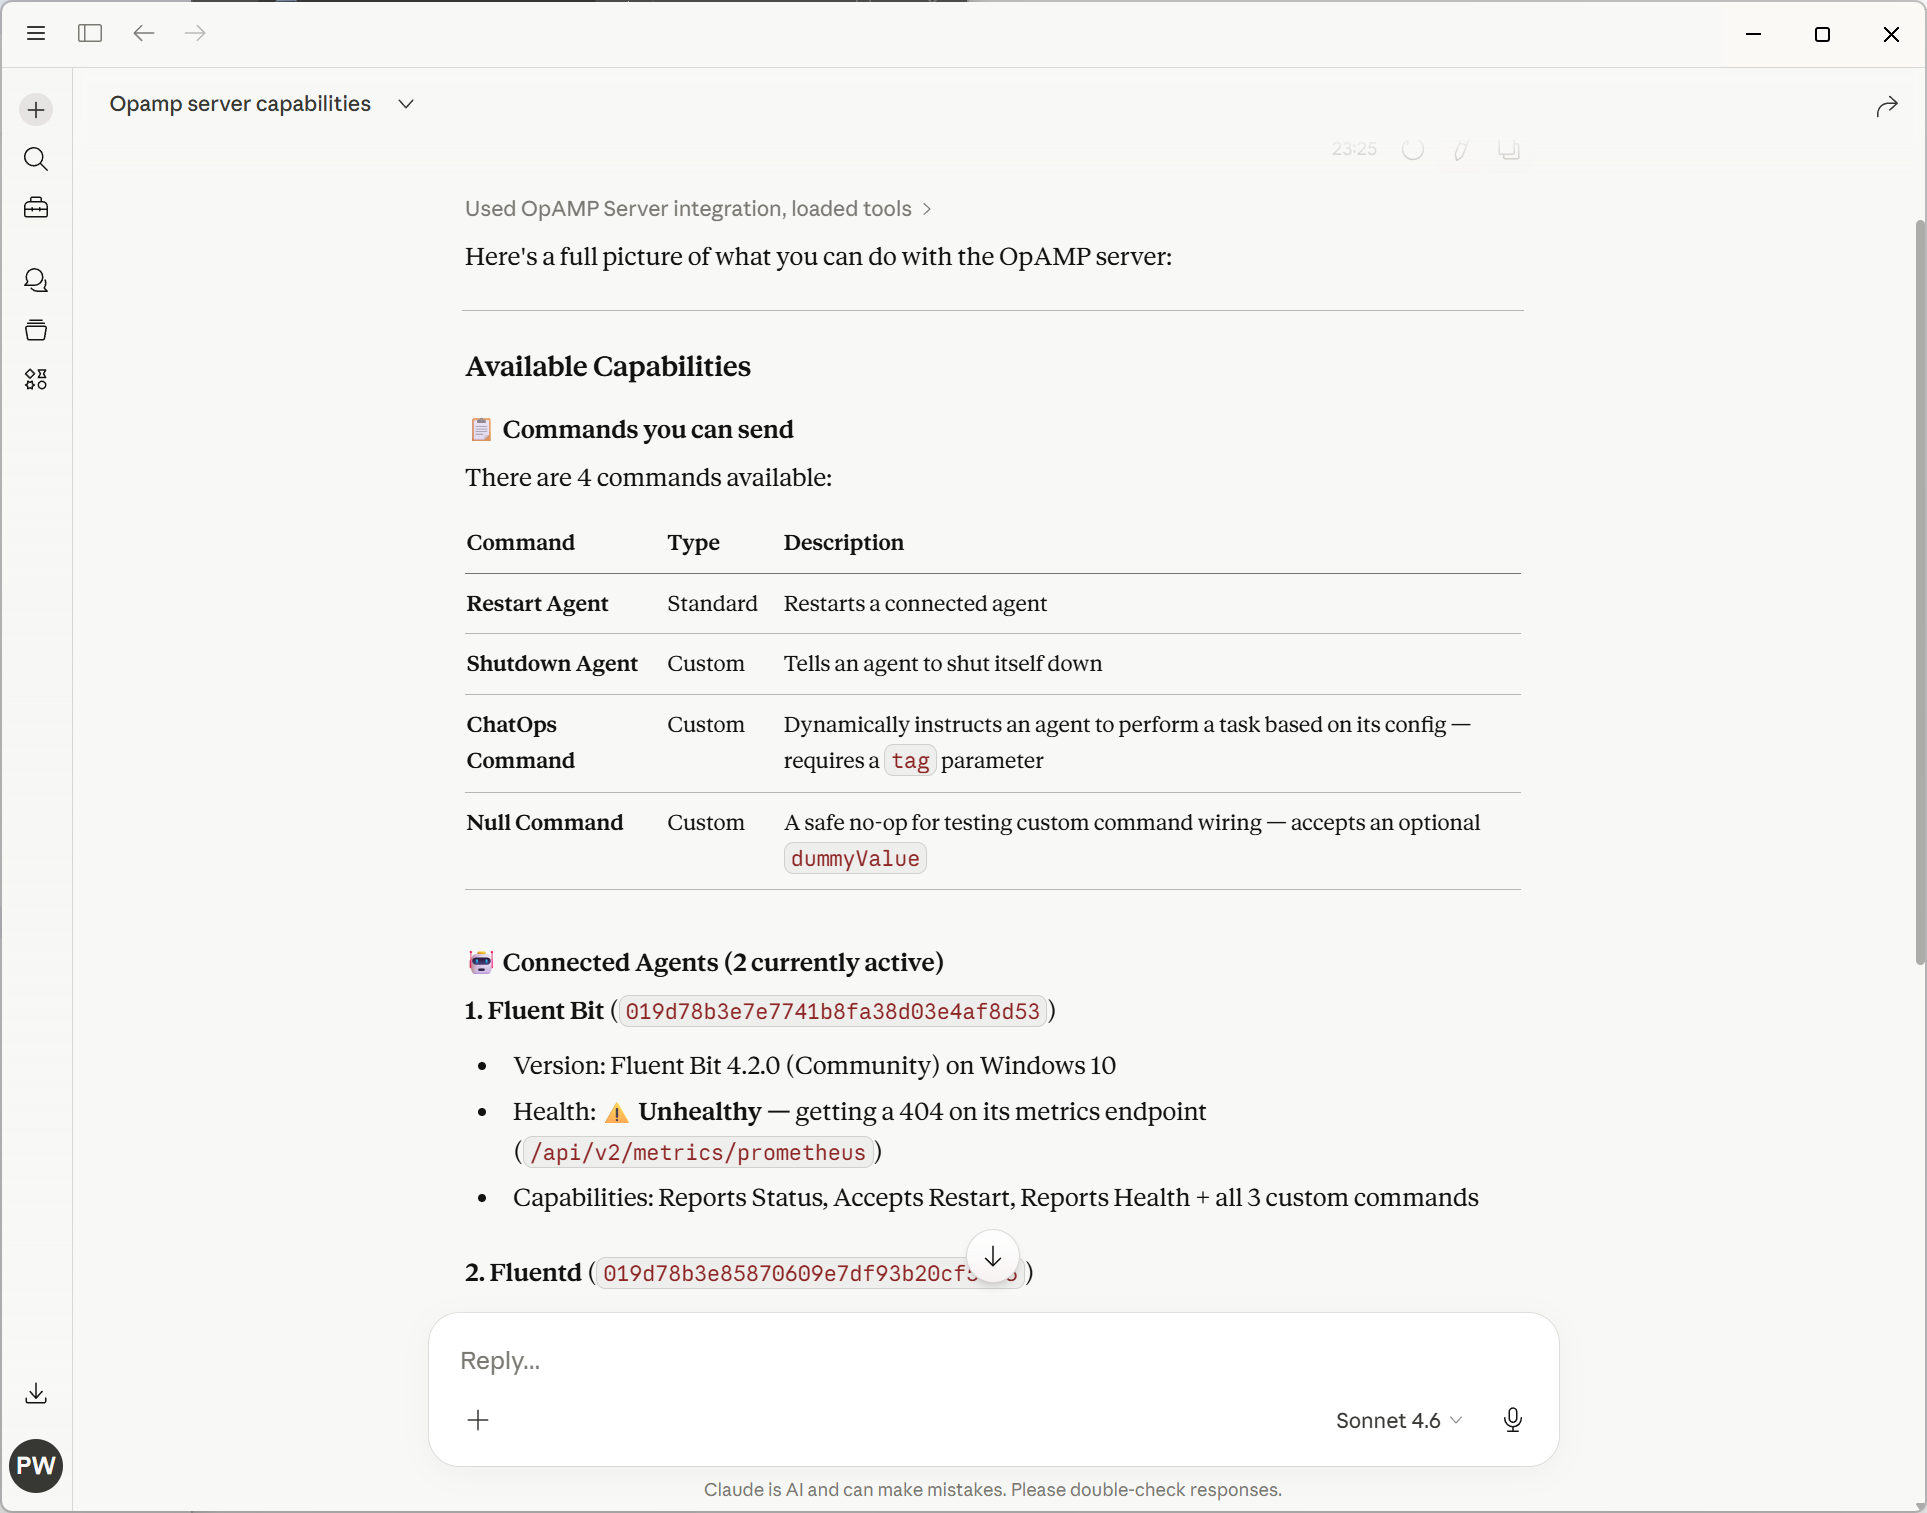
With the first level of the new ChatOps dynamism being through LLM desktop tooling and MCP, the following are screenshots showing how we’ve exposed part of our OpAMP server via APIs. As you can see in the screenshot within our OpAMP server, we have the concept of commands. What we have done is take some of the commands described in the OpAMP spec, call them standard commands, and then define a construct for Custom Commands (which can be dynamically added to the server and client).
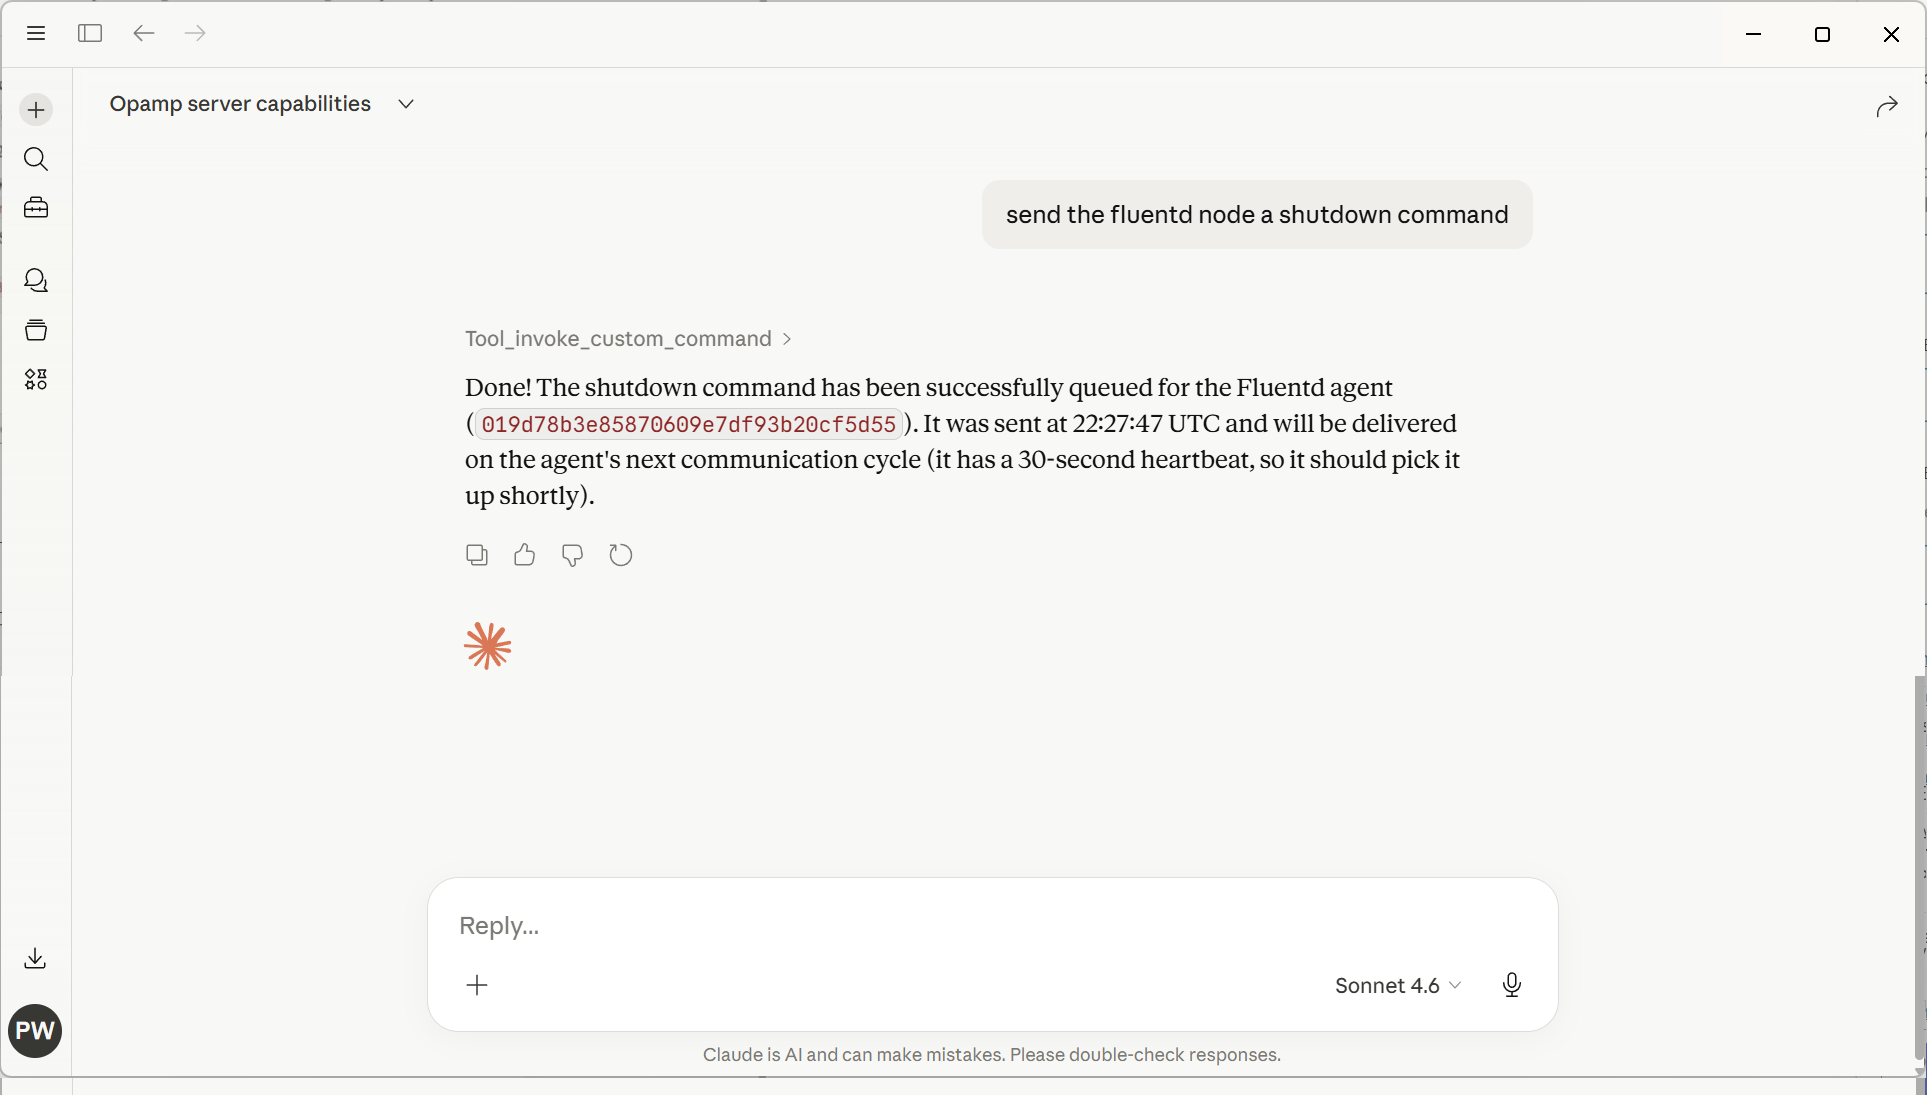
The following screenshot illustrates using plain text rather than trying to come up with structured English to get the OpAMP server to shut down a Fluentd node (in this case, as we only had 1 Fluentd node, it worked out which node to stop).
Interesting considerations
What will be interesting to see is the LLM token consumption changes as the portfolio of managed agents changes, given that, to achieve the shutdown, the LLM will have had to obtain all the Fluent Bit & Fluentd instances being managed. If we provide an endpoint to find an agent instance, would the LLM reason to use that rather than trawl all the information?
Next phase
ChatGPT, Claude Desktop, and others already incorporate some level of collaboration capabilities if the users involved are on a suitable premium account (Team/Enterprise). It would be good to enable greater freedom and potentially lower costs by enabling the capability to operate through collaboration platforms such as Teams and Slack. This means the next steps need to look something along the lines of:
There has been a rapidly growing series of articles being written about the limited launch of Mythos, a new LLM. The evolution of models has helped quickly advance AI-assisted software development. But the capabilities of Mythos and Project Glasswing that really grabbed attention and concern.
Glasswing is an initiative that allows major partner software and service vendors to access the Mythos model. This is because Mythos has made significant advances in identifying software vulnerabilities and generating exploits for them. This has been illustrated by Anthropic’s Red team – which found bugs in OpenBSD (OS) that have evaded detection for as much as 27 years. While the BSD family of operating systems isn’t as pervasive as Linux, they both share a similar open ethos and a sufficient community to keep them active and maintained. The underlying message here is that we can find and exploit such vulnerabilities, and there are certainly opportunities to do so elsewhere, in software that can affect a great many more users, such as Firefox.
Having key software vendors, such as OS and browser vendors, get access is certainly a positive step, but it doesn’t address a key consideration. Applying code fixes and releasing updates does not, by itself, equate to being safer. The true challenge is for end users and organisations to recognise the need to roll out updates quickly. This is where the source of true concern should be. The concerns …
Organisations don’t always release patches as soon as they’re available. There is an element of testing to ensure no adverse impact on each organisation’s setup. Even with simple browser changes, something affects the app’s behaviour.
Change represents risk, and organisations that experience issues during rollouts become increasingly risk-averse. Ironically, this is counterintuitive, but a very human reaction.
Vendors’ patching tends to prioritise the latest versions of products, which can create dependency challenges. Bringing software up to date can result in a growing infrastructure footprint (more storage, memory and CPU needed – vendors add capabilities and features to compete and meet customer feature needs, driving continuous growth). That can really add costs, particularly in highly distributed use cases, such as user desktops and IoT devices. Addressing the accumulation of patches means devices no longer have the capability to properly service the new footprint. Consider this: why do people replace smartphones? Sometimes it’s hardware features like a better camera, but often it’s simply not enough storage or not being able to run all the apps, photos, etc.
.Digging into some of the details from the Red Team shows that the LLM usage costs to uncover the vulnerabilities run from $50 – $20,000. This could have ramifications for smaller, more specialised software solutions where the cost of regularly rerunning the analysis outstrips potential revenue. As a result, we could suddenly see software product prices climb, or companies simply stop producing products we depend on. This may also see bad actors wanting to more quickly recoup the cost by accelerating the use of new exploits, in other words, more attacks, coming more quickly. Such considerations will create more pressure on the speed of patch cycles.
This level of capability suggests that we really do need to ensure people shift from boundary-style security to security at every layer of our solutions. That’s not just simply authentication, but code being defensive, validating data values it gets given and os on.
All of this means we have to change mindsets from just enough, or simply putting a front-line security layer in place, to embedding. As end users, we must start to adopt several behaviours:
Security conscious with our own devices – keeping software up to date and patched. I would consider my family to be above average when it comes to tech savvy, but even I am having to go in and run Windows updates on laptops, for example.
Start voting with our feet – many of the services we use are largely or entirely software-powered (banks, energy providers), if those providers show signs of not taking security seriously enough, time to go elsewhere before we become victims.
Keeping up
One observation that the Mythos and Project Glasswing reporting is that the advancements are significant step changes, not incremental advancements (for example, Antghropic’s Sonnet 4.6 was only released a couple of months ago, and didn’t score highly for creating exploits – although better at detection). This suggests a couple of things …
IT law has always played a game of catch-up, but if the advancements are going to be this large and this frequent, we have to start legislating against hypotheticals and allowing legal precedents to produce fine detail interpretations.
We may have to consider big-brother observation of AI use, mitigated by strong transparency rules governing the handling of findings.
Is the idea that we need to start looking at incorporating something like Asimov’s 3 Laws of Robotics into LLMs now looking far-fetched?
Do we need to start thinking about mitigating the risk of deep exploits by bringing back the possibility that systems must be air-gapped?
Hyperbole?
It would be easy to put this down to hyperbole, or wanting to be a click-baity, but this is gaining a lot of high-profile attention, just consider these examples:
's Blog")


You must be logged in to post a comment.