's Blog")
Tags
AI, artificial-intelligence, book, development, LLM, review, Technology, vibe coding, Vibe Engineering
I’ve written a bit about AI in the development process; this has been driven largely by my own experiences, colleagues’ experiences, and blog content from people I trust. So I thought it would be worthwhile to validate my perspectives against those who are more in the know on the subject. So here is my review of the book Vibe Engineering by Tomasz Lelek and Artur Skowroński.
The book opens with a very clear differentiation between vibe coding and vibe engineering (which approximates to what I’ve previously called AI-assisted development). Not only are the key conceptual differences outlined, but the consequences of vibe coding into production are also really driven home …
teams that skip the transition from prototype to engineered artifact consistently report higher defect density, longer incident resolution, and faster architectural decay
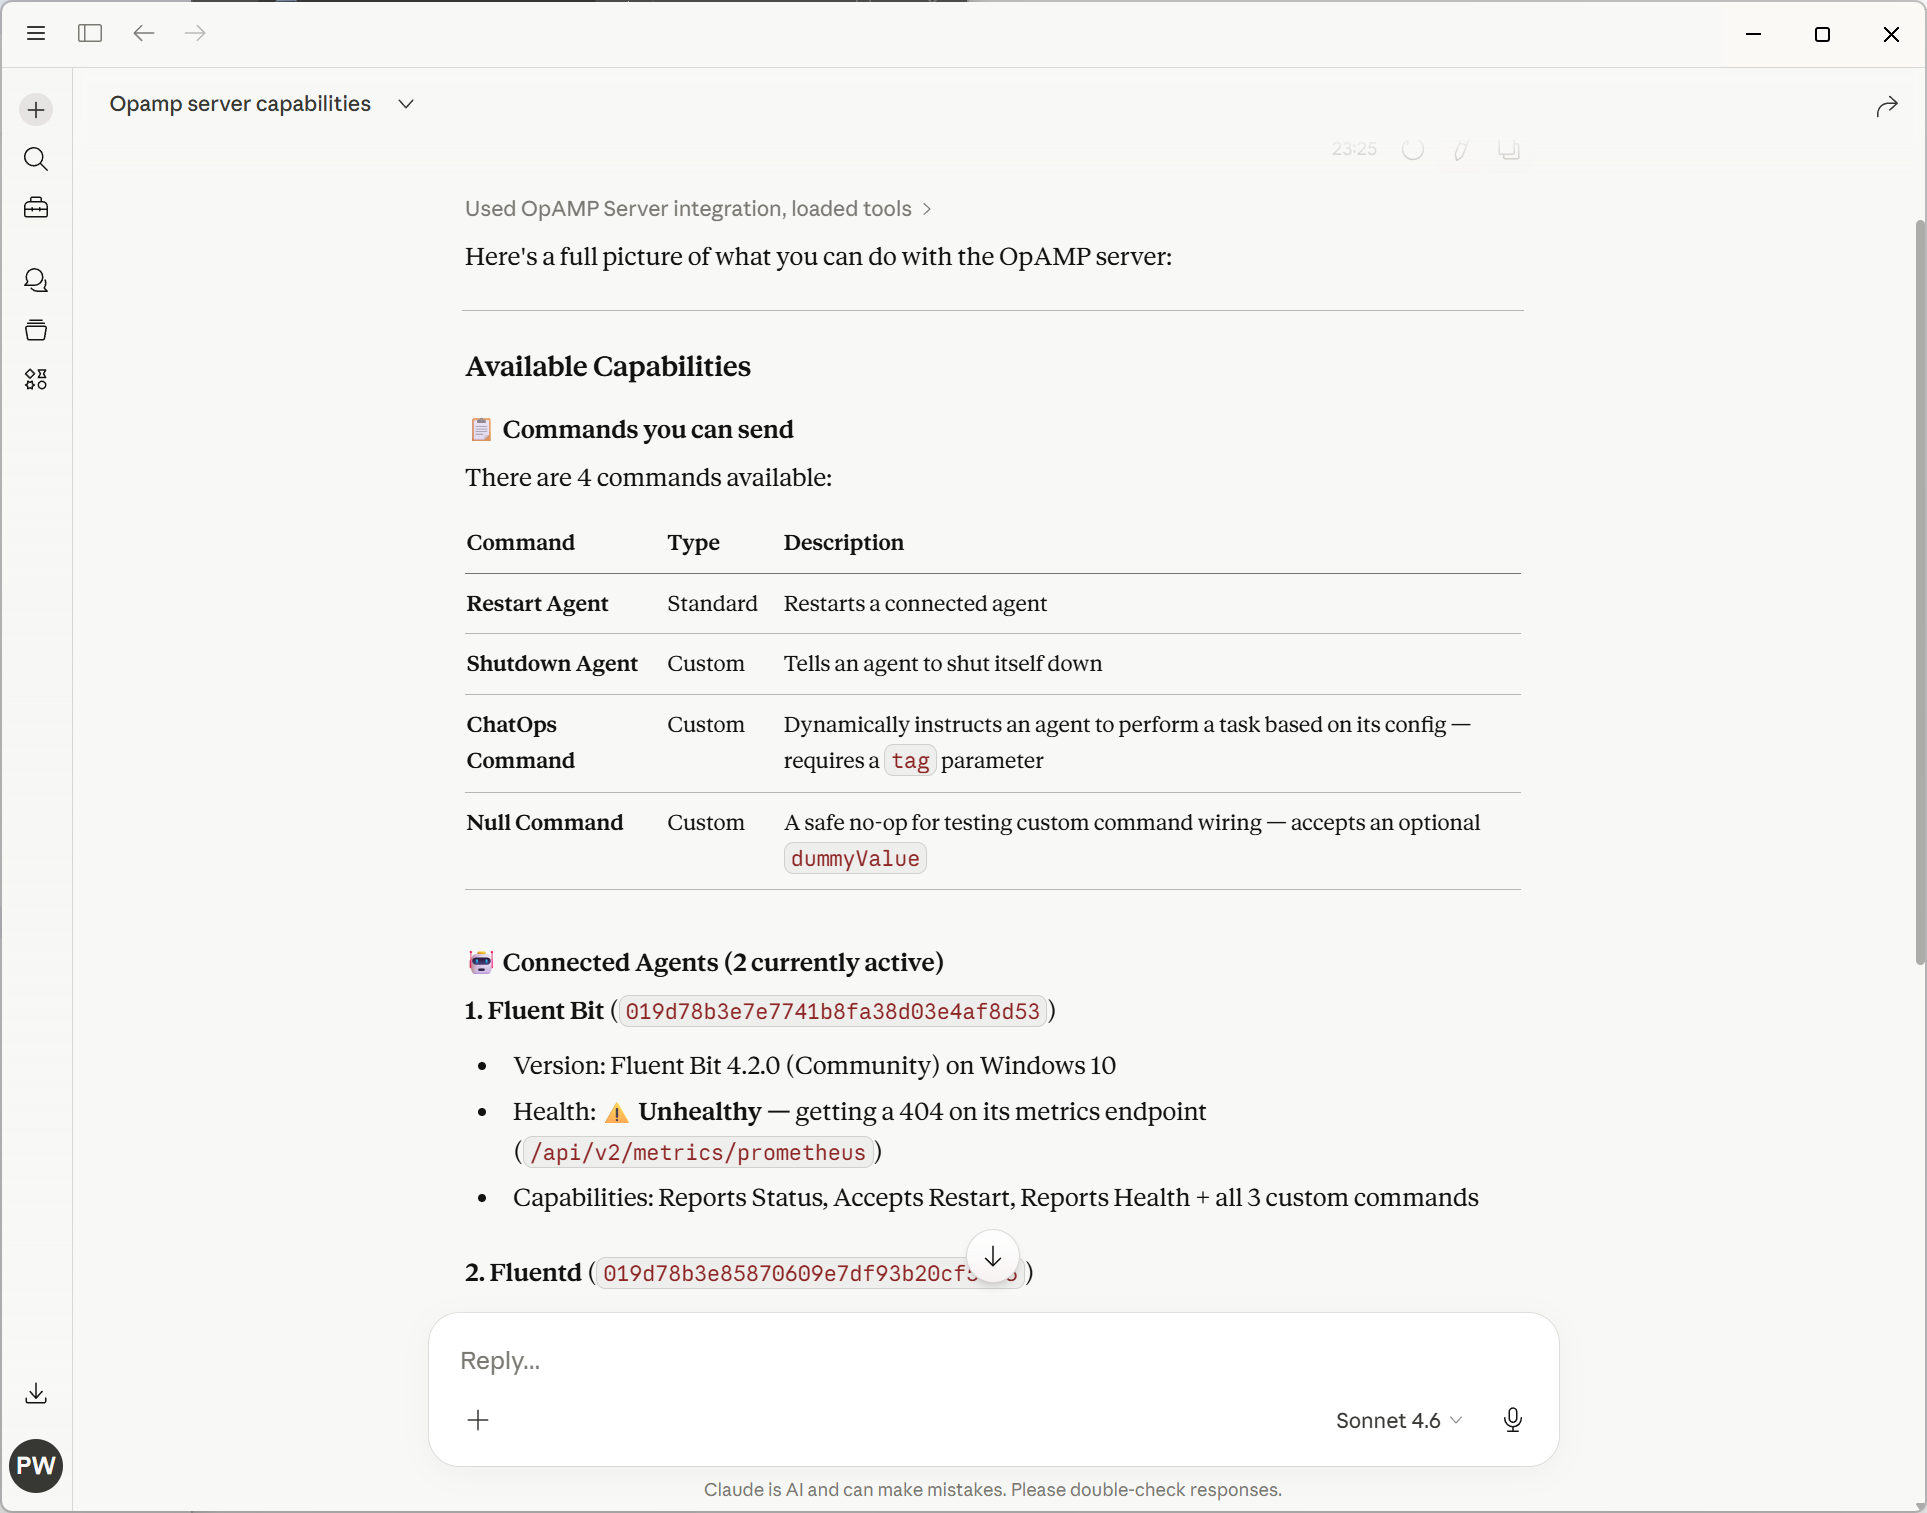
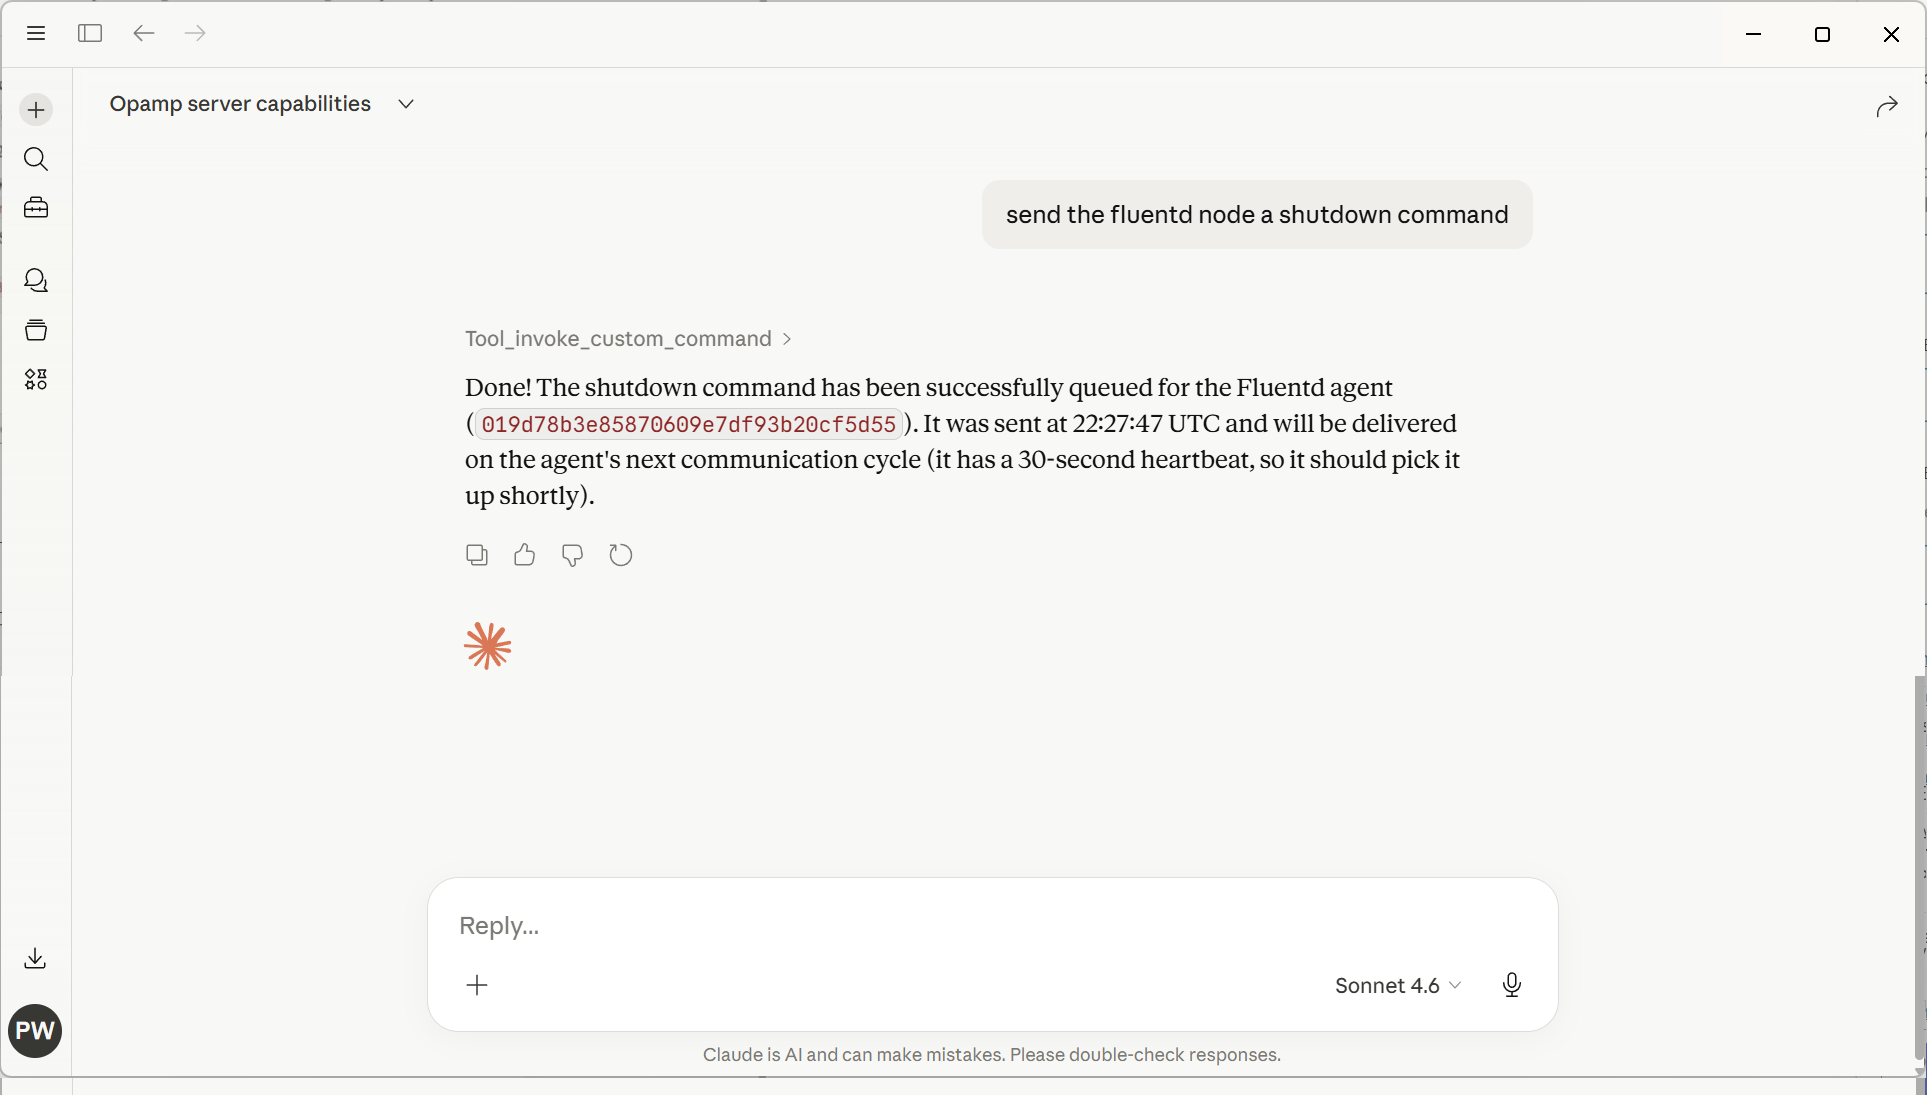
The book also shares some real horror stories of blindly trusting LLMs, particularly in operational contexts.
The crucial challenges of vibe coding beyond ideation, PoC, and possibly MVP are brilliantly distilled. Code will do something, but is it right? Is it safe? Will it scale? Can we maintain it?
Tomasz and Artur outline a form of debt called trust debt. Where we have trusted the LLM, and it accumulates issues, particularly with NFRs that are not managed and paid down, it will seriously bite, just as tech debt does. The difference is that tech debt is more readily appreciated and generally easier to understand.
debt is a direct byproduct of the dump-and-review culture. This approach uses AI to generate a large slab of code, opens a pull request, and implicitly offloads responsibility for verification to the reviewer. It’s classic diffusion of responsibility: the presence of the AI (“the model wrote it”) and a reviewer (“someone will check it”) dilutes the author’s ownership of quality
Current approaches to this kind of development can very easily lead to the issues that Human-Machine Interface researchers talk about as automation complacency and the out-of-the-loop problem
The book also highlights interesting parallels, such as those in autonomous vehicle accidents. The consequences may not be as spectacular or as tragic (today), but they can be just as harmful, given that code affects every little aspect of our lives and the decisions we make. It is only a matter of time before it is influenced by vibed code. How long before pressure and a failure to comprehend vibe coding vs vibe engineering creeps into mission-critical development?
Once the consequences and challenges are called out, the book takes us on a journey to illustrate how to better approach vibe development, specifically through defining what a successful outcome should be. The brilliantly simple thing here is that the two approaches are demonstrated with multiple different LLMs using the same prompt.
While the book provides brilliantly illustrated proofs for how to better approach vibing (moving from coding to engineering), Tomasz and Artur point out that this alone is not enough; we need to lean into broader process improvements and leverage good engineering practices.
This first chapter then sets everything up that follows, taking on a journey of re-engineering a solution. Illustrating how to prompt to extract from an existing solution the details that can then be fed as prompts to generate a new solution.
The narrative progresses through considerations such as context compression, then leverages tools to enable the LLM to take on significant tasks, such as UI design, by giving it the information it needs to work out and create React components with a consistent look and feel.
The books reveal some really good ideas that allow things to be developed far more efficiently, for example, rather than expecting the LLM to scan through code, exposing the Language Server, which provides a lot of today’s IDE smarts, such as navigation through the call chain in an application. Exposing the LSP as an MCP tool offers the LLM an efficient and more reliable approach to analysing code.
If you want to follow along and test the points that the book makes, you’re not going to need to fork out masses on LLM tokens; the authors are very clear that the cost to repeat the exercises can be done within free/trial service tiers.
Conclusion
I don’t want to spoil your enjoyment of reading the book by revealing its secrets here. But there is a lot of great content, which means that, with some adjustments to how the LLM is prompted and some setup, it becomes possible to significantly reduce that trust debt.
If you’re heading down the road of vibe-based development, I would highly recommend digging into this book. We’re already making some further refinements to our processes. The changes needed to transition from vibe coding to vibe engineering won’t be shocking to those with a software engineering background. But their adoption is likely to pay back significantly.


You must be logged in to post a comment.