I’ve written a few times about how OpAMP (Open Agent Management Protocol) may emerge from the OpenTelemetry CNCF project, but like OTLP (OpenTelemetry Protocol), it applies to just about any observability agent, not just the OTel Collector. As a side project, giving a real-world use case work on my Python skills, as well as an excuse to work with FastMCP (and LangGraph shortly). But also to bring the evolved idea of ChatOps (see here and here).
One of the goals of ChatOps was to free us from having to actively log into specific tools to mine for information once metrics, traces, and logs reach the aggregating back ends, but being able to. If we leverage a decent LLM with Model Context Protocol tools through an app such as Claude Desktop or ChatGPT (or their mobile variants). Ideally, we have a means to free ourselves to use social collaboration tools, rather than being tied to a specific LLM toolkit.
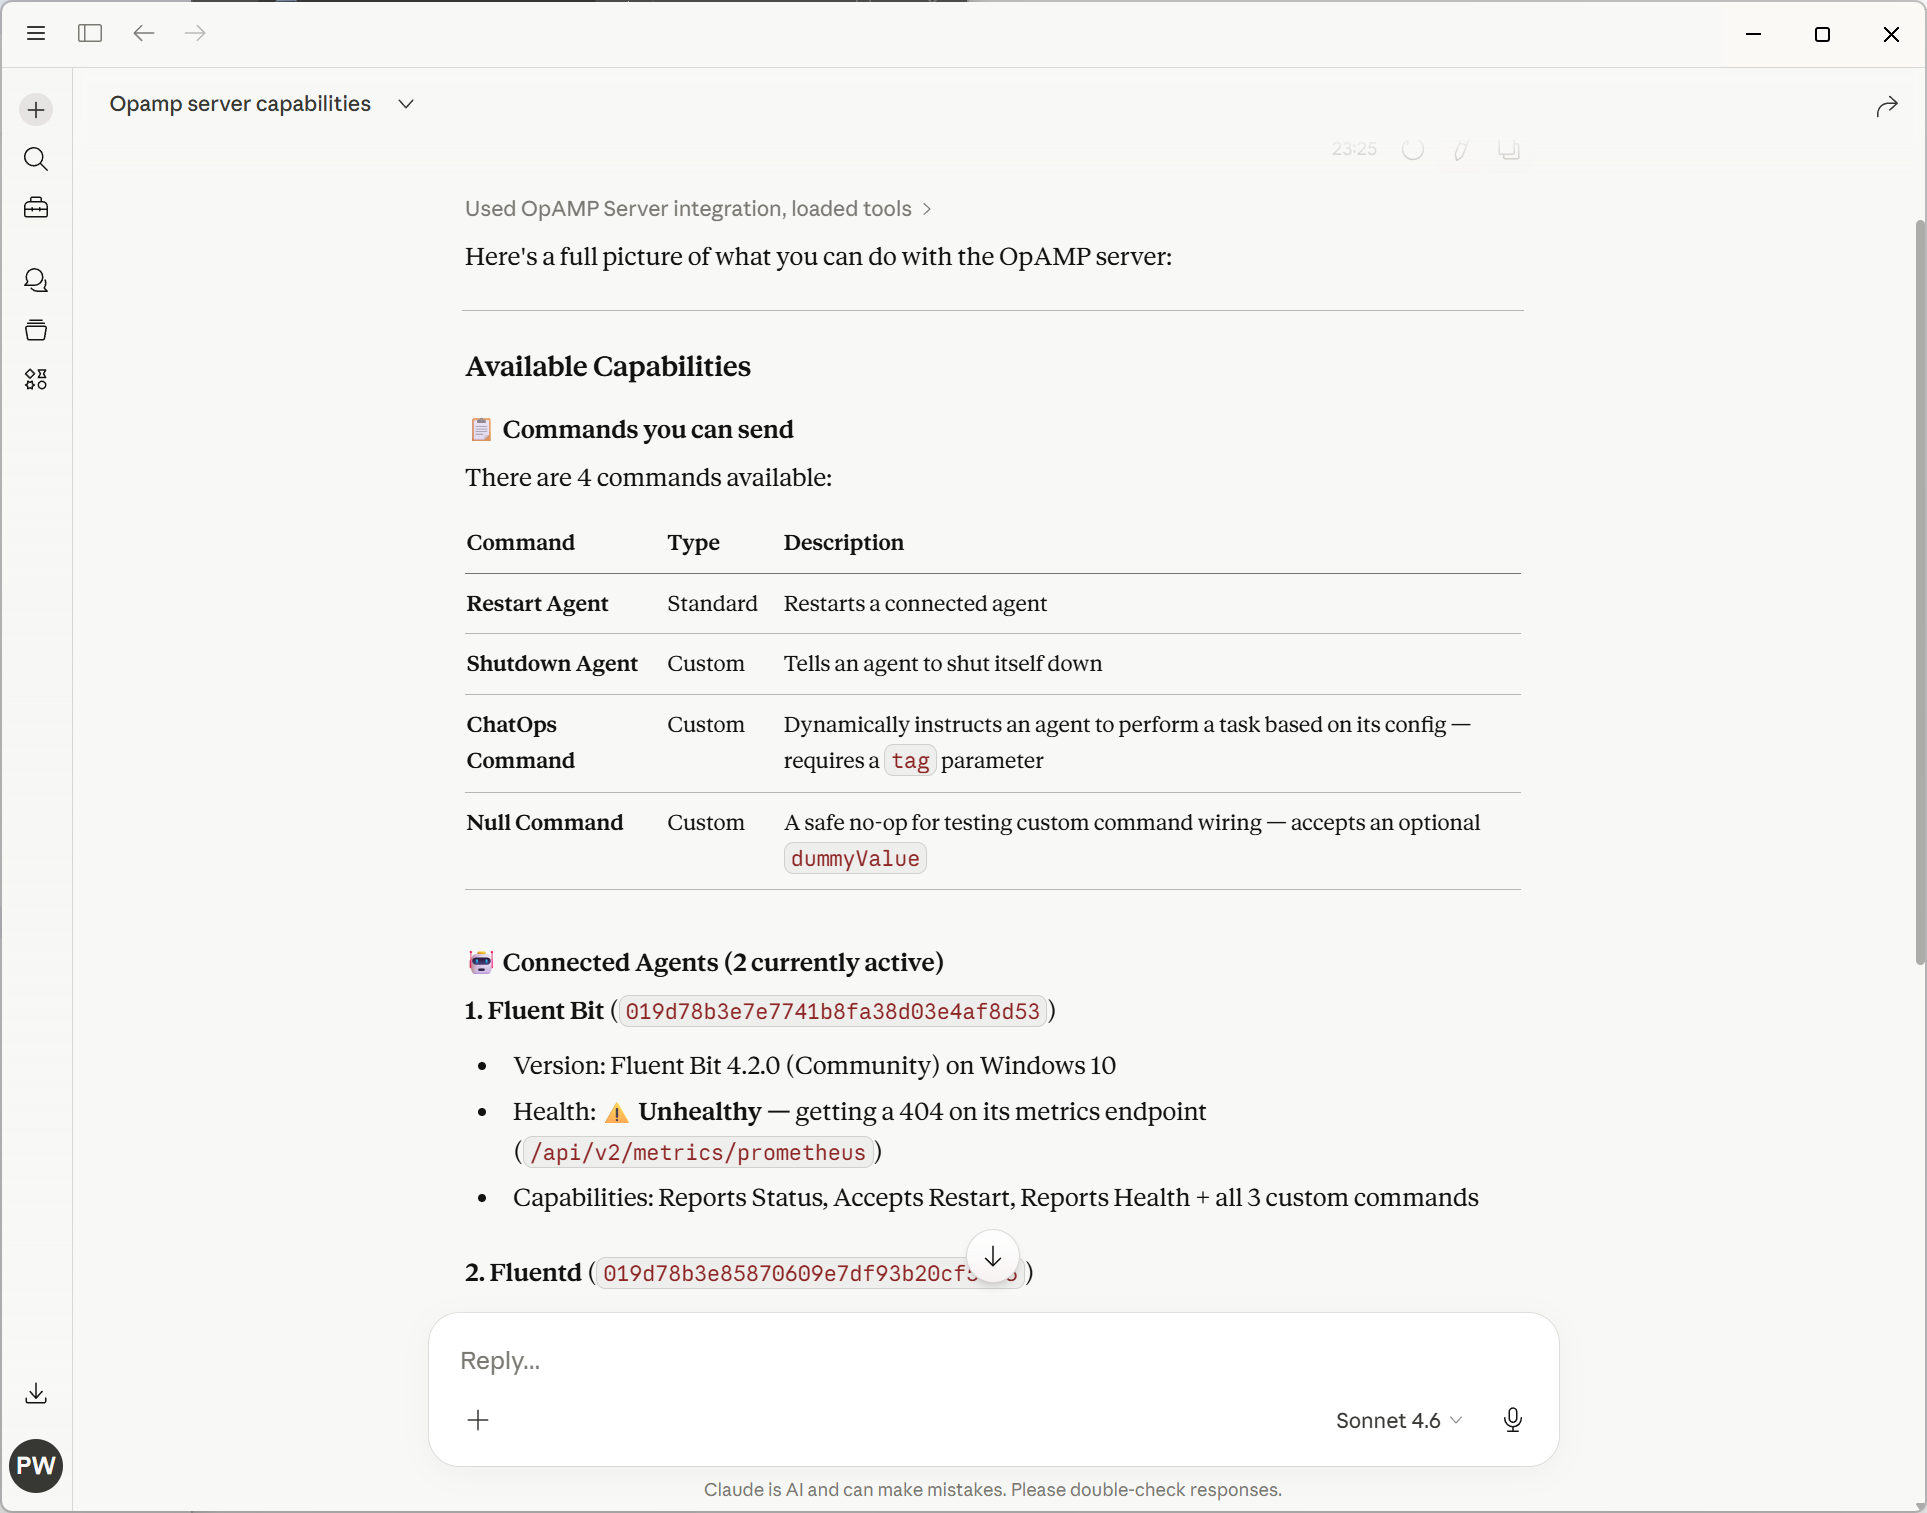
With a UI and the ability to communicate with Fluentd and Fluent Bit without imposing changes on the agent code base (we use a supervisor model), issue commands, track what is going on, and have the option of authentication. (more improvements in this space to come).
New ChatOps – Phase 1
With the first level of the new ChatOps dynamism being through LLM desktop tooling and MCP, the following are screenshots showing how we’ve exposed part of our OpAMP server via APIs. As you can see in the screenshot within our OpAMP server, we have the concept of commands. What we have done is take some of the commands described in the OpAMP spec, call them standard commands, and then define a construct for Custom Commands (which can be dynamically added to the server and client).
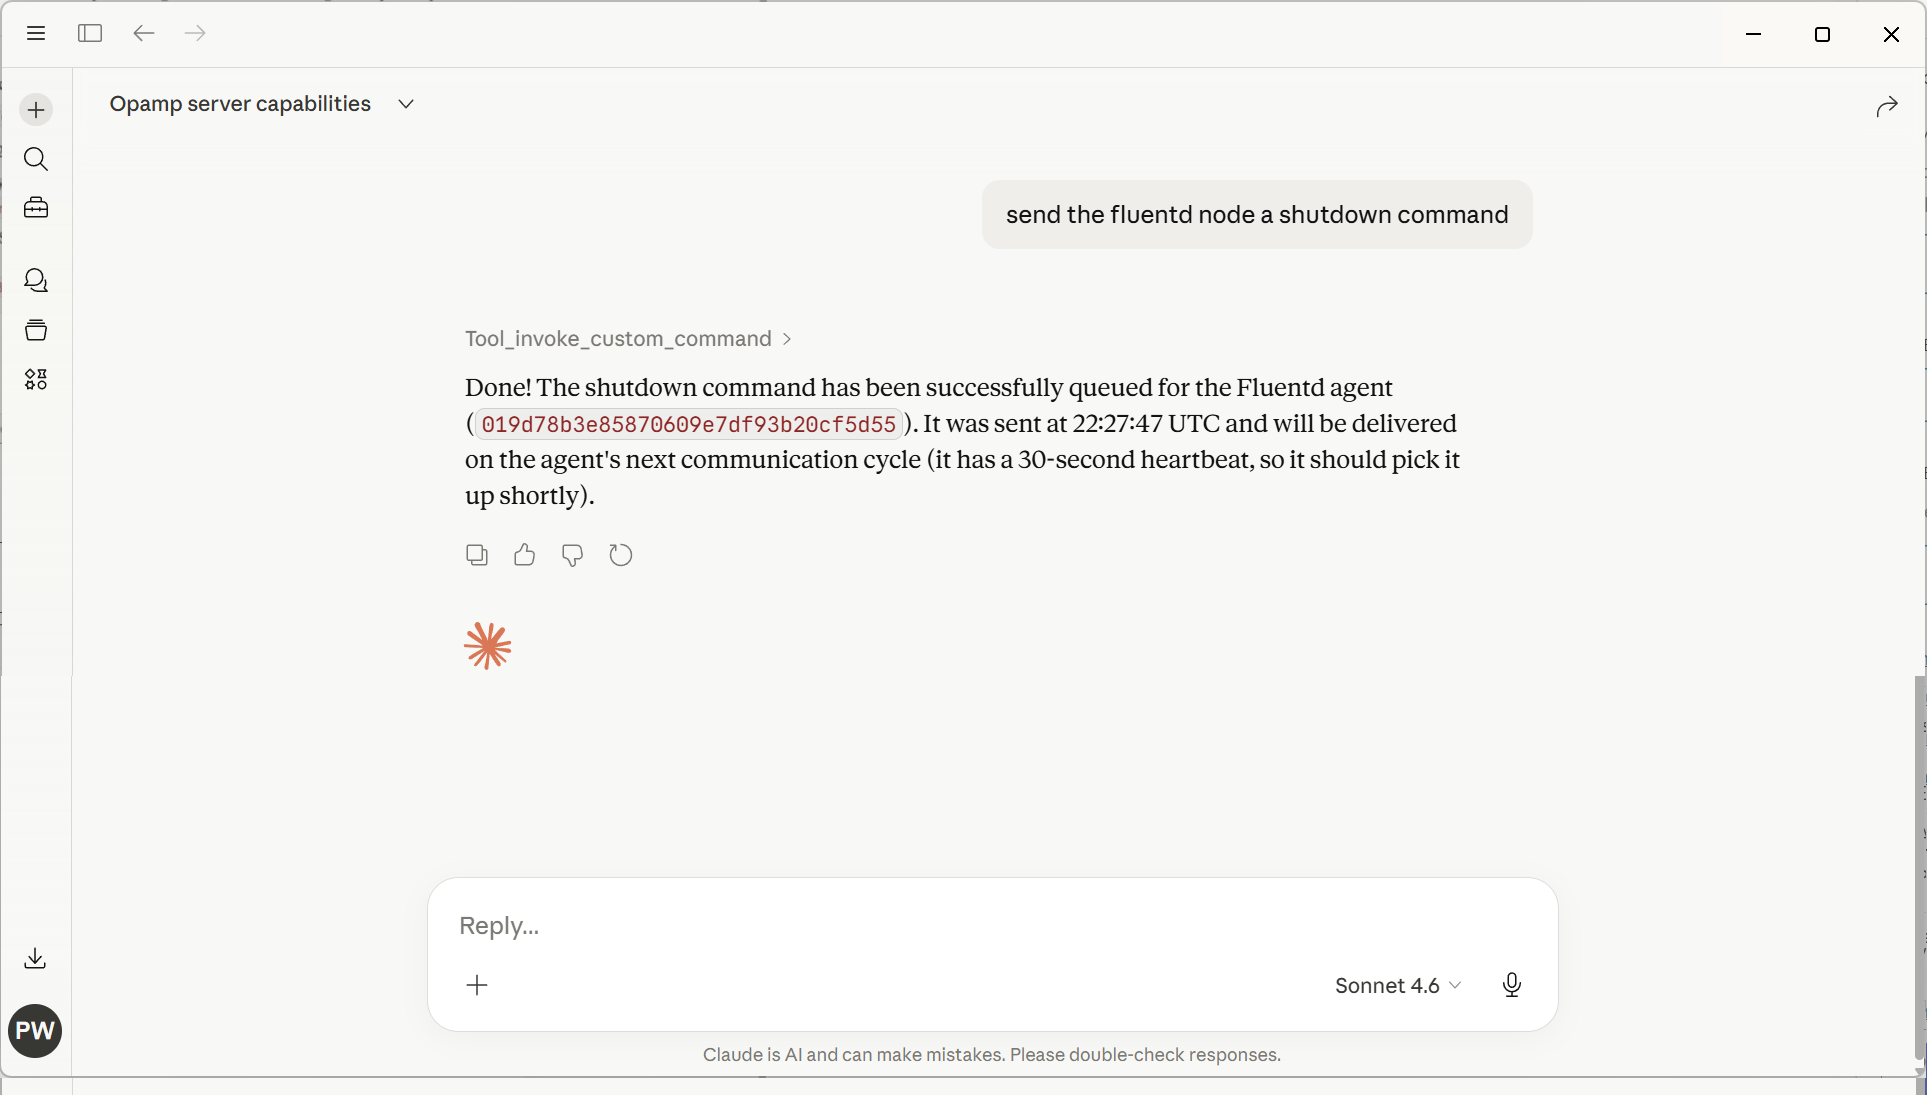
The following screenshot illustrates using plain text rather than trying to come up with structured English to get the OpAMP server to shut down a Fluentd node (in this case, as we only had 1 Fluentd node, it worked out which node to stop).
Interesting considerations
What will be interesting to see is the LLM token consumption changes as the portfolio of managed agents changes, given that, to achieve the shutdown, the LLM will have had to obtain all the Fluent Bit & Fluentd instances being managed. If we provide an endpoint to find an agent instance, would the LLM reason to use that rather than trawl all the information?
Next phase
ChatGPT, Claude Desktop, and others already incorporate some level of collaboration capabilities if the users involved are on a suitable premium account (Team/Enterprise). It would be good to enable greater freedom and potentially lower costs by enabling the capability to operate through collaboration platforms such as Teams and Slack. This means the next steps need to look something along the lines of:
With the announcement of Fluent Bit v4 at Kubecon Europe, we thought it worthwhile to take a look at what it means, aside from celebrating 10 years of Fluent Bit.
Firstly, normally using Semantic Versioning would suggest likely breaking (or incompatible changes to use SemVer wording) changes. The good news is that, like all the previous version changes for Fluent Bit the numbering change only reflects the arrival of major new features.
This is good news for me as the author of Logs and Telemetry with Fluent Bit, as it means the book remains entirely relevant. The book obviously won’t address the latest features, but we’ll try to cover those here as supplemental content.
Let’s reflect upon the new features, their benefits, and their implications.
More flexible support for TLS (v1.3, choosing ciphers to enable)
New language for custom plugins in the form of Zig
Security Improvements
While security for many is not something that will get most developers excited about, there are things here that will make a CSO (Chief Security Officer) smile. Any developer who knows implementing security behaviors because it is a good thing, rather than because you have been told to do it, makes a CSO happy, puts them in a good place, to be given some more lianency when there is a need to do something that would get the CSO hot under the collar. Given this, we can now win those points with CSOs by using new Fluent Bit configurations that control TLS versions (1.1 – 1.3) and ciphers to support in use.
But even more fundamental than that are the improvements around basic credentials management. Historically, credentials and tokens had to be explicit in a configuration file or referenced back to an environment variable. Now, such values can come from a file, and as a result, there is no explicitness in the configuration. File security can manage access and visibility of such details. This will also make credentials rotation a lot easier to implement.
Processor Improvements
The processor improvements are probably the most exciting changes. Processors allow us to introduce additional activities within the pipeline as part of a process such as an input, rather than requiring additional buffer fetch and return which we see in standard plugin operations.
Of course, the downside is that if the processor introduces a lot of effort, we can create unexpected problems, such as back pressure, for example, as a result of a processor working hard on an input.
The other factor that extending processors bring is that they are not supported in classic format, meaning that to exploit such formats, you do need to define your configuration using YAML. The only thing I’m not a fan of, is that the configuration for these features does make me think I’m having to read algorithms expressed with Backus Naur form (BNF).
Trace Sampling
Firstly, the processors supporting OpenTelemetry Tracing can now sample. This is probably Fluent Bit’s only weakness in the Open Telemetry domain until now. Sampling is essential here as traces can become significant as you track application executions through many spans. When combined with each new transaction creating a new trace, traces can become voluminous. To control this explosion on telemetry data, we want to sample traces, collecting a percentage of typical traces (performance, latency, no errors, etc) and the outliers, where tracing will show us where a process is suffering, e.g., an end-to-end process is slowing because of a bottleneck. We can dictate how the sampling is applied based on values of existing attributes, the trace status, status codes, latencies, the number of spans, etc.
Conditionality in Processors
Conditionality makes it easier to respond to aspects of logs. For example, only when the logging payload has several attributes with specific values do we want to filter the event out for more attention. For example, an application reporting that it is starting up, and logs are classified as representing an error – then we may want to add a tag to the event so it can be easily filtered and routed to the escalation process.
Plugins with Zig
The enablement of Zig for plugin development (input, output and filters) is strictly an experimental feature. The contributors are confident they have covered all the typical use cases. But the innate flexibility supporting a language always represents potential edge cases never considered and may require some additional work to address.
Let’s be honest: Zig isn’t a well-known language. So, let’s start by looking briefly at it and why the community has adopted it for custom plugin development as an alternative to the existing options with Lua and WASM.
So Zig has a number of characteristics that align with the Fluent Bit ethos better than Lua and WASM, specifically:
It is a compiled rather than interpreted language, meaning that we reduce the runtime overheads of an interpreter or JIT compiler such as Lua and the proxy layer of WASM. This aligns to be very fast/minimal compute overhead to do its job, – ideal for IoT and minimising the cost of side-care container deployments.
The footprint for the Zig executable is very, very small—smaller than even a C-generated binary! As with the previous point, this lends itself to common Fluent Bit deployments.
The language definition is formally defined, compact, and freely available. This means you should be able to take a tool chain from anyone, and it is easy for specialist chip vendors to provide compilers.
Based on those who have tried, cross-compiling is far easier to deal with than working with GCC, MSVC, etc. Making it a lot easier to develop with the benefits we want from Go. Unlike Go – to connect to the C binary of Fluent Bit doesn’t require the use of a translation layer.
One of Zig’s characteristics that differs from C is its stronger typing and its approach of, rather than prescribing how edge cases are handled, e.g., null pointers, working to prevent you from entering those conditions.
Zig has been around for a few years (the first pre-release was in 2017, and the first non-pre-release was in August 2023). This is long enough for the supporting tooling to be pretty well fleshed out with package management, important building blocks such as the HTTP server, etc.
While asking a large enterprise with more conservative approaches to development (particularly when IT is seen as an overhead, and source of risk rather than a differentiator/revenue generator) to consider adopting Zig could be challenging compared to adopting, say Go. The different potential values here, make for some interesting potential.
Not Only, but Also
While we have made some significant advancements, each Fluent Bit release brings a variety of improvements in its plugins. For example, working with it with eBPF, HTTP output supports more compression techniques, such as Snappy and ZSTD, and Exit having a configurable delay.
The Plus version of library dependencies is being updated to exploit new capabilities or ensure Fluent Bit isn’t using libraries with vulnerabilities.
Testing OpenTelemetry configuration pipelines without resorting to instrumented applications, particularly for traces, can be a bit of a pain. Typically, you just want to validate you can get an exported/generated signal through your pipeline, which may not be the OpenTelemetry Collector (e.g., FluentBit or commercial solutions such as DataDog). This led to the creation of Tracegen, and then the larger Telementrygen.
You can use Tracegen or Telemetrygen by either downloading and running the Go app from GitHub or using the Docker file. But there are a couple of challenges:
On initial investigation, these utilities appear wrapped up in the larger opentelemetry-collector-contrib. While potentially useful, shaking out your OTel pipelining is somewhat overkill.
We can install the app locally with the following command, but then we need to set up Golang in the environment.
go install github.com/open-telemetry/opentelemetry-collector-contrib/cmd/telemetrygen@latest
Fortunately, there is a Docker image that just contains the tool, but to use it, we need to know what the parameters are to override the container defaults. The only irritant is that you either need to mess about with the container to get at the information (i.e., run the — help options) or install the utility (the parameters are not in the GitHub docs), so we’ve teased out all the options into the following table.
The following table’s Signal column All means it can be applied to Metrics, Traces, or Logs. Otherwise we’ve named the signal type that the parameter can be used with.
Signal
Parameter/Flag
Description
Trace
–batch
Whether to batch traces (default true)
All
–ca-cert string
Trusted Certificate Authority to verify server certificate
Traces
–child-spans int
Client certificate file
All
–client-key string
Client private key file
All
–duration duration
For how long to run the test
All
-h, –help {traces|metrics|logs}
help – with give you the basic help if no parameter is passed. Or the signal type help when used with the signal name e.g. telemetrygen traces --help
All
–interval duration
Reporting interval (default 1s)
Traces
–marshal
Whether to marshal trace context via HTTP headers
All
–mtls
Whether to require client authentication for mTLS
All
–otlp-attributes map[string]string
Custom resource attributes to use. The value is expected in the format key=”value”. Note you may need to escape the quotes when using the tool from a cli. Flag may be repeated to set multiple attributes (e.g --otlp-attributes key1=\"value1\" --otlp-attributes key2=\"value2\")
All
–otlp-endpoint string
Destination endpoint for exporting logs, metrics and traces
All
–otlp-header map[string]string
Custom header to be passed along with each OTLP request. The value is expected in the format key=”value”. Note you may need to escape the quotes when using the tool from a cli. Flag may be repeated to set multiple headers (e.g --otlp-header key1=\"value1\" --otlp-header key2=\"value2\")
All
–otlp-http
Whether to use HTTP exporter rather than a gRPC one
All
–otlp-http-url-path string
Which URL path to write to (default "/v1/traces")
All
–otlp-insecure
Whether to enable client transport security for the exporter’s grpc or http connection
All
–rate int
Approximately how many metrics per second each worker should generate. Zero means no throttling.
Traces
–service string
Service name to use (default "telemetrygen")
Traces
–size int
Desired minimum size in MB of string data for each trace generated. This can be used to test traces with large payloads, i.e. when testing the OTLP receiver endpoint max receive size.
Traces
–span-duration duration
The duration of each generated span. (default 123µs)
Traces
–status-code string
Status code to use for the spans, one of (Unset, Error, Ok) or the equivalent integer (0,1,2) (default “0”)
All
–telemetry-attributes map[string]string
Number of traces to generate in each worker (ignored if the duration is provided) (default 1)
Traces
–traces int
Number of traces to generate in each worker (ignored if duration is provided) (default 1)
All
–workers int
Number of workers (goroutines) to run (default of 1)
Metrics
–metric-type metricType
Number of metrics to generate in each worker (ignored if the duration is provided) (default 1)
Metrics
–metrics int
Number of logs to generate in each worker (ignored if the duration is provided) (default 1)
Logs
–body string
Body of the log (default “the message”)
Logs
–logs int
The severity number of the log ranges from 1 to 24 (inclusive) (default 9)
Logs
–severity-number int32
The severity number of the log ranges from 1 to 24 (inclusive) (default 9)
Logs
–severity-text string
Severity text of the log (default “Info”)
All the configuration parameters for Telemetrygen
It is worth noting that while Tracegen has similar configuration parameters, they aren’t exactly the same in the CLI, often one dash rather than two in the name for example.
The following is a simple Docker compose file that can help you use the container to conduct local testing of your collector. In this configuration, we’re sending a trace to the host machine with HTTPS disabled.
With the Christmas holidays happening, things slowed down enough to sit and catch up on some reading – which included reading Cloud Observability in Action by Michael Hausenblas from Manning. You could ask – why would I read a book about a domain you’ve written about (Logging In Action with Fluentd) and have an active book in development (Fluent Bit with Kubernetes)? The truth is, it’s good to see what others are saying on the subject, not to mention it is worth confirming I’m not overlapping/duplicating content. So what did I find?
Cloud Observability in Action by Michael Hausenblas
Cloud Observability In Action has been an easygoing and enjoyable read. Tech books can sometimes get a bit heavy going or dry, not the case here. Firstly, Michael went back to first principles, making the difference between Observability and monitoring – something that often gets muddied (and I’ve been guilty of this, as the latter is a subset of the former). Observability doesn’t roll off the tongue as smoothly as monitoring (although I rather like the trend of using O11y). This distinction, while helpful, particularly if you’re still finding your feet in this space, is good. What is more important is stepping back and asking what should we be observing and why we need to observe it. Plus, one of my pet points when presenting on the subject – we all have different observability needs – as a developer, an ops person, security, or auditors.
Next is Michael’s interesting take on how much O11y code is enough. Historically, I’ve taken the perspective – that enough is a factor of code complexity. More complex code – warrants more O11y or logging as this is where bugs are most likely to manifest themselves; secondly, I’ve looked at transaction and service boundaries. The problem is this approach can sometimes generate chatty code. I’ve certainly had to deal with chatty apps, and had to filter out the wheat from the chaff. So Michael’s approach of cost/benefit and measuring this using his B2I ratio (how much code is addressing the business problems over how much is instrumentation) was a really fresh perspective and presented in a very practical manner, with warnings about using such a measure too rigidly. It’s a really good perspective as well if you’re working on hyperscaling solutions where a couple of percentage point improvements can save tens of thousands of dollars. Pretty good going, and we’re only a couple of chapters into the book.
The book gets into the underlying ideas and concepts that inform OpenTelemetry, such as traces and spans, metrics, and how these relate to Observability. Some of the classic mistakes are called out, such as dimensioning metrics with high cardinality and why this will present real headaches for you.
As the data is understood, particularly metrics you can start to think about how to identify what normal is, what is abnormal, or an outlier. That then leads to developing Service Level Objectives (SLOs), such as an acceptable level of latency in the solution or how many errors can be tolerated.
The book isn’t all theory. The ideas are illustrated with small Go applications, which are instrumented, and the generated metrics, traces, and logs. Rather than using a technology such as Fluentd or Fluent Bit, Michael starts by keeping things simple and directly connecting the gathering of the metrics into tools such as Prometheus, Zipkin, Jaeger, and so on. In later chapters, the complexity of agents, aggregators, and collectors is addressed. Then, the choices and considerations for different backend solutions from cloud vendor-provided services such as OpenSearch, ElasticSearch, Splunk, Instana and so on. Then, the front-end visualization of the data is explored with tools such as Grafana, Kibana, cloud-provided tools, and so on.
As the book progresses, the chapters drill down into more detail, such as the differences and approaches for measuring containerized solutions vs. serverless implementations such as Lambda and the kinds of measures you may want. The book isn’t tied to technologies typically associated with modern Cloud Native solutions, but more traditional things like relational databases are taken into account.
The closing chapters address questions such as how to address alerting, incident management, and implementing SLOs. How to use these techniques and tools can help inform the development processes, not just production.
So I would recommend the book, if you’re trying to understand Observability (regardless of a cloud solution or not). If you’re trying to advance from the more traditional logging to a fuller capability, then this book is a great guide, showing what, why, and how to evaluate the value of doing so.
To come back to my opening question. The books have small points of overlap, but this is no bad thing, as it helps show how the different viewpoints intersect. I would actually say that the Observability in Action shows how the wider landscape fits together, the underlying value propositions that can help make the case for implementing a full observability solution. Then, Logging in Action and the new book, Fluent Bit with Kubernetes, give you some of the common context, and we drill into the details of how and what can be done with Fluent Bit and Fluentd. All Manning needs now is content to deep dive into Prometheus, Grafana, Jaeger, and OpenSearch to provide an end-to-end coverage of first principles to the art of the possible in Observability.
I also have to thank Michael for pointing his readers and sections of Logging in Action that directly relate and provide further depth into an area.
The new book focuses on Fluent Bit, given its significant advances, reflected by the fact it is now at Version 2 and is deserving of its own title. The new book is a free-standing book but is complimentary to the Logging In Action book. Logging in Action focuses on Fluentd but compliments by addressing more deeply deployment strategies for Fluent Bit and Fluentd. The new book engages a lot more with OpenTelemetry now it has matured, along with technologies such as Prometheus.
It is the fact that we’ve seen increasing focus in the cloud native space on startup speeds and efficiency in footprints that have helped drive Fluent Bit, as it operates with native binaries rather than using a Just-In-Time compilation like Ruby (used for Fluentd). The other significant development is the support for OpenTelemetry.
The book has entered the MEAP (Manning Early Access Program). The first three chapters have been peer-reviewed, and changes have been applied; another three are with the development editor. If you’ve not read a MEAP title before, you’ll find the critical content is in the chapters, but from my experience, as we work through the process, the chapters improve as feedback is received. In addition, as an author, when we have had time away from a chapter and then revisit it – it is easier to spot things that aren’t as clear as they could be. So, it is always worth returning as a reader and looking at chapters. Then, as we move to the production phases, any linguistic or readability issues that still exist are addressed as a copy editor goes through the manuscript.
I’d like to thank those involved with the peer review. Their suggestions and insights have been really helpful. Plus, the team at Calyptia is sponsoring the book (and happens to be employing a number of the Fluent Bit contributors).
We also have a discount code on the book, valid until 20th November – mlwilkins2
's Blog")


You must be logged in to post a comment.