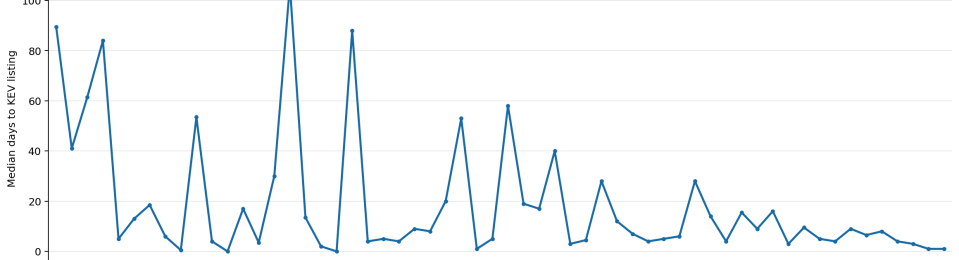
In my previous article about CVEs, we looked at CVE growth. But we didn’t look at the time between detecting a vulnerability and identifying an exploit. The concern is that AI is accelerating not only the number of CVEs and patches, but also exploit creation, shortening the time between a CVE being reported and an exploit becoming available.
The overall trend shouldn’t come as a surprise. Although the spikiness of the data wasn’t so expected. There are a couple of possible explanations for this:
- New exploits occurring that have then been attributed to older CVEs. In some respects, the shrinking fluctuation range says a lot as well; after all, as we find more vulnerabilities, the chances of exploits being linked to a more recent issue increase. Furthermore, if you’re using CVEs to find possible exploits to leverage, a more recent one is better, as targets are more likely to be unpatched.
- The volume of data points is lower, so the median is more easily influenced by outliers.
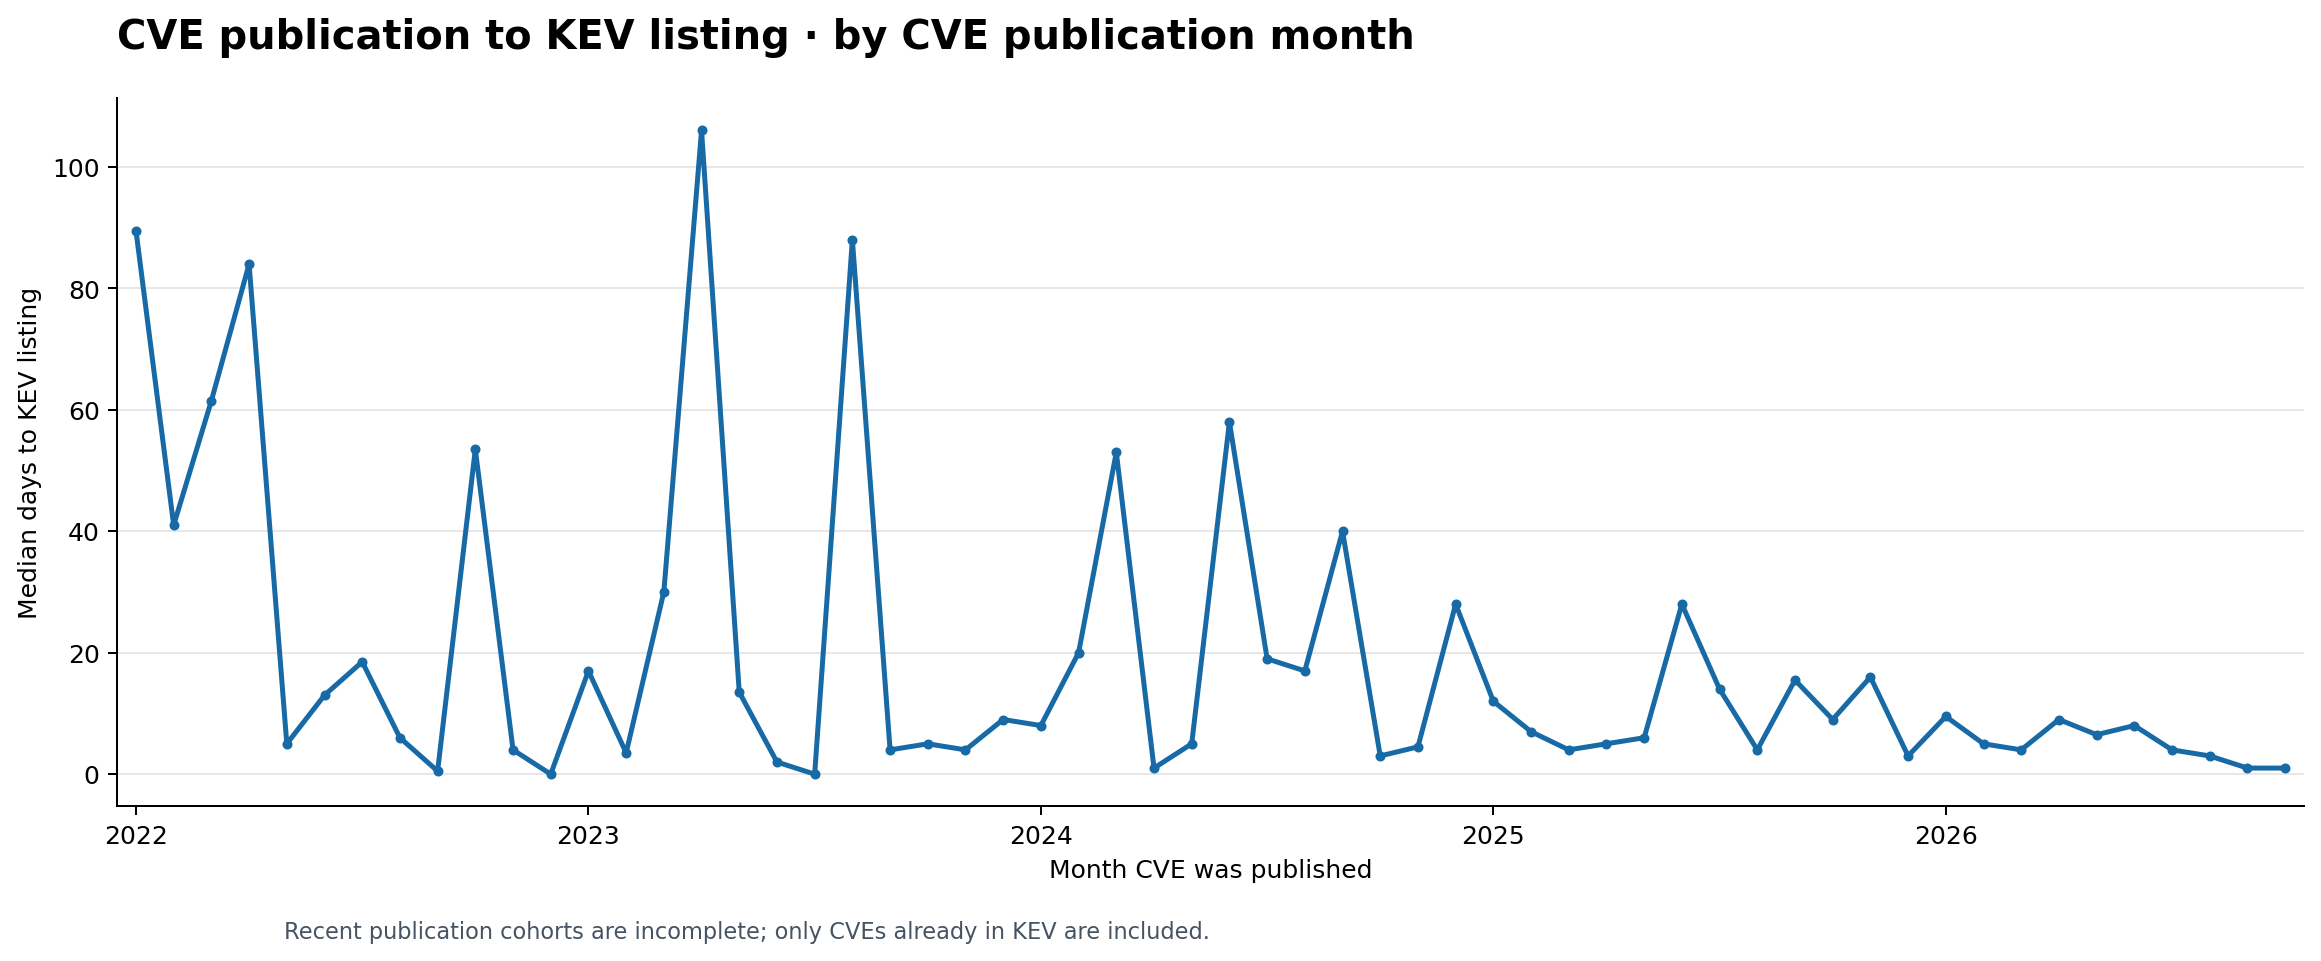
To be transparent, we sourced the underlying data for this graph from a public GitHub repo that curates data from a range of trustworthy sources, from the FBI to CVE.org (more details here). The data also supports vulnerabilitydata.io, which asks big questions like how AI is impacting society.
The plot uses a published monthly dataset that joins CISA’s dateAdded to the official CVE record’s datePublished, groups records by KEV addition month, and excludes CVEs published before KEV launched. Its October 2026 value is partial, based on data fetched on 26 October 2026.
Other data sources
While we’re looking for data, the following sources came up as potentially interesting.
| Source | What it can measure monthly | Published monthly aggregate? | Confidence and limitation |
|---|---|---|---|
| CISA KEV + CVE List | CVE publication → KEV listing | No; dated records support calculation. The plotted third-party dataset publishes monthly medians. | High for the two recorded dates; low if interpreted as time to first exploitation. CISA may list a CVE well after attacks began. GitHub |
| NVD CVE API + CISA KEV | NVD publication → KEV listing | No; NVD provides KEV date filters for building one. | High for recorded dates, but choose either NVD or CVE.org publication consistently: they use different date definitions. NIST |
| VulnCheck exploitation timelines | CVE publication → its earliest recorded exploitation evidence or KEV addition | Annual analyses and record-level data; no verified public monthly aggregate here. | Medium, conditional on access and the evidence behind each record. Its published example calculates intervals from NVD publication to VulnCheck KEV addition. Vulnerability Research |
| Exploit-DB, GitHub PoC repositories, and CIRCL sightings | CVE publication → first dated public exploit or PoC evidence | No verified comprehensive monthly aggregate; join and deduplicate individual records. | Medium to low. A listing or sighting can lag the code’s first publication, and a public PoC does not establish exploitation in the wild. CIRCL explicitly distinguishes these event types. exploit-db.com |
| FIRST EPSS history | Daily changes in predicted exploitation probability | Daily historical scores, but not a date of exploitation or PoC publication. | High for what the score said on a given day; unsuitable as the endpoint for the requested delay. Model changes also affect comparisons across years. first.org |
Conclusion
Regardless of the vulnerability, and an organizations approach to being secure, be that:
- Patching as fast as possible.
- Establish a robust security architecture that provides strong (compensating) controls. In other words, remove or reduce the ability for someone to exploit a vulnerability to a level where the patch cost-benefit formula doesn’t pay.
We need to evaluate the likelihood of exposure as soon as the CVEs are published.


You must be logged in to post a comment.