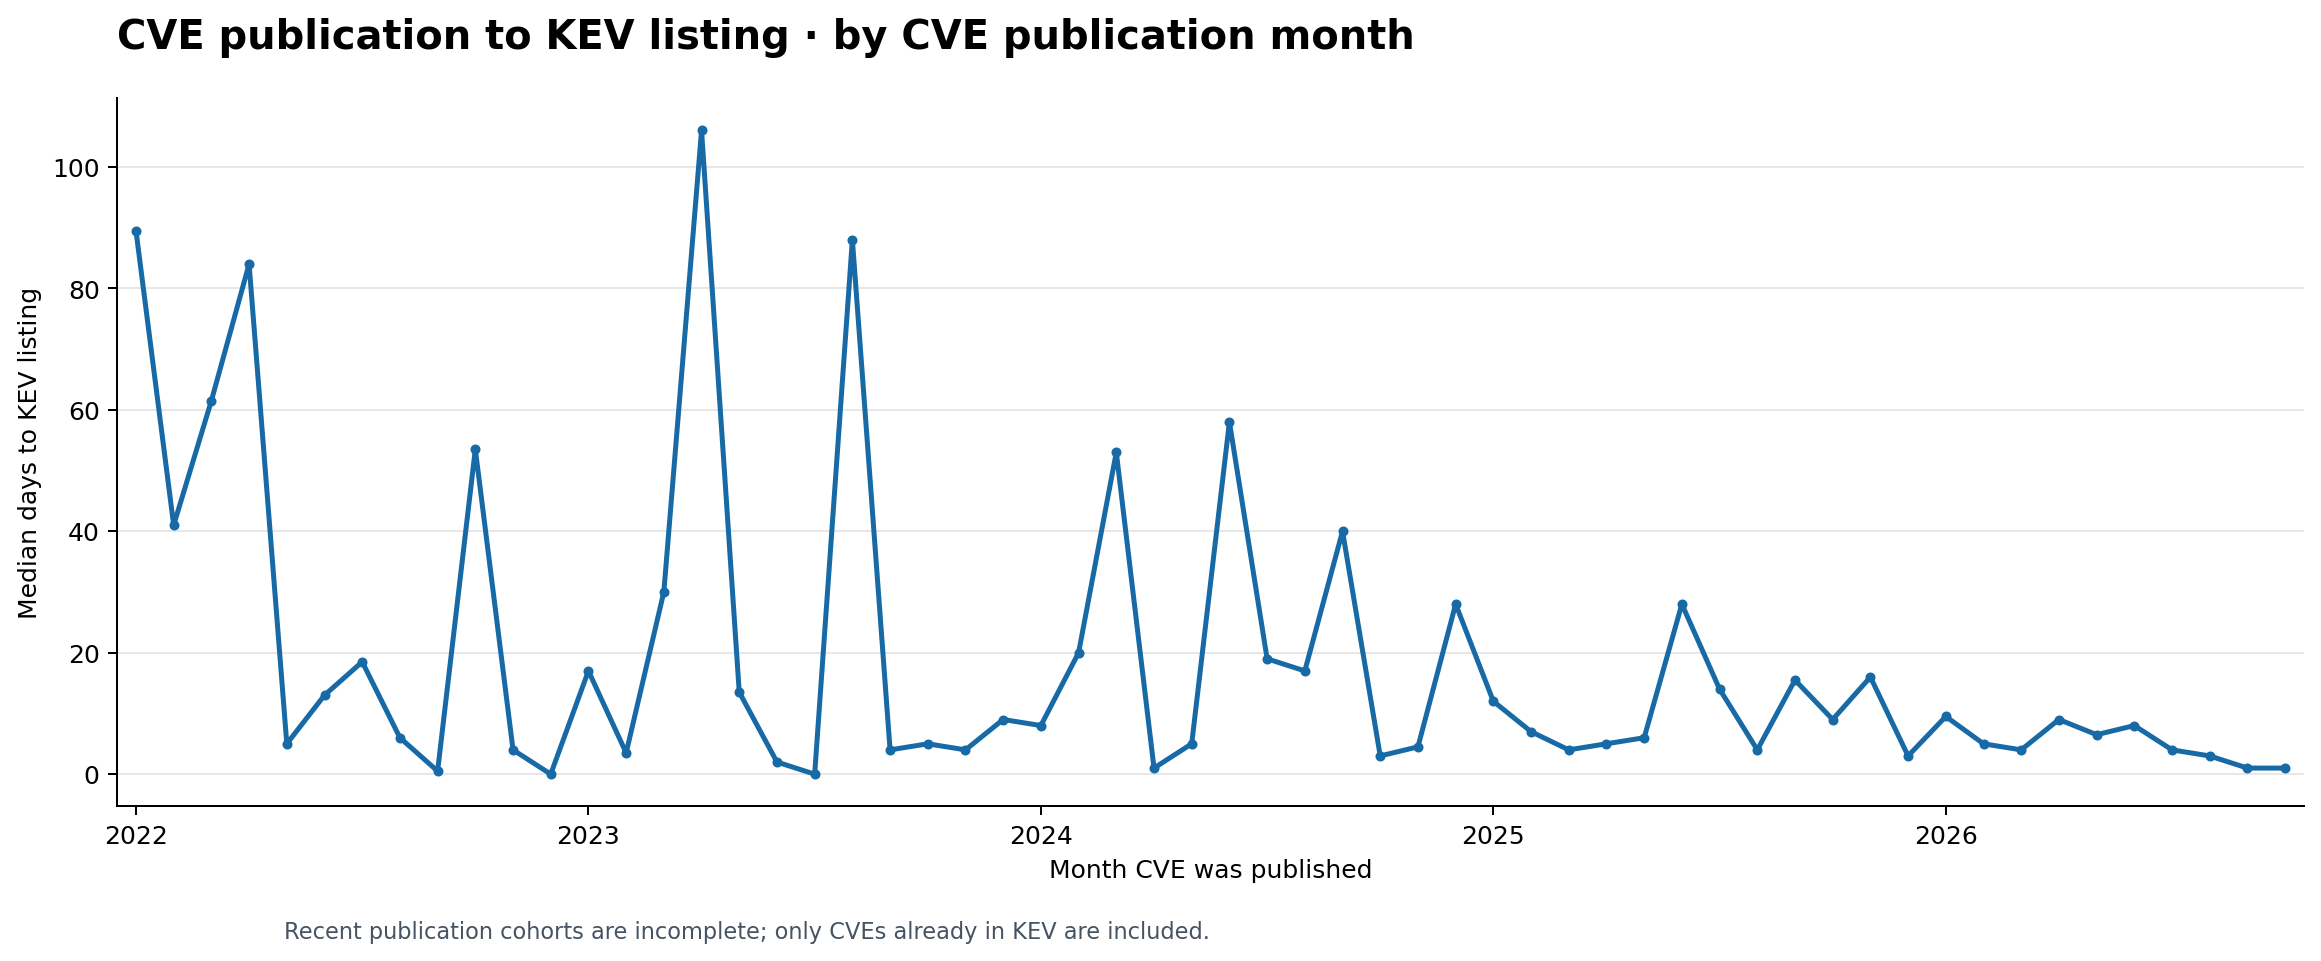
In my previous article about CVEs, we looked at CVE growth. But we didn’t look at the time between detecting a vulnerability and identifying an exploit. The concern is that AI is accelerating not only the number of CVEs and patches, but also exploit creation, shortening the time between a CVE being reported and an exploit becoming available.
The overall trend shouldn’t come as a surprise. Although the spikiness of the data wasn’t so expected. There are a couple of possible explanations for this:
New exploits occurring that have then been attributed to older CVEs. In some respects, the shrinking fluctuation range says a lot as well; after all, as we find more vulnerabilities, the chances of exploits being linked to a more recent issue increase. Furthermore, if you’re using CVEs to find possible exploits to leverage, a more recent one is better, as targets are more likely to be unpatched.
The volume of data points is lower, so the median is more easily influenced by outliers.
To be transparent, we sourced the underlying data for this graph from a public GitHub repo that curates data from a range of trustworthy sources, from the FBI to CVE.org (more details here). The data also supports vulnerabilitydata.io, which asks big questions like how AI is impacting society.
The plot uses a published monthly dataset that joins CISA’s dateAdded to the official CVE record’s datePublished, groups records by KEV addition month, and excludes CVEs published before KEV launched. Its October 2026 value is partial, based on data fetched on 26 October 2026.
Other data sources
While we’re looking for data, the following sources came up as potentially interesting.
CVE publication → its earliest recorded exploitation evidence or KEV addition
Annual analyses and record-level data; no verified public monthly aggregate here.
Medium, conditional on access and the evidence behind each record. Its published example calculates intervals from NVD publication to VulnCheck KEV addition. Vulnerability Research
CVE publication → first dated public exploit or PoC evidence
No verified comprehensive monthly aggregate; join and deduplicate individual records.
Medium to low. A listing or sighting can lag the code’s first publication, and a public PoC does not establish exploitation in the wild. CIRCL explicitly distinguishes these event types. exploit-db.com
Daily changes in predicted exploitation probability
Daily historical scores, but not a date of exploitation or PoC publication.
High for what the score said on a given day; unsuitable as the endpoint for the requested delay. Model changes also affect comparisons across years. first.org
Conclusion
Regardless of the vulnerability, and an organizations approach to being secure, be that:
Patching as fast as possible.
Establish a robust security architecture that provides strong (compensating) controls. In other words, remove or reduce the ability for someone to exploit a vulnerability to a level where the patch cost-benefit formula doesn’t pay.
We need to evaluate the likelihood of exposure as soon as the CVEs are published.
With the explosion in the number of CVEs (Common Vulnerabilities and Exposures) being published, it begs the question as to whether the number of Known Exploited Vulnerabilities (KEV) is trending in the same direction. The natural assumption would be that there be some level of correlation. It took some exploring of data before we started to see any data trends that made sense, and threw up some interesting observations.
Before we look at what we might be able to infer from the data and the patterns we see, let’s start with the looking at the data we’ve sourced and plotted.
Data sources
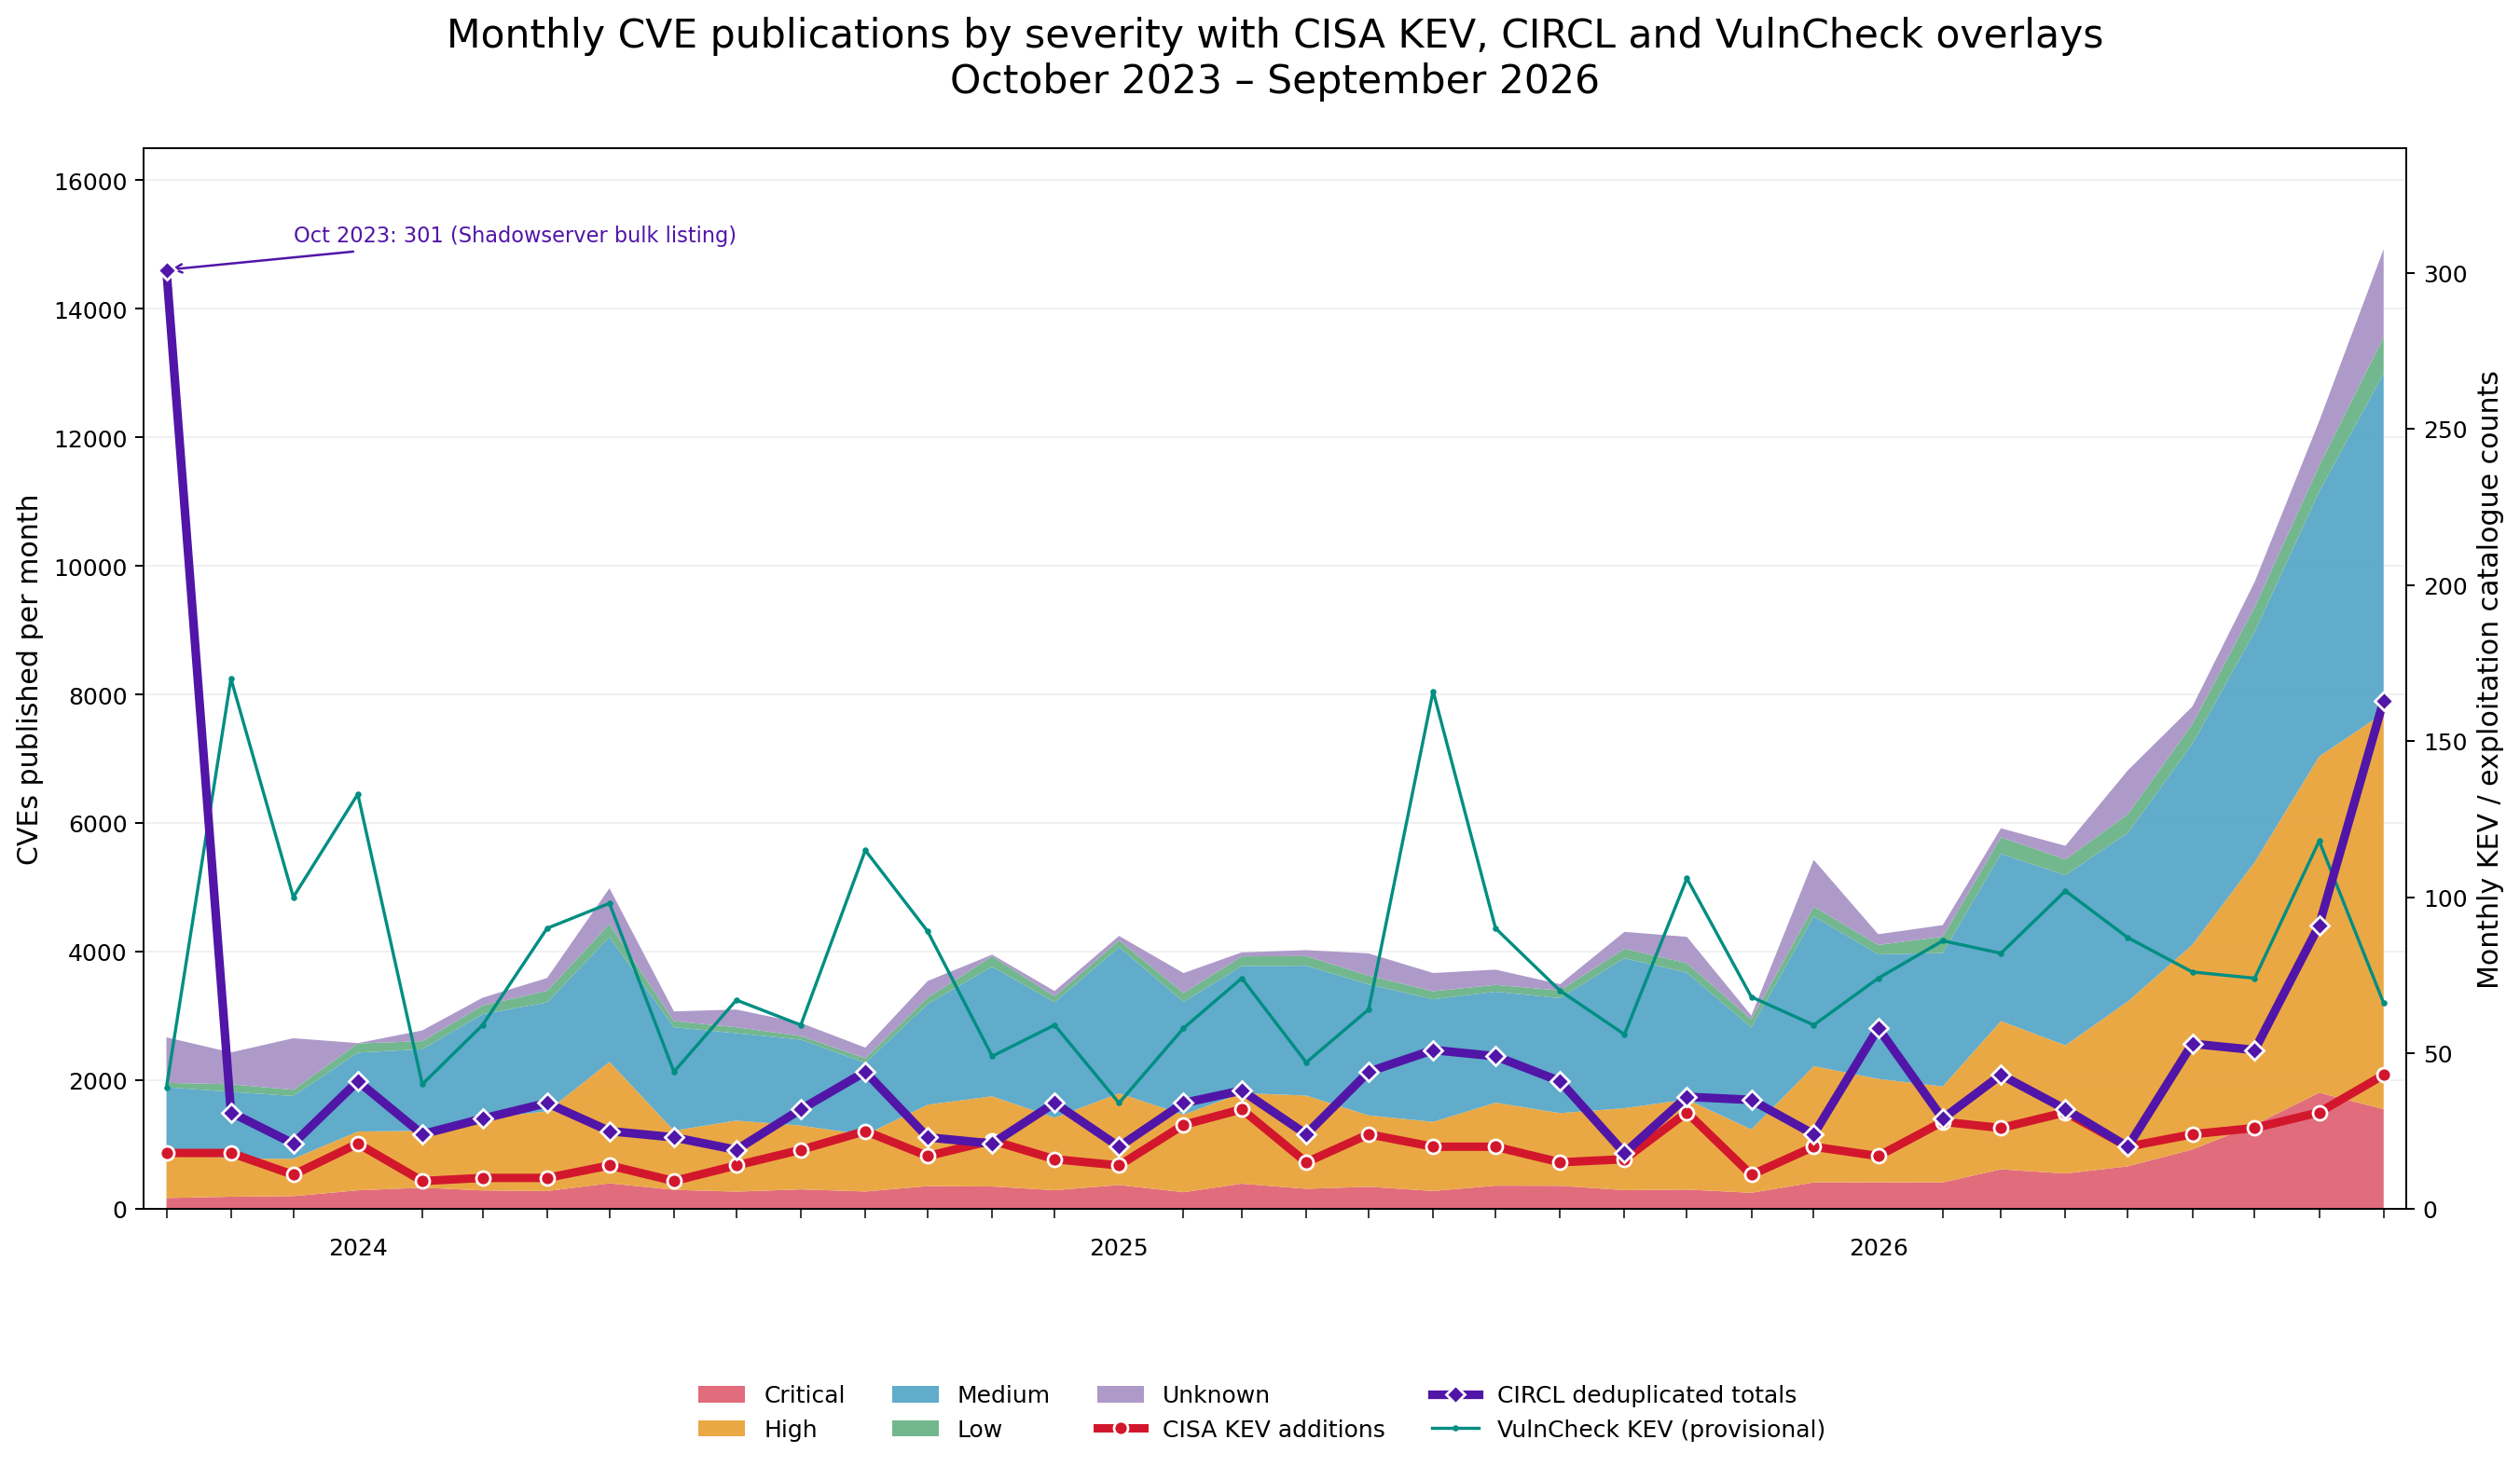
CVE Publications — CRACI / CVE Program: Monthly counts of published Common Vulnerabilities and Exposures (CVEs), categorized by CVSS severity: Critical, High, Medium, Low and Unknown. The data originates from the CVE Program’s official records and is presented as stacked areas to illustrate changes in vulnerability volumes and severity distribution over time. Sources: CRACI CVE Publication Trends | CVE Program GitHub.
CISA Known Exploited Vulnerabilities (KEV): Monthly counts of vulnerabilities added to the US Cybersecurity and Infrastructure Security Agency’s catalogue of vulnerabilities confirmed to have been exploited in the wild. Counts are based on the date vulnerabilities entered the catalogue rather than when exploitation first occurred. Presented as the red line. Sources: CISA KEV Catalogue | CISA KEV GitHub.
CIRCL Vulnerability-Lookup: Monthly deduplicated counts of vulnerabilities recorded across multiple exploitation intelligence catalogues, including CISA, Shadowserver, ENISA, Previdian and CIRCL. By aggregating these sources, it provides broader visibility of known exploitation than any individual catalogue, although counts reflect when vulnerabilities were listed rather than necessarily first exploited. Presented as the purple line. Sources: CIRCL Vulnerability-Lookup | GitHub Repository.
VulnCheck KEV: Monthly counts of vulnerabilities identified as exploited in the wild through intelligence collected from security researchers, vendors, incident investigations and other publicly available evidence. VulnCheck provides an additional perspective beyond CISA, although its reporting volumes may be influenced by changes in intelligence coverage and retrospective discoveries. Presented as the thinner teal line, with the monthly figures currently treated as provisional pending independent validation. Sources: VulnCheck | Exploit Intelligence Documentation.
Understanding the data
Spikes in KEV data and varying sources
We have seen (and it is visible in our graph that the different sources of KEV data tend to show early spikes, typically triggered when the catalogue is being populated with retrospective data. We initially started looking at individual reporting sources such as VulnCheck thinking that they would give a true figure and the aggregated reporting data such as CIRCL would provide amplified patterns. The opposite appeared to be the case. We’ve kept the VulnCheck and CISA KEV reporting help illustrate this. Where Vulncheck’s spiking tend to be dramatic compared where CIRCL might show a small uptick, but then in the last quarter of 2025 we start to see opposing trends. It appears that CIRCL’s aggregation of sources has smoothed out the fluctuations. CISA’s KEV numbers in comparison a notably different in volume to VulnCheck. The CISA numbers generally follow the same pattern as CIRCL until 2026 – with the worst divergence 50 exploitations identified rather than the triple digit variance of VulnCheck.
Critical and High CVE fluctuations
If you look carefully and the CVE trends in the different categories, while there is clearly an acceleration in the last 12 months (which we could attribute to initiatives such as GlassWing) if you look carefully, you’ll notice that the growth in Severe and High scoring CVEs is growing faster. It is only two dates, but this table supports the observation:
Severity
September 2025
September 2026
Growth
Critical
295
1,555
+427%
High
1,275
6,160
+383%
Medium
2,331
5,285
+127%
Low
148
564
+281%
Unknown
263
1,366
+419%
Total
4,312
14,930
+246%
The telling difference is if you compare the total growth against the growth numbers and the individual severity growth numbers. The critical numbers have multiplied by nearly 1.75.
Exploits (KEV) appear to be tracking vulnerabilities (CVE)
Perhaps the most important, point in the data is that based on the aggregated CIRCL counts, exploits are following the upward trend with a bit of lag which fits what thought we’d see. Yes at this point we’re are mindful that this could be finding data that supports a hypothesis (particularly given other individual KEV numbers may not support the trend). But on balance I’m inclined to trust the CIRCL numbers because if other numbers are erratic we’d not see such a similar upward track.
How is patching performance responding?
Keeping up with patching is likely to prove challenging, the 2026 Edgescan report picks out a rather telling observation, which supports the problems of not keeping up:
The most striking insight is that vulnerabilities from 2025, 2023, and 2024 account for more than 50% of all occurrences, indicating that newly published or recently discovered issues are the primary drivers of risk this year.
The suggestion is that the really high profile vulnerabilities get addressed, but the progress to address those that don’t get the notoriety is weaker. The alternative possibility relates not on individual exposures but when failures grab the headlines that attention turns back to patching. Another indicator that patching can’t keep up is the Verizon 2026 DBIR reported 26% of CISA KEV vulnerabilities fully remediated in its analyzed population versus 38% in the prior report, with median full remediation time increasing from 32 to 43 days (assuming Verizon’s dataset is representative).
Conclusion
While this is not an exhaustive analysis, it would be fair to treat it as anecdotal evidence to indicate:
CVE acceleration is being followed by KEV acceleration – possibly the most concerning.
If historic data shows we can’t keep up with patching, then its only going to get worse – supporting the expectation of climbing KEVs.
We do therefore need to look to adopt differing strategies to protect ourselves, and new measurements to reflect whether the new approaches are paying dividends. So what can we do differently, and I’m not saying don’t patch, I’m saying if you have a finite patching capacity, use it wisely, and invest in actions that give you the best vulnerability reduction.
Steps
Patching is by its very nature after the horse has bolted, this is why we have zero day exploits. The bottom line is there will always be vulnerabilities, the question is who finds them first and how do we react. Perhaps an exceptional illustration is the Apollo 11 Guidance Computer 1201 and 1202 errors (more about this and other aspects of the Apollo program at Apollo 11 Journals, the BBC also have an excellent podcast – 13 Minutes to the Moon that broke this down). This essentially was a memory overload error (should sound familiar as it is an attack vector, only difference is the overload was innocent for Apollo 11). The lesson is, the ground crew had encountered various issues during training, so put operational processes in place to allow them to quickly determine cause and action. Just as with modern businesses, the lunar programme could not be stopped to create months to rework Apollo’s software to avoid the issue, so they ensured there are what we might call compensating controls – a manual ground crew process that could tell Armstrong and aldrin what to do.
Continuing compensating controls, is not to have reactions ready, but also preventing attacks from reaching vulnerabilities. For example Oracle’s WebLogic Server has some CVEs around its T3 protocol. If you’re not using this as a communication channel between severs you can switch it off in the configuration. Better still, put those servers within a subnet with network security rules that prevent T3 traffic from getting into the subnet. There are multiple CVEs for T3 – so rather than patching everyone one of them, you’ve prevented the exploit from being usable by anyone other than someone having been able to get into that subnet.
The next upside of such a control is that even if the T3 vulnerability was exploited, the ‘blast radius’ is constrained, as the network configuration will make it a lot harder to move to other servers as first they need to find away to see beyond the local network. This brings another philosophical change which doesn’t have to be difficult to achieve. We always look at security on the inbound traffic – but we should be just as observant about outbound paths, and have controls. One very contemporary aspect of this is to put gateways between applications or agents and LLMs. The focus is that credentials to external tools and services are only introduced beyond the sphere of the LLM(s). But we can also prevent the LLM from being hijacked into abusing tools (from the LLM view point it is an inbound security control). But we should treat all outbound data this way. Its the fastest way to detect and stop data egress.
It doesn’t need a chaos monkey but …
Many will have over the years heard about the development of the chaos monkey at Netflix by Greg Orzell which is a small app that can be unleashed and will try to tear everything up. While this maybe seen as rather extreme, the underlying message is once its secured, don’t assume it remains secure (controls can be accidentally removed). Put basic security probes into the environment – you can test non-destructively. Don’t put a procedure in place and let is rot on a shelf, if you have capacity – fail things over. The more these sorts of processes a run, the more it becomes ‘muscle memory’ and while early iterations will be painful, that pain and cost will be minor to when it happens for real.
It isn’t if, but when …
We all like to think these things won’t happen to us, and we’re prepared. But worldwide 1 in 5 will have cancer in their lifetime. Many cancers are treatable, and largely routine – because the medical profession have had to treat the problem over and over. We just have to see IT attacks in the same manner.
A lot of developers are focused on CVEs, as we need to know does the library, language or other building block I use to create a solution have an identified vulnerability that needs mitigating? We probably also pay attention to OWASP (Open Worldwide Application Security Project). But CVEs and OWASP aren’t the beginning and end of the story. This a larger ecosystem of standards involved.
CWE (Common Weakness Enumeration) is of particular interest if you get a chance to step back from fire fighting CVEs. This is interesting because, rather than addressing individually identified vulnerabilities, like the OWASP Top 10s, it looks at a classifies the vulnerabilities. When you get down the Base and Variant categories we’re into specific details. This is helpful, as classifying our CVEs against CWE can tell us the technical domains where the maximum effort can return the greatest level of mitigation/remediation of CVEs (be that creating a patch or defining a mitigation strategy).
I was going to sketch out the relationships between the key standards, but realized an LLM can do a better job, so here is a visual summary:
With so many TLAs in the diagram, here is a quick reference pulled together (including from my own library of handy links).
CWSS is a CWE-related scoring method for prioritising software weaknesses, but the older version referenced by MITRE is marked obsolete. (Common Weakness Enumeration)
Scores weaknesses, not CVE vulnerabilities; largely secondary compared with CVSS in current vulnerability workflows.
CVSS v4.0 is the current major CVSS standard family used to express vulnerability severity with base, threat, environmental and supplemental metrics. (FIRST Forum) (Forum of Incident Response and Security Teams)
Maintained by FIRST; it scores vulnerabilities but does not allocate vulnerability IDs. Defines the scoring structure/ranking scale, not ID allocation.
CVD is the process of coordinating information among finders, vendors and other stakeholders before public disclosure and mitigation communication. (CERT Coordination Center)
Process framework around disclosure; not itself an ID system.
SWID tags are ISO/IEC 19770-2 software identification files that can support software asset, patch and vulnerability management. (NIST Computer Security Resource Center)
Product identification standard related to CPE-style inventory matching.
OSV provides a machine-readable vulnerability format and database that maps open-source vulnerabilities precisely to package versions or commit hashes. (OSV)
Adjacent vulnerability-data ecosystem, especially useful for open-source dependency scanning.



You must be logged in to post a comment.