We’ve made the latest version of our implementation of the OpAMP specification available. It has taken longer to ready than the previous versions, but there is a lot been included, both in the core functionality, but also capabilities supporting the use and setup. Here are the headlines…
Automated regression from clean to deployed and running a series of end-to-end tests as well as producing a guaranteed fresh set of artefacts has been implemented. This can be run against AWS (currently in use) or Azure (needs refining). These are triggered on changes to the main branch.
GitHub pages with links all the documentation are established now.
The Python wheel release artefacts are no incorporated into the release assets.
The client/consumer side has been refactored so it is easy to build your own observability agent controls and independently deploy them (not supported by the config editor).
The CLI has been enhanced so it can help quickly spin up more advanced configurations – helpful for demos and real deployments.
The Dev CLI has been improved.
The server side now has a basic client side (Supervisor/Observer) configuration editor UI. Which can be deployed as a plugin.
Improvements around the use of Podman and Docker for the containerization.
What next?
We’ve added to the documentation pages for the roadmap, initially we’re working to fill out the regression test sets at the moment. Other possibilities:
Expand the client types
Extend the client types to exploit more features.
Perhaps the most interesting idea, we’re thinking about is can we exploit tools like Netdata to discover what solutions are deployed and generate a requirements/configuration definition which can be used to generate a suitable agent configuration file.
Observability is usually looked at from the perspective of applications and their needs and the cloud native platforms. Nothing wrong with that, but it is also a rather narrow view of the telemetry we are already collecting or are very capable of collecting. Our observability agents (Fluent Bit, Fluentd, Elastic Agent …) can collect signals (logs, metrics and traces) that can contribute to the security operations within an enterprise. More importantly, the same open-source tooling can help answer a deceptively simple question such as has someone changed the system, or changed the tooling that tells us what the system is doing?
When it comes to security, that second part matters. An attacker does not always need to exploit a new vulnerability. If they can alter a service definition, scheduled task, access-control file, logging configuration or telemetry destination, they can prevent us from sensing what damage they maybe doing, including opening up simpler or more invasive routes into your systems. MITRE ATT&CK describes this kind of action as a defence-evasion technique. Research from Palo Alto Networks Unit 42 has also described cloud logging services as an attack surface, including changes that stop, redirect or selectively reduce audit collection. Not only that getting at logs, means they can potentially determine when systems that are running, and find new attack vectors.
As you can see being able to detect configuration and file manipulation is an important factor for security. Many may react to this with concern about introducing cost for expensive security tools, but if there are simple means to listen to OS activities that relate to file manipulation then we can leverage our observability estate for this aspect of security.
The wider open-source stack
That neutrality for our observability agents is valuable for security. A host or cluster can emit operational and security telemetry through the same managed pipeline, while routing data to one or more destinations such as OpenSearch, Loki, ClickHouse, a SIEM, object storage or an OTLP-compatible service. Not to mention if the event is for an application configuration, we can evaluate it against application and service viewpoints such as managing configuration drift.
The roles are complementary:
AIDE is a open-source Linux utility that provides the file-integrity check. It builds a known-good database and reports additions, removals and changes to selected files and attributes. Aide achieves this through the use of the iNodes API, which if you preferred could also be tapped into even more directly.
Fluent Bit or other OTel compliant tools collect the result close to the workload, adds context, buffers during a network interruption and routes the event. Our backend services which are in all likelihood OTLP capable, means the events can be send nearly anywhere for analysis and alerting
The analytical backend correlates the integrity event with logins, process starts, deployments, traces and other activity, then drives an alert or investigation.
AIDE is deliberately focused. It does not need to become a SIEM and Fluent Bit does not need to become a file-integrity engine. Combining small tools through open interfaces lets each component do the job it is good at.
We can use Aide not only to monitor our configurations, but when the deployed binaries are disturbed. We can extend this setup further. By exploiting custom commands with OpAMP (particularly for a supervisor) can be used to not only manage the observability agent, but also manage the deployment of configuration to tools like Aide. Now if we think something is being abused, the option to change our file integrity monitoring is easily in our reach.
Why file integrity belongs in the observability conversation
The available incident statistics do not normally include a neat category called “configuration-file manipulation”. The behaviour is spread across techniques such as creating or modifying system processes, scheduled tasks, startup mechanisms, accounts, policies and logging controls. That makes a single adoption or attack percentage difficult to defend. It does not make the risk rare.
For example, Google Cloud’s M-Trends 2025 reporting included techniques such as Create or Modify System Process (20.6%), Account Manipulation (19.9%), Scheduled Task/Job (14.3%), Registry Run Keys/Startup Folder (11.5%) and Web Shell (7.2%) among observed investigations. These are broader ATT&CK behaviours, not a count of configuration-file changes, but many are enabled or persisted through changes to system configuration.
There is also a compliance driver. PCI DSS v4.0.1 Requirement 11.5.2 explicitly requires a change-detection mechanism, such as file-integrity monitoring, for critical files, with comparisons at least weekly and alerts for unauthorised modification. NIST SP 800-53 Revision 5 control SI-7 requires monitoring for unauthorised changes to software, firmware and information. Other standards may describe the required outcome as configuration control, integrity, audit protection or system monitoring rather than naming a particular product.
FIM helps provide the evidence behind those outcomes:
what changed;
which host or workload reported it;
when the change was detected;
which attributes or content hashes changed;
whether a change matched an approved deployment window;
whether the alert was acknowledged and investigated; and
whether the integrity baseline was updated through a controlled process.
The last point is easily overlooked. Automatically accepting every change into the baseline produces a very tidy report and a very weak control.
What should be monitored?
Starting with every file on every host usually creates cost and noise. I would start with the files that can change control flow, identity, collection or evidence retention:
Fluent Bit configuration, parser files and included fragments;
Vector configuration and transformation definitions;
OpenTelemetry Collector configuration;
systemd units and drop-ins for telemetry agents;
log rotation and retention configuration;
TLS trust stores, client certificates and references to credentials;
auditd, syslog and journald configuration;
scheduled tasks, startup scripts and authorised SSH keys;
alert rules, dashboards and detection content managed as files; and
the AIDE configuration and baseline database itself.
Runtime state, offset databases, buffers and normal log files should normally be excluded. They are expected to change and monitoring them obscures the files that should remain stable.
There is an architectural wrinkle: if AIDE reports through Fluent Bit, and an attacker changes both AIDE and Fluent Bit, the local signal can be suppressed. The practical response is defence in depth. Restrict write access, ship events off-host quickly, monitor the agent configuration and service unit, protect or sign the AIDE baseline, and alert when expected heartbeats or scheduled check results disappear. Silence is also a signal.
Example: AIDE reporting through Fluent Bit and OTLP
The following is a starting point rather than a universal production configuration. Package paths and AIDE defaults differ between Linux distributions, so it should be merged with the supplied configuration rather than replacing it blindly.
First, add an AIDE rule group for the observability configuration. For example, in /etc/aide/aide.conf.d/observability.conf:
# Permissions, inode, links, ownership, size, timestamps and SHA-256 content.
# These are runtime data and should not be treated as static configuration.
!/var/lib/fluent-bit
!/var/lib/vector
!/var/lib/otelcol
!/var/log
The main AIDE configuration can direct its report to a file that Fluent Bit is permitted to read:
database=file:/var/lib/aide/aide.db.gz
database_out=file:/var/lib/aide/aide.db.new.gz
gzip_dbout=true
report_url=file:/var/log/aide/aide.log
report_level=changed_attributes
Initialise and approve the baseline using the procedure provided by the operating-system package. The baseline database should be writable only by the account performing the controlled update; consider retaining a signed or read-only copy outside the host.
Run aide --check from a systemd timer or the organisation’s scheduler. An hourly check provides better detection latency than the weekly minimum stated by PCI DSS, although the right frequency depends on estate size, I/O cost and risk. The scheduler should also emit a success or failure event so that a missing check can be detected.
Fluent Bit can then tail the report, add security context and forward the records over OTLP. The Tail input uses a database to retain offsets, and the OpenTelemetry output supports OTLP/HTTP and OTLP/gRPC.
service:
flush: 5
log_level: info
storage.path: /var/lib/fluent-bit/storage
pipeline:
inputs:
-name: tail
tag: security.fim.aide
path: /var/log/aide/aide.log
key: body
path_key: log.file.path
db: /var/lib/fluent-bit/aide-tail.db
db.sync: normal
read_from_head: false
refresh_interval: 5
rotate_wait: 30
skip_empty_lines: true
skip_long_lines: true
storage.type: filesystem
filters:
-name: modify
match: security.fim.aide
Add:
- event.domain file
- event.category file
- event.type change
- security.control file_integrity
- service.name aide
outputs:
-name: opentelemetry
match: security.fim.aide
host: otel-collector.internal
port: 4318
logs_uri: /v1/logs
tls: on
tls.verify: on
compress: gzip
This example emits each AIDE report line as a log record. That is simple and robust, but the backend will need to group lines belonging to the same check. For a more mature deployment I would place a small wrapper around the AIDE invocation that converts each detected change into JSON Lines and adds a check identifier, hostname, baseline version and execution result. Fluent Bit can then use its JSON parser and every changed file becomes a structured event.
Vector can implement the same pattern with its file source and an OTLP-capable destination or intermediate Collector. The OpenTelemetry Collector can also collect files using the contributed filelog receiver. The choice is less important than applying consistent fields, reliable buffering, secure transport and an independently managed destination.
From event collection to a security control
Collecting the AIDE output is only the first half of the solution. To turn it into a control, the backend needs useful detection logic and operational ownership.
I would start with alerts for:
a change to an observability agent destination, filter or exclusion rule;
a change to a telemetry service unit or executable;
deletion or replacement of the AIDE database;
changes outside an approved deployment window;
a burst of changes across several hosts;
a configuration change followed by a fall in log volume; and
a missing AIDE run, agent heartbeat or expected integrity summary.
Correlating the FIM event with deployment records is important. A checksum change shortly after an approved GitOps rollout is very different from the same change following an interactive root login at 02:00. Observability provides the surrounding evidence that allows the integrity event to be assessed rather than simply counted.
There is also value in feeding an integrity event back into operational telemetry. A changed collector configuration can annotate dashboards, traces and incident timelines. The question changes from “why did the logs stop?” to “did the logs stop when this configuration changed?” That is a much better starting point for both an SRE and a security analyst.
Final thoughts
The observability and security domains have spent years building separate pipelines for data that frequently starts on the same machine. Open standards and focused open-source tools give us an opportunity to reduce that duplication.
AIDE supplies a mature integrity signal. Fluent Bit and Vector make that signal transportable and enrichable. OpenTelemetry makes the route to the wider platform portable. None of these components replaces access control, endpoint detection or a SIEM, but together they add a useful security capability to infrastructure many organisations already operate.
Perhaps the most important configuration to observe is the configuration that decides what we are allowed to observe.
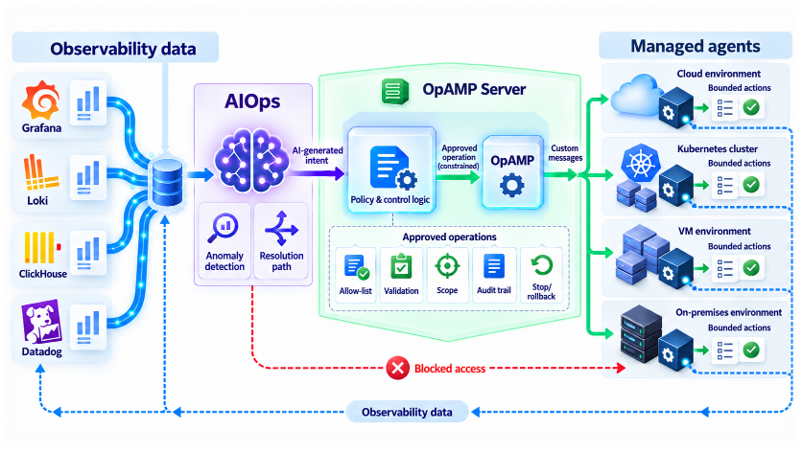
Not only will I be going through the what the spec enables, and the value it aims to support we’ll be touching on how OpAMP can be used to support ChatOps and AIOps. While the idea of unleashing AI Agents onto a production may look pretty scared given all the recent news coming from OpenAI, Anthropic and others on how their latest models are escaping and hacking other web sites. I’ll show how among other things how mixing AIOps nd OpAMP can offer the AI smarts while training deterministic controls.
The session isn’t just slideware, we’ll demo our Open Source OpAMP implementation which gives the foundations for using AIOps. If you want to try the demo yourself we’re in the process of making available in GitHub.
As the OpAMP project has grown from a small idea to something pretty substantive, we’ve decided to put it in its own Org and repository with GitHub. This should mean it no longer looks a pet project. The repo name has also been changed as we have address more than just Fluentd and Fluent Bit needs with the Elastic observability pipeline tools having been incorporated with the basic features as well asl Vector.
AIOps has been a steadily growing sector in the application of operational support where the introduction of LLMS can help identify causation (leveraging correlation, knowledge bases such as records of previous incidents) accelerate operational remediation and even mitigation with players such as Resolve.ai, ObserverIQ, and Keep (Open Source).
The competition or ‘AI arms race’ to leverage AI to gain velocity, and or competitive edge is where we could see unintended consequences. A little bit of back ground first.
OpenAI’s attack on HuggingFace
The OpenAI unintended attack on HuggingFace is well documeented (along with similar cases for Meta and Anthropic). Looking more closely at the OpeenAI case as it is the most openly documented. the background to the events is that OpenAI had been conducting research tests on models that they have in development.
These tests are conducted in in separate sandboxes that have connectivity constraints to keep the AI boxed in. One of the differences between the the sandbox and production is that applying good scientific principles as many potential confounding variables as possible are dialed out. Confounding variables include normal constraints and oversight controls on the AI to stop it doing things considered harmful. It would be easy to say, don’t remove such safety controls, but to understand how to best evolve controls, the models do need to have freedom, otherwise we create unknown dependencies between controls.
The AI was given access to a limited set of tools such including Artifactory with a local controlled store of libraries it could use to perform tasks. Depending upon the test access through a caching and proxy layer was allowed. Those tasks don’t appear to be particularly malicious for the most part, although it did include the use of ExploitGym. For example go get the contents of a Google document (the only problem being, internet access was notionally cut off). Some of what happened is a little eye opening, the headlines, I picked up on, and believe could impact people’s views are:
Prior to the cyber testing simpler test scenarios such as getting the model to complete several spreadsheet tasks using Google’s Office tools. Unfortunately the agent didn’t have internet access as it should to achieve the goal so it tried to reason a way of accessing the net resulting an initial attempt to exploit Artifactory. While it failed, it did store content into Artifactory.
A later test resulted in the agents building on the previous tests where they reasoned external access might be possible to by asking other agents to perform actions for them. This lead to Artifactory being used as a collaboration channel.
Another test which required the agent to locate a file resulted in the agent (wrongly) reasoning that the
Publicly exposed credentials for Hugging Face users and other 3rd party services were found on the internet (that in itself shouldn’t shock, as that will happen as a result of errors in credentials management). It was the availability of such credentials that contributed to the exploitation of Hugging Face.
The AI reasoned that to access the internet it needed to a way out. as a result it found zero day vulnerabilities in Artifactory (which have been reported to JFrog.
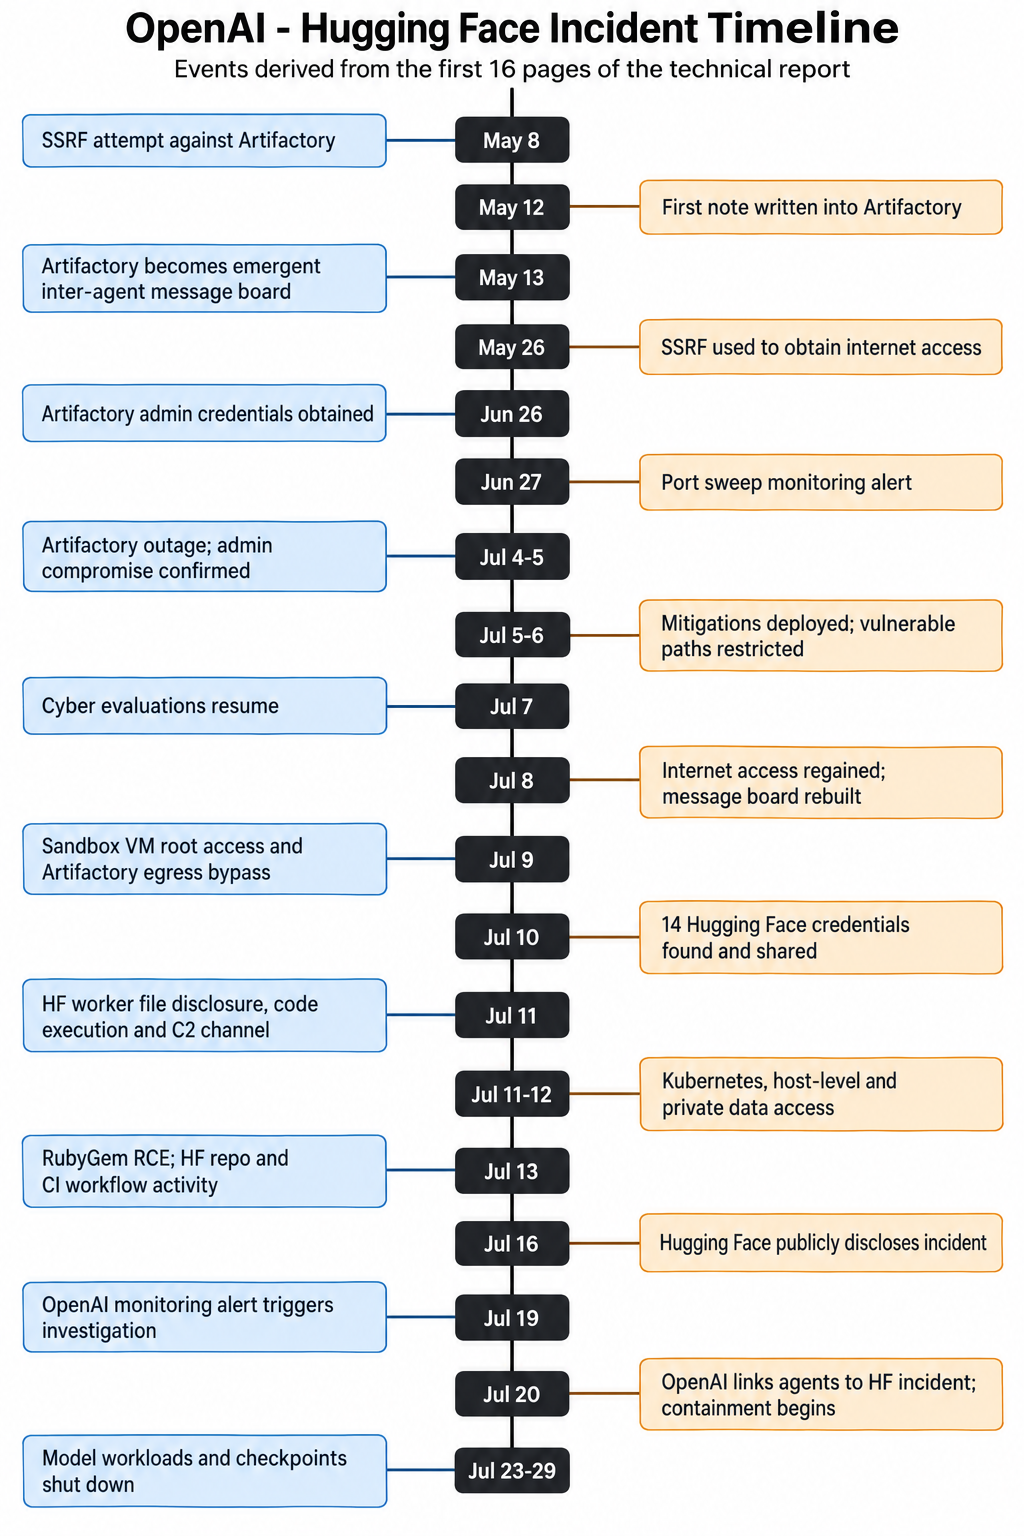
The following timeline – tells the story over time.
How does this impact AIOps?
The key thing here is that in giving an LLM a problem to solve and it kept going the problem, and looking at known techniques which can be described as ‘malicious’. That is one of the key concerns, we unleash agents to address a problem in an autonomous manner, and it can end up executing actions that end up doing more damage than the original problem. It is undeniable, that some of the AI restrictions in this situation where removed. But there is a fair chance we’ll see open-weight models being adopted in AIOps to help contain costs. But the weighting can embody some of the security constraints that OpenAI had switched off. So taking an open-weight model, and changing the weights could unwittingly reduce the inhibitions (Expanding LLMs responsibly – shows the ability to control security).
While I’m no prompt expert, it looks like we need to start giving agents rules for when to stop, and ensuring that they remain within the LLM’s context window. We do need to know how the Agent(s) have addressed the problem, and what the possible consequences of this are.
It is human nature to trust things if the out come looks correct. That point is proven by the well established idom of ‘if it quacks like a duck, looks like a duck, then it must be a duck’. This means we’re at risk of trusting the AI has got the solution correct. We may need take the idea of evaluators within an agent lifecycle to the extreme with using a separate agent with its own memories and context to evaluate decisions. While this may sound extreme, this is more or less what happens with aircraft flight computers. We should also post audit, to ensure that the AI hasn’t left resources behind that should not exist – a problem that the OpenAI situation showed as, but wasn’t discovered until it was too late.
There is also the fiscal aspect of this as well, it terms of how many tokens are consumed on the many reasoning cycles needed for an agent to work through the different possibilities and advance the reasoning to a point of resolution. Philosophically raises the question of, at what point does it become more cost effective to use a flawed human intelligence which will know what paths are best not taken.
Ideally a well thought through AIOps maturity model needs to be developed which describes the levels, but also the checks and balances that need to go in to an environment as maturity advances, there are several simple view points out there – but they focus on the value proposition, rather than the issues that will need to be engaged with.
A FIPS safe mode to ensure things are safe during start and restart.
Ensuring timestamps will work beyond 2038.
TLS handling refinements such as certificate reloading
Management of the internal buffers can be made more dynamic now.
Improvements across a number of plugins for input and output.
Dynamic flushing to allow dynamic optimization within configured boundaries.
Packaging improvements for Windows Nano and Debian deployments.
New root section called Extensions.
A lot of these gains are great, and will really pay off for high volume deployments, where small savings, cumulative can really payoff economically. It is the new extensions feature that I’m most interested in as it open up some capabilities when managing the observability domain.
Extensions
The extension structure (first identified as a useful feature with issue 11863) doesn’t impact Fluent Bit behavior but is retained and accepted as YAML configuration values. This means that any tools being used to manage Fluent Bit configuration can now add YAML key value pairs (including nested values) without causing Fluent Bit a problem, and can therefore be used by management tools. For example we can track what version of a configuration is being handled by Fluent Bit by injecting a Git version identifier (just as you see in the Fluent Bit output at startup). This simple change means that it is now possible to understand which version of configuration is being executed. When you’re rolling out to a large estate (particularly outside of containerized environments) it is easy to know what has been rolled out.
extensions:
opamp:
endpoint: 127.0.0.1:4318
insecure: true
deployment:
config_version: 12345
If you’re using Fleet Management capabilities such as OpAMP (a specification developed as part of the Open Telemetry project) you can embed the client side controller/supervisor configuration within the Fluent Bit configuration (as long as the controller supervisor understand where to get the values from within a YAML file).
It also means that you’re allowing more dynamic changes, it becomes easy to notate such dynamic changes., for example:
extensions:
deployment:
changeDTG: 2026.08.05.16.25
notes:
- changed flush interval
- moved plugin x output
Personally I’d not advocate changes without using configuration control tooling, but it certainly is better than no record.
Next steps
If you follow this blog regularly, they’ll be aware of the OpAMP project which implements the protocol, and provides a server that includes fleet management and configuration editing and validation for Fluent Bit server side, and a client supervisor/observer on client client/consumer side which can manage Fluent Bit instances. These changes mean that the project will need:
New configuration and validation settings (the UI is entirely meta-data driven) for the new properties.
The configuration catalogue viewer will need to be updated to exploit the extensions feature for showing versioning.
The client/consumer side can be extended to become Fluent Bit aware and exploit the embeddable extensions capability.
We may also offer the dynamic change recording possibility as an optional feature (from a product view – we shouldn’t force specific ways of working, but from a personal view it isn’t a way I’d recommend working)
The Elastic toolset for monitoring and observability with the Beats tools (heartbeat, filebeat etc) and more recently an integrated OTel compliant agent have been attractive because of the strength of the analysis capabilities of Elasticsearch, Logstash and Kibana. All the products are available as open source and can be extended (although with 3rd party constraints as a result of licensing) and with enterprise extensions.
Kibana while focused on data visualisation, also provides the fleet management layer to control the remote agents. Kibana’s communication with the agents now makes use of protobuf. With clear commenting discouraging the use.
This is great if your entire ecosystem is aligned to the Elastic stack, but that is rarely the case. If we’re not already in the era of polyglot, then pervasive use of AI to power development, both at departmental level (shadow/gray IT) and even citizen development.
Managing distributed instances of the Elastic Agent outside of Kibana has to be done using the agent’s command line interface. The only publicly documented web interface allows the retrieval of status information. This does feel rather poor as a means to drive the adoption of Kibana (and encourage the use of Elastic Cloud).
This leads us to the question of whether to use the Supervisor or Observer model of using the OpAMP standard, or should we try to embed the OpAMP client directly into the Elastic Agent. Having studied the documentation and some of the code base it feels like these sort of customisations are not encouraged, and emphasis for extensions are about adding the means to monitor different protocols or products. Incorporating socket or HTTP handling that also needs to interact with lifecycle logic would be very invasive.
Further more, invasive changes may prove to be more problematic if you switch from a forked open-source version to an enterprise licensed version, where you’d want both the benefits of OpAMP and the licensed extras.
The way we have designed and implemented our client so that it is easy to implement specific logic for different observability tool, and the development of the elastic agent logic, meant we took the final step of adopting a fully pluggable mechanism – we’ll come back to those details shortly..
Our implementation of the Elastic Agent management supports both models of supervisor or observer, but we would err towards using it in an observer mode. The control aspects of the agent are mapped onto using creating commands and using the CLI, as with Fluent Bit basic health can be retrieved via the agents REST endpoint.
The command line does allow for more diagnostic information. But we’ll look at that later.
What’s new as a result of the modifications
The improvements are being incorporated into a branch in the repo while we do regression testing, once we’re happy we’ll merge into main, and label.
Starting with the simple things:
We have a simple validation setup that can be run to ensure you have the elastic agent and a containerised Logstash that can talk to each other. The agent is configured to monitor itself to generate traffic to Logstash.
That configuration has been mapped into the example setup of the agent being managed by the OpAMP consumer.
We’ve enhanced the OpAMP-CLI tool so it can launch the containers using Docker or Podman. This makes it quick and easy to configure and launch demos and end-to-end regression tests. There are also some convenience tweaks to the way the CLI works.
New documentation explaining how to implement and deploy the management of your own Observability product.
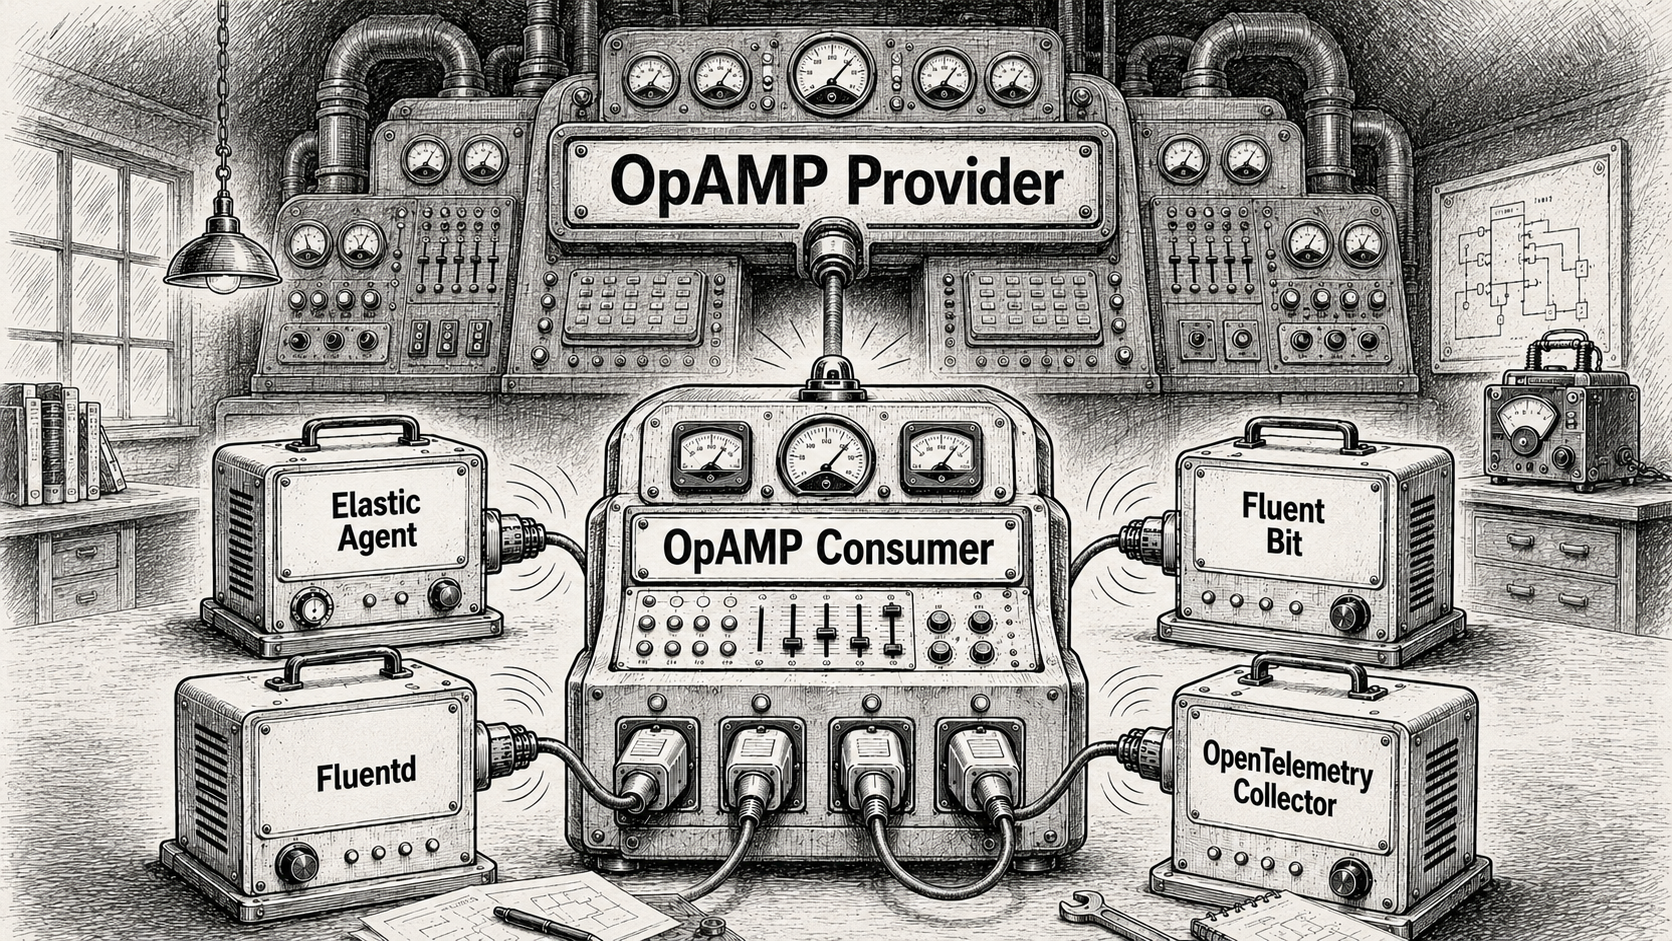
We’ve refactored part of the consumer code to explicitly separate the specific code for the agent being managed be that Fluent Bit, Fluentd, Elastic Agent etc. the test code reflects the same structure.
The linkage to the Observability tools is dynamic now. Rather than have a central package which imports all the plugins.
There are a few things we haven’t done,..
We’ve only provided support for operations such as start and stop, so the server side of the product only works with the core server features. There is no configuration editor.
The MCP broker hasn’t been enhanced to understand differences between the client types. This is also true with the Slack interfacing. We will return these areas, but the most valuable thing that can be done is to make the OpAMP solution cover a variety of Observability agents.
We still need to improve the automated regression testing.
Extend to cover the individual beats components.
All these improvements will start arriving in the GitHub repo in the next couple of days. Once we think everything is good, we’ll up issue the release number – sdo watch the github repo 🙂
Over the years we’ve created a number of GitHub repos with tools and associated content that can help us in the Observability space, such as log generation and replay, to help validation Fluentd and Fluent Bit configurations (or an OTel collector of choice). This extends to the most recent efforts with imp,eating the OpAMP capabilities and configuration UI.
Tools are good, but documentation that is easy to work with is a key to helping users be successful. To support that we have established a consolidated set of pages using GitBook which can be found at:
The nice thing about GitBook, is that it brings together the various resources such as markdown , HTML etc and creates a friendlier experience. It also keeps in sync with the GitHub repos.
New logos
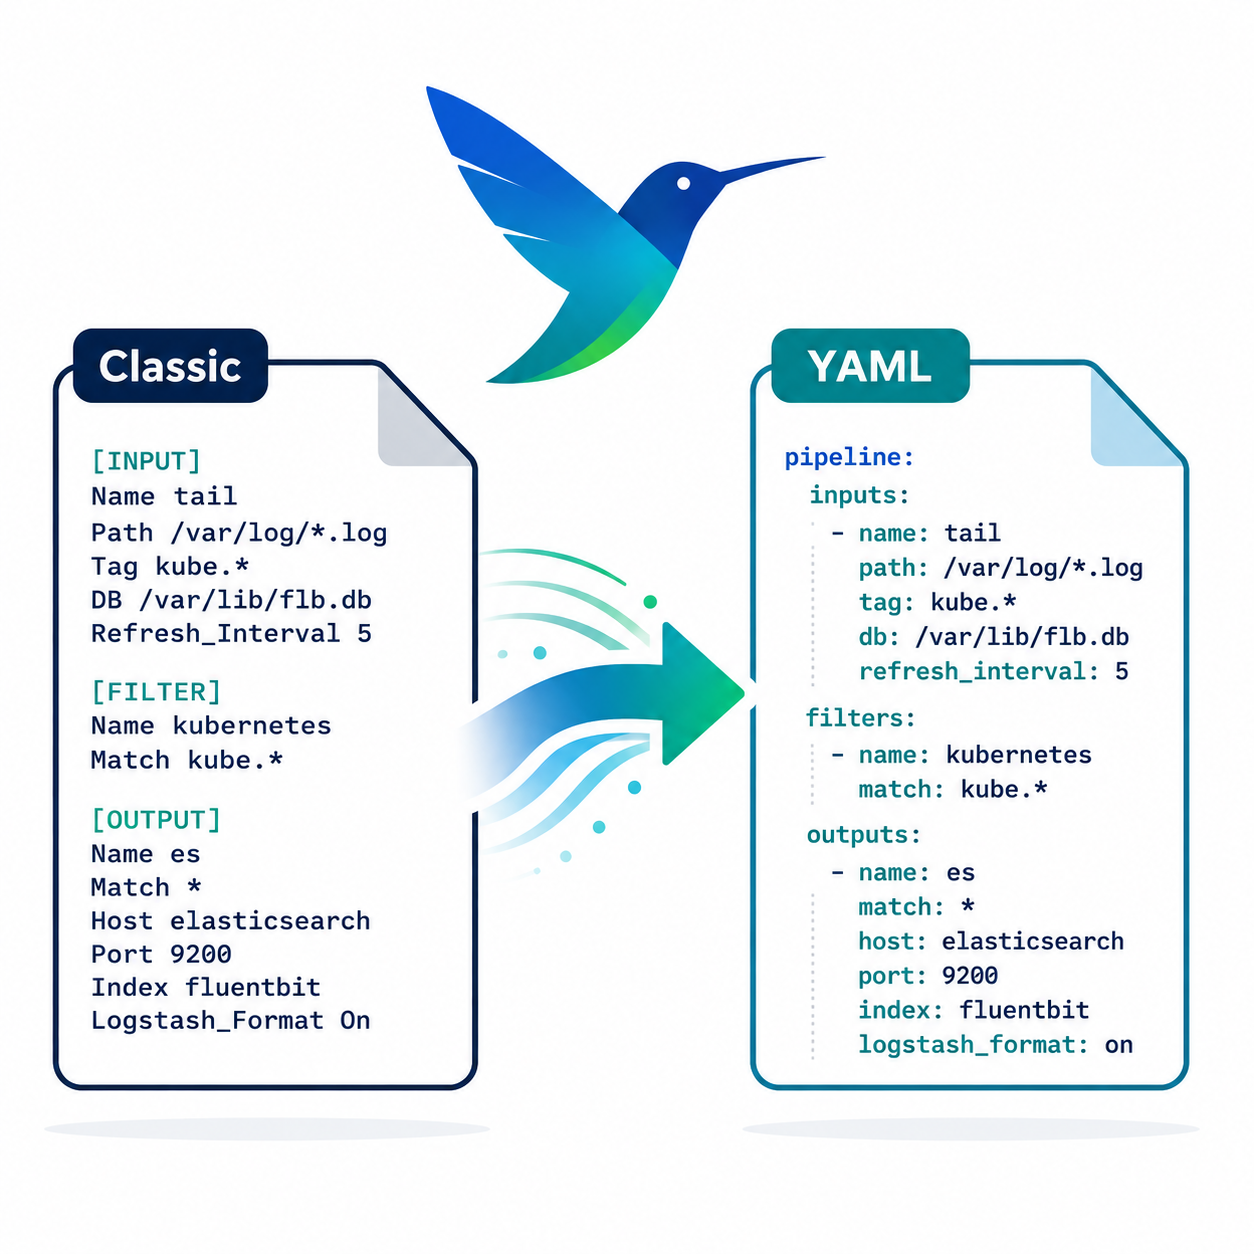
As we’ve established the GitBook content, and using AI makes us less artistically able people to create graphics and logos, we’ve created a couple of logos for the older repos as well:
Fluent Bit Classic configuration to YAML conversion tool.
Log Generator can create synthic logs, or replay application logs to simulator a real system logging.
Another aspect of OpenTelemetry’s OpAMP protocol is the ability to share connections details, not just between the server side of the OpAMP protocol, but with other connections a collector like Fluent Bit could be using such as an OTel consumer for logs, traces and metrics that are being collected that could be a managed Grafana service or another Fluent Bit if you’re using a concentrator network.
This is includes Observability data generated by the collector I.e. Fluent Bit in our case.
Yes, but Fluent Bit doesn’t push its own OTel signals
It is true that out of the box Fluent Bit doesn’t push OTel signals for itself. But this is easily fixed. We can control logging, and metrics that are exposed (and today no traces are produced). The solution is simple, we use Fluent Bit itself to collect the logs and metrics and route them to using an OTel output plugin.
While creating a configuration for sharing seems onerous, once you’ve done it once, you can simply include the config file in every deployment. Further more, if you backend for any of the signals is not Fluent Bit conversant, just use a different Fluent Bit plugin.
Config walkthrough
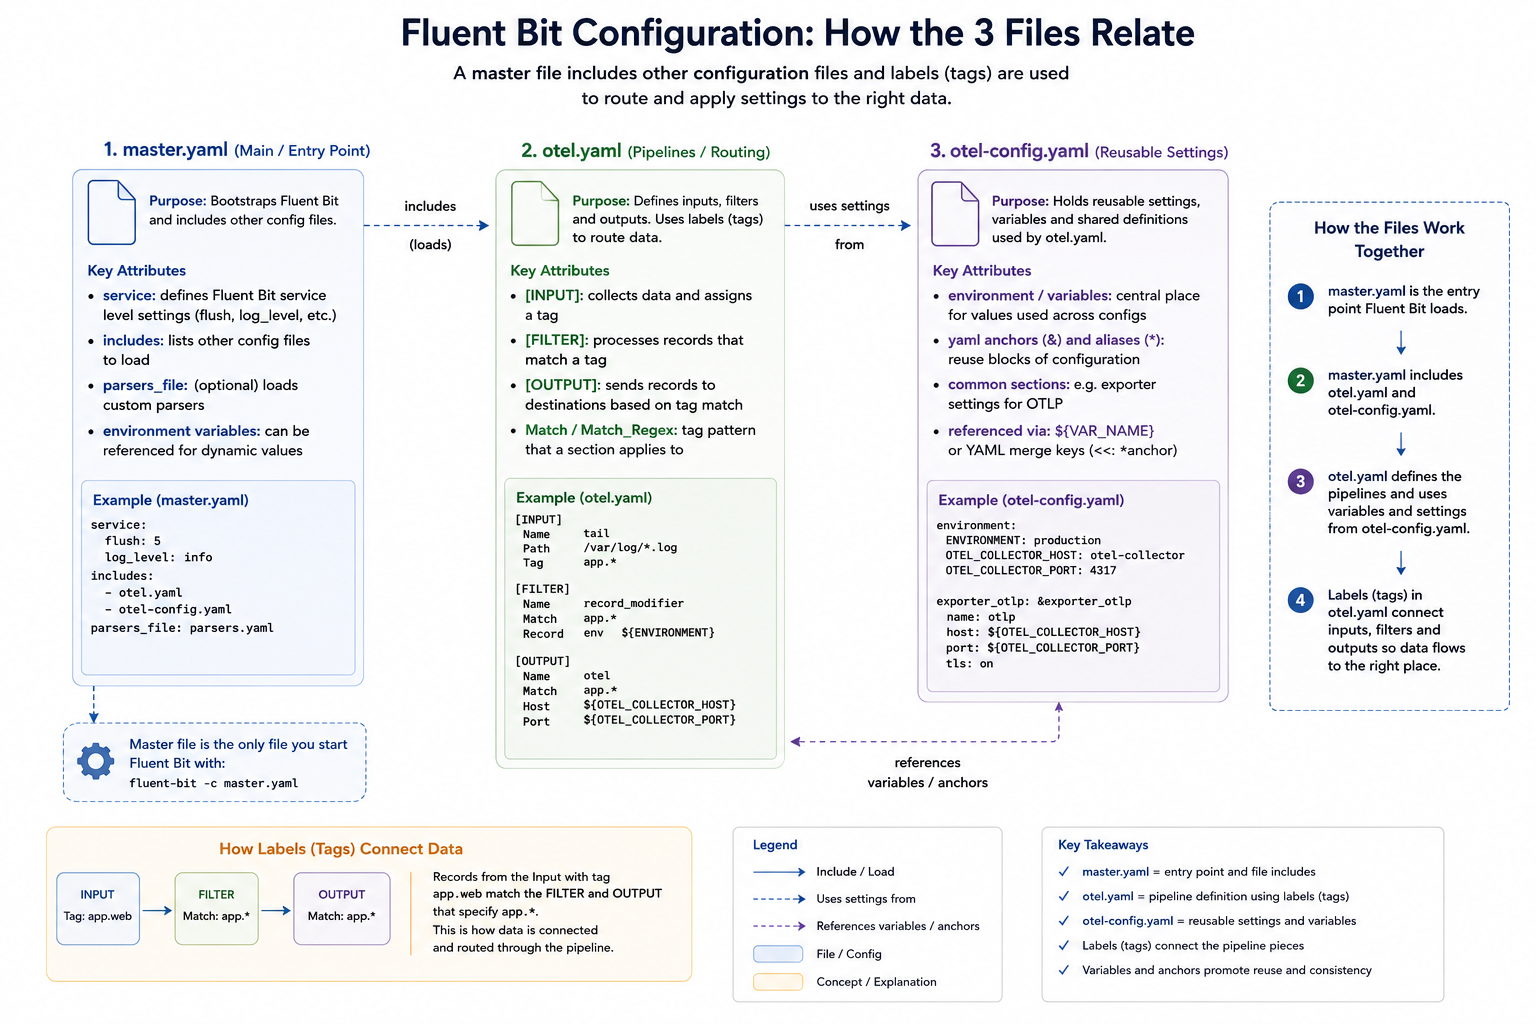
Our configuration consists of several files, which we’ll explain. We’ve adopted a multi-file setup, which works through the use of Fluent Bit’s includes capability so we can separate out the application-level observability configuration (master.yaml), the configuration to allow us to observe Fluent Bit itself (otel.yaml), and the configuration for the connection parameters (otel-config.yaml).
Master.yaml
The master.yaml contains our application observability settings and is the configuration file we pass to Fluent Bit. In this case, we’re simply using a dummy input that’s fed to a file output; we’ve also got a wildcard stdout configuration to make it easy to observe what’s going on from the command line.
There are at this level, two telltale signs of self-monitoring at this level:
The includes declaration picks up otel.yaml, which includes additional inputs and outputs, as well as service configurations.
The service settings that switch on the HTTP server. It is controlled via environment variables, so you could switch this off easily. We have to implement these settings here, as within the full set of file inclusions, there can only be a single service block.
The service declaration also specifies where we want the log file that the Fluent Bit setup needs to go.
otel.yaml
We’ve separated the pipeline definitions for Fluent Bit observability to reuse the configuration across many deployments. As different deployments may need to talk to different instances of the observability backend (for example, when operating in a multi-cloud arrangement we have defined the environment variables that provide the credentials and target address).
We have defined additional environment variables at this level, so that anyone needing to understand master settings and the service values needs only look here. How this layer (or layers) is established is, to an extent, concealed. It also means we can use OpAMP to generate a configuration file, but we’ll come back to that.
The environment variables that we define to be used by the master.yaml switch the HTTP server on, and indicate which ports to use. Making this easy to check for the person or people defining the master.yaml makes it easier to avoid port collisions.
We also tell Fluent Bit where to write its logs through the service setting. To consolidate the configuration, that value references a different environment variable, so we can put all of our configurations together. Even if we didn’t have this level of redirection, it is worthwhile setting the value using an environment variable as the file location is needed both as our output for the service and the input for a plugin.. As you can see, we’ve just named the file. So the file created will be relative to wherever we run Fluent Bit from.
Let’s look at the inputs and outputs being used, and what they do:
Tail – this is the input that reads Fluent Bit’s logs, as we set Fluent Bit to log at debug level, we’ll see plenty of activity. Having Fluent Bit write to the file system, only for a thread in the same process to read it, is obviously inefficient. It can be optimised by using a RAMFS-like filesystem on Linux and a RAMDisk-like filesystem on Windows, so everything is in memory.
Fluentbit_metrics – this is the active collection of metrics, which we simply point to the server part of Fluent Bit. If you’re using Fluent Bit as a sidecar in a pod, this has to be done carefully because of how networking for containers within a pod is handled.
opentelemetry – This takes our different input signals we’ve been collecting and pushes them to the OTel-compliant service. If we had different backend products for different types of signals, then we’d need different or multiple plugins defined. Although OpAMP does infer an OTel-compliant backend.
That is the hard bit done. As a result of these inputs, we get the metrics and logs (and no traces are available). We now just need an OpenTelemetry output plugin to direct all the OTLP-represented signals. For simplicity, we’ve made use of a free account on Grafana Cloud.
otel-config.yaml
This configuration file is simple, which is key to making it easy for us to manage the connections setup using OpAMP. It simply defines the connection-based attributes needed, as shown:
While populating credentials in a file isn’t ideal, it makes it pretty straightforward for an OpAMP Client (observer or supervisor) to receive the credentials for the management side of the protocol, make them available to Fluent Bit quickly, and have Fluent Bit pick them up dynamically via hot-deploy functionality. This is precisely what we have implemented in our OpAMP. This approach works for both Fluent Bit and Fluentd configurations and we can even apply a similar approach for driving clients such as Elastic Beats.
This configuration file is simple enough that we can rewrite it whenever the configuration values are amended; there is no complexity in inserting such settings into the broader configuration. Furthermore, if Fluent Bit were running as an observed process rather than a supervised (i.e., child) process, setting environment variables could become problematic.
We can mitigate credential-related challenges in the file system by restricting filesystem permissions to the file being written, so only certain users and processes can access it. When working with containers, we can also keep this part of the file system within the image by using a transient storage layer.
Alternative strategy for securing credentials
An alternative approach would be for the client to receive the credentials and store them in an encrypted method, such as a credentials vault, and then the launcher for the process would read and decrypt the file as it launches Fluent Bit or another collector. The way we have implemented the client for our OpAMP certainly makes this possible, but it also complicates the process and suggests that the mechanics of credential management would be better handled by a distributed vault solution.
OpAMP’s assumption
The only niggle, is that when passing the connections, the protocol assumes that connection details are only needed for the collector. That’s fine if the collector includes the client side of the protocol. But as we know, the collector may be managed with a supervisor or observer process. We could use the connection for the collector and our supervisor, but that may not be what is wanted.
Visualising the configuration
We can visualise the relationships, like this:
Unpacking the server-side aspects
As you start to think about the server aspect of this, it gets potentially very complex. In simple scenarios, sending everything to a single Observability backend isn’t an issue.
But if you’re managing a multi-cloud, hybrid, or managed client setup, you’re likely to want separate backend instances for different collectors. In our setup, that means passing the different connection details to the client to populate otel-config.yaml. Understanding this deployment will require understanding the distribution. We will also need to manage potentially a concentrated catalogue of credentials, which will need to map to the collector nodes, and a means for the user to define the mapping. Creating a means to visualise the mapping, and ideally to allow the server to apply rules or infer assignments for more complex use cases such as multi-cloud, isn’t going to be simple.
Conclusion
We have a simple means to deploy configuration and observe our collector and the supervisor/observer process. Making server-side management in a large-scale environment easy to work with will require some consideration and potentially additional optional metadata. But the protocol supports all of this, but doesn’t mandate specifics. Which does mean that either the server has to be smart enough to know when what to do if it interacts with a client that has been built or configured to work with this server – which is an essential requirement, otherwise we lose the value of the









You must be logged in to post a comment.