
The Elastic toolset for monitoring and observability with the Beats tools (heartbeat, filebeat etc) and more recently an integrated OTel compliant agent have been attractive because of the strength of the analysis capabilities of Elasticsearch, Logstash and Kibana. All the products are available as open source and can be extended (although with 3rd party constraints as a result of licensing) and with enterprise extensions.
Kibana while focused on data visualisation, also provides the fleet management layer to control the remote agents. Kibana’s communication with the agents now makes use of protobuf. With clear commenting discouraging the use.
This is great if your entire ecosystem is aligned to the Elastic stack, but that is rarely the case. If we’re not already in the era of polyglot, then pervasive use of AI to power development, both at departmental level (shadow/gray IT) and even citizen development.
Managing distributed instances of the Elastic Agent outside of Kibana has to be done using the agent’s command line interface. The only publicly documented web interface allows the retrieval of status information. This does feel rather poor as a means to drive the adoption of Kibana (and encourage the use of Elastic Cloud).
This leads us to the question of whether to use the Supervisor or Observer model of using the OpAMP standard, or should we try to embed the OpAMP client directly into the Elastic Agent. Having studied the documentation and some of the code base it feels like these sort of customisations are not encouraged, and emphasis for extensions are about adding the means to monitor different protocols or products. Incorporating socket or HTTP handling that also needs to interact with lifecycle logic would be very invasive.
Further more, invasive changes may prove to be more problematic if you switch from a forked open-source version to an enterprise licensed version, where you’d want both the benefits of OpAMP and the licensed extras.
The way we have designed and implemented our client so that it is easy to implement specific logic for different observability tool, and the development of the elastic agent logic, meant we took the final step of adopting a fully pluggable mechanism – we’ll come back to those details shortly..
Our implementation of the Elastic Agent management supports both models of supervisor or observer, but we would err towards using it in an observer mode. The control aspects of the agent are mapped onto using creating commands and using the CLI, as with Fluent Bit basic health can be retrieved via the agents REST endpoint.
The command line does allow for more diagnostic information. But we’ll look at that later.
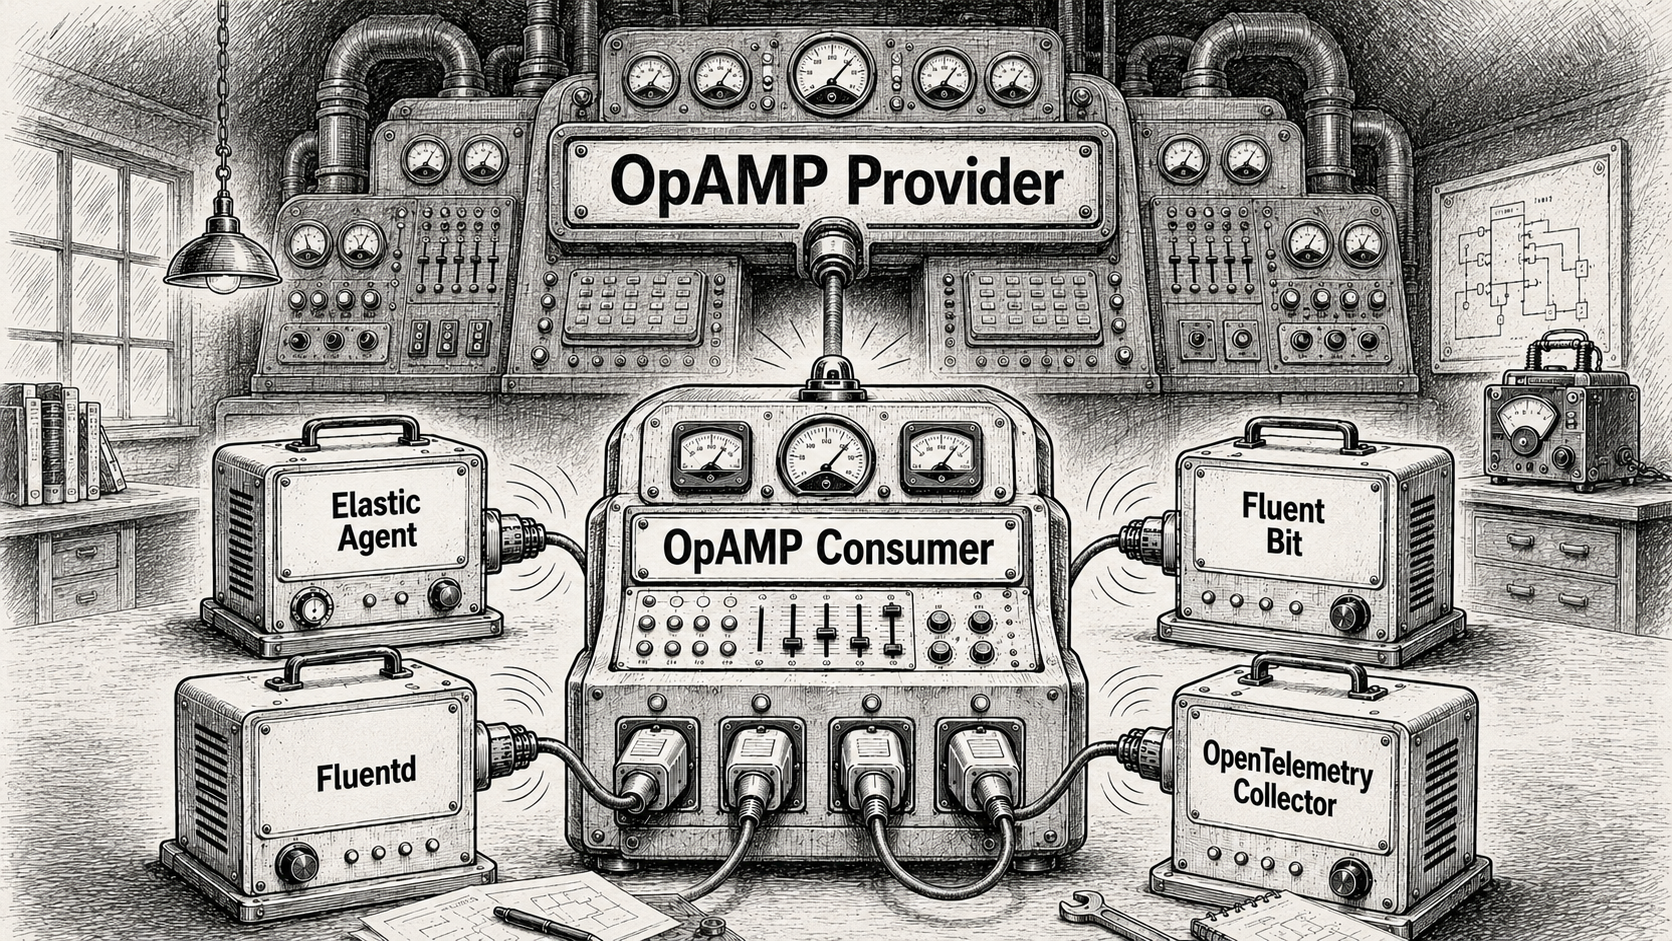
What’s new as a result of the modifications
The improvements are being incorporated into a branch in the repo while we do regression testing, once we’re happy we’ll merge into main, and label.
Starting with the simple things:
- We have a simple validation setup that can be run to ensure you have the elastic agent and a containerised Logstash that can talk to each other. The agent is configured to monitor itself to generate traffic to Logstash.
- That configuration has been mapped into the example setup of the agent being managed by the OpAMP consumer.
- We’ve enhanced the OpAMP-CLI tool so it can launch the containers using Docker or Podman. This makes it quick and easy to configure and launch demos and end-to-end regression tests. There are also some convenience tweaks to the way the CLI works.
- New documentation explaining how to implement and deploy the management of your own Observability product.
- We’ve refactored part of the consumer code to explicitly separate the specific code for the agent being managed be that Fluent Bit, Fluentd, Elastic Agent etc. the test code reflects the same structure.
- The linkage to the Observability tools is dynamic now. Rather than have a central package which imports all the plugins.
There are a few things we haven’t done,..
- We’ve only provided support for operations such as start and stop, so the server side of the product only works with the core server features. There is no configuration editor.
- The MCP broker hasn’t been enhanced to understand differences between the client types. This is also true with the Slack interfacing. We will return these areas, but the most valuable thing that can be done is to make the OpAMP solution cover a variety of Observability agents.
- We still need to improve the automated regression testing.
- Extend to cover the individual beats components.
All these improvements will start arriving in the GitHub repo in the next couple of days. Once we think everything is good, we’ll up issue the release number – sdo watch the github repo 🙂


You must be logged in to post a comment.