Fluent Bit’s documentation is spread across many static web pages; in some cases, attributes allowed for a plugin are documented across several pages. There is absolutely nothing wrong with this. Having written a book on Fluent Bit, I can say it makes sense, and if the standard docs went into further detail, it would increase the spread of content.
The problem is, once you’ve got a grip on Fluent Bit, you want a quick reference just to check the attribute names or confirm that an attribute does what you expect.
Each quick reference page has a section at the top that provides a comma-separated list of all the plugins for the different operations, inputs, outputs, etc., with anchor links to that section. Each plugin has a table that lists all configuration attributes, including those inherited from the Fluent Bit kernel and those introduced by extending another plugin.
Why and how …
The “why” may prove even more appealing. As part of our OpAMP project, we wanted to make it easy to edit and validate Fluent Bit and Fluentd configurations before deployment using the OpAMP tooling. That tool became the config-service part of the OpAMP repo, and can be independently deployed as well as function as part of the main OpAMP service. As a result, the UI offers the same authentication and authorisation options, ranging from running without authentication to using OAuth.
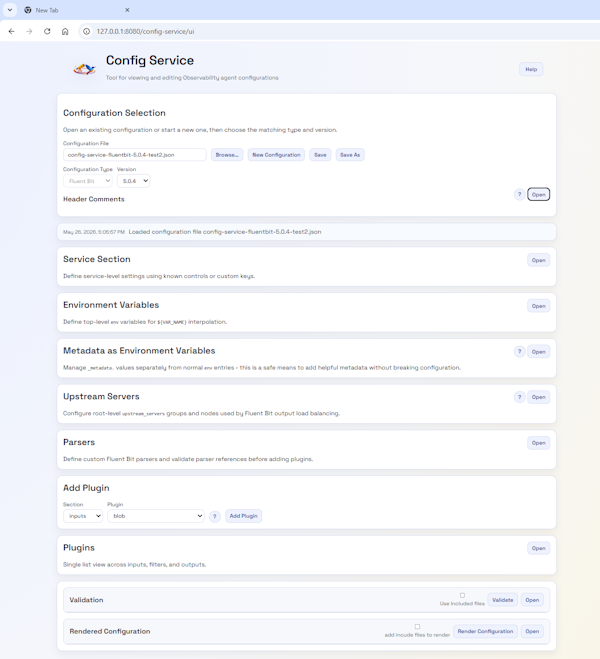
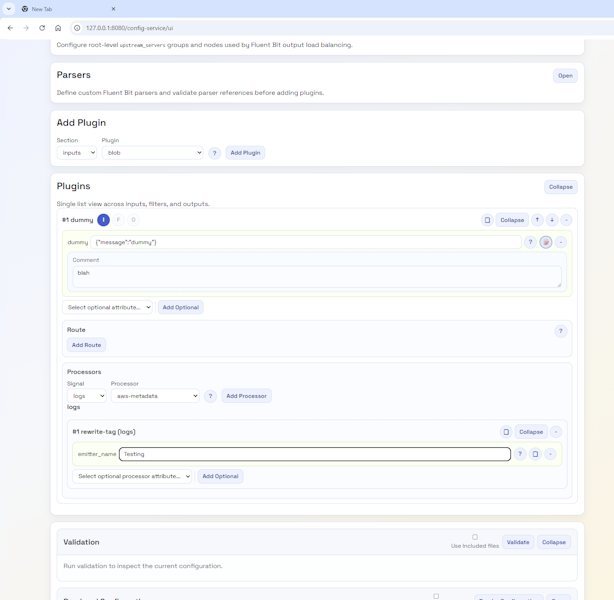
All the different editable components collapsedPlugins part of the editor
The key to both the UI and documentation is the use of JSON Schemas, as they contain all the information needed to create documentation just as easily as they power the UI. We have therefore generated a markdown page using a Python script. This means the docs are easy to check (compared to an HTML file) and can be rendered within GitHub. We could extend the script to generate HTML. But rather than trying to remember to keep both document types in sync (and double-check formatting), we found a JavaScript tool (marked.js) that performs an on-the-fly transformation that, as long as we stay within the core Markdown syntax, won’t cause any issues. We’ve then enriched that output a bit by applying stylesheets.
To come…
At the moment, we have only covered a subset of Fluent Bit versions, so we will, in due course, expand to cover more versions. Today, this is just the last version from each major release. We haven’t done every version to date as it does take a lot of effort to go through the documentation to generate and check the schema, and we’re still refining things as we enhance the UI.
We are also looking to do the same for Fluentd, though this is much trickier, as the portfolio of plugins that make up the core is smaller than those incorporated into the core of Fluent Bit, and the leveraging of Ruby’s dynamic behaviour makes it very easy for people to offer plugins separately. Then, of course, there is the task of collating all that information.
Something that vendors like Microsoft have been really good at is reducing the friction on getting started – from simplifying installations with MSI files and defaulted options through to very informative error messages in Excel when you’ve got a function slightly wrong. Apple is another good example of this; while no two Android phones are the same, my experience is that setting up an iPhone is just so much easier than setting up an Android phone. It is also the setup/configuration where most friction comes from.
Open-Source Software (OSS), as a generalisation, tend to be a bit weaker at minimising friction – this comes from several factors:
When OSS is part of a business model, vendors can reduce that friction, making their enhanced version more attractive.
OSS contributors are typically focused on the core problem space and are usually close enough to the fine details to not need those fancy features to keep the rest of us out of trouble.
The expectation is that tools to make configuration easy are embedded in the application, making it heavier, when the aim is to keep things as light as possible.
Occasionally, a little bit of intellectual snobbery can creep in
The common challenge
The issue that I have observed is that we often go through cycles of working with a technology. For example, you’re building a microservice. Chances are, you’ll start writing and running it locally, without worrying about containerization. Once you’re pretty happy with things, you’ll Dockerize the service, start testing it locally, and then you’ll be ready to deploy it to a cluster. Now you’ll need your YAML. It may well be weeks since you last looked at Helm charts. You end up cutting and pasting your last configuration. But now you need to use another feature of Helm, can you remember the exact settings for the feature. So now you’re trawling the net for documentation, and then it takes several tries to get it right.
AI may well step in to help developers in this area, where solutions and products are well-documented. But with the wrong model or insufficient detail in the prompt, it’s easy to make a mistake. Personally, I’d turn to AI when it becomes necessary to trawl code to better understand the configuration and its behaviour, and to set options.
Experimental Solution
Solution – well, that depends upon the configuration syntax. We have been experimenting with RJSF (React JSON Schema Form), which provides a React-based UI that can be dynamically driven by a JSON schema and validate data with AJV (an alternative stack considered would have been around JSON Forms).
{
"type":"object",
"title":"Dummy",
"properties":{
"name":{
"type":"string",
"const":"dummy",
"title":"Plugin"
},
"copies":{
"type":"integer",
"description":"Number of messages to generate each time messages are generated.",
The above fragment shows part of the Schema definition for the Dummy plugin for Fluent Bit.
By then creating a schema that defines the different plugins, attributes, etc., we can drive validation and menu items easily in the UI. Admittedly, the config file is significant given all the plugins and configuration options, but it is a fair price to pay for a UI that validates the data. Establishing the schema to start with, we’ve covered it through scripting the retrieval and scraping of the Fluent Bit pages, which are pretty consistent in structure.
We have added some custom elements into the definition, for example, x-doc-reference, which allows us to extend the React components to provide features such as a link back to the original documentation as you select attributes or plugins.
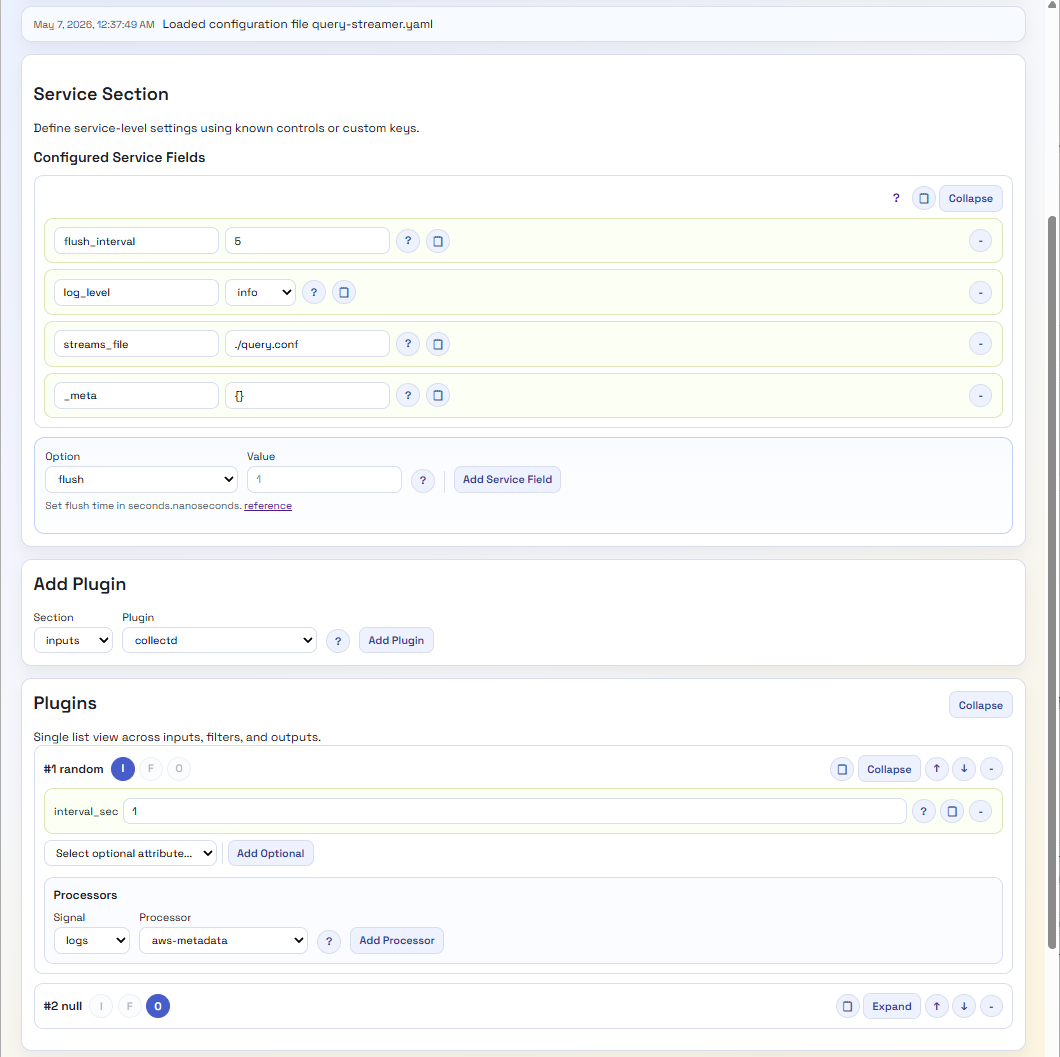
As a result, we very quickly have a UI that can look like this:
A lot easier to view and tweak, with no need to hunt for valid options. Even if we want more information, we’re just a button click away from the open-source data. Perhaps we should provide a version that hyperlinks to the Manning Live Books on Fluent Bit, etc.
There are a few other factors to consider; for example, Fluent Bit configuration is YAML, not JSON, which can be easily resolved given the relationship between the two standards. Then there are processors that can embed Lua code or a SQL-like syntax. As we’ve chosen to provide a Python backend, we’ve addressed this by providing REST endpoints which can query out of the JSON the code or SQL and perform validation using the Python Lua Parser, and the SQL syntax can be addressed using the Lark library for processing the SQL, as the syntax is simple enough to define and maintain the syntax.
Outstanding Gaps for Fluent Bit
We still need to address several features that Fluent Bit has, specifically:
Environment variables
Includes
These issues should be straightforward to overcome, although dynamically including the included elements into the UI view elements can be done. The challenge is: if any changes need to go into something that has been included, how do we push them back to the included file? Particularly if there are multiple layers of inclusion.
What about Fluentd?
Fluentd configuration isn’t JSON-based notation, but it is structured. So, to apply the same mechanism, we’ll need to define a schema and a mapping mechanism. The tricky part of the schema is that Fluentd supports nesting plugins, since the way pipelines are defined for routing differs. While JSON schema will enable this with constructs such as anyOf, oneOf, object nesting, and bounded object arrays, the structure will be more complex.
The second challenge will be the transformer/renderer, so we don’t introduce issues from having to escape and unescape characters, since JSON Schema is stricter about character use.
Then What?
Well, if we get this going, we’ll probably incorporate the capability into our OpAMP project and maybe create a build that lets the configuration tool run independently. Lastly, perhaps we should look to see if we can make the different layers a little more abstract, so we can plug in editors for other configurations, such as OTel Collectors or the ELK Stack.
As a bonus, perhaps transform the Schema into a quick reference web document?
I’ve written a few times about how OpAMP (Open Agent Management Protocol) may emerge from the OpenTelemetry CNCF project, but like OTLP (OpenTelemetry Protocol), it applies to just about any observability agent, not just the OTel Collector. As a side project, giving a real-world use case work on my Python skills, as well as an excuse to work with FastMCP (and LangGraph shortly). But also to bring the evolved idea of ChatOps (see here and here).
One of the goals of ChatOps was to free us from having to actively log into specific tools to mine for information once metrics, traces, and logs reach the aggregating back ends, but being able to. If we leverage a decent LLM with Model Context Protocol tools through an app such as Claude Desktop or ChatGPT (or their mobile variants). Ideally, we have a means to free ourselves to use social collaboration tools, rather than being tied to a specific LLM toolkit.
With a UI and the ability to communicate with Fluentd and Fluent Bit without imposing changes on the agent code base (we use a supervisor model), issue commands, track what is going on, and have the option of authentication. (more improvements in this space to come).
New ChatOps – Phase 1
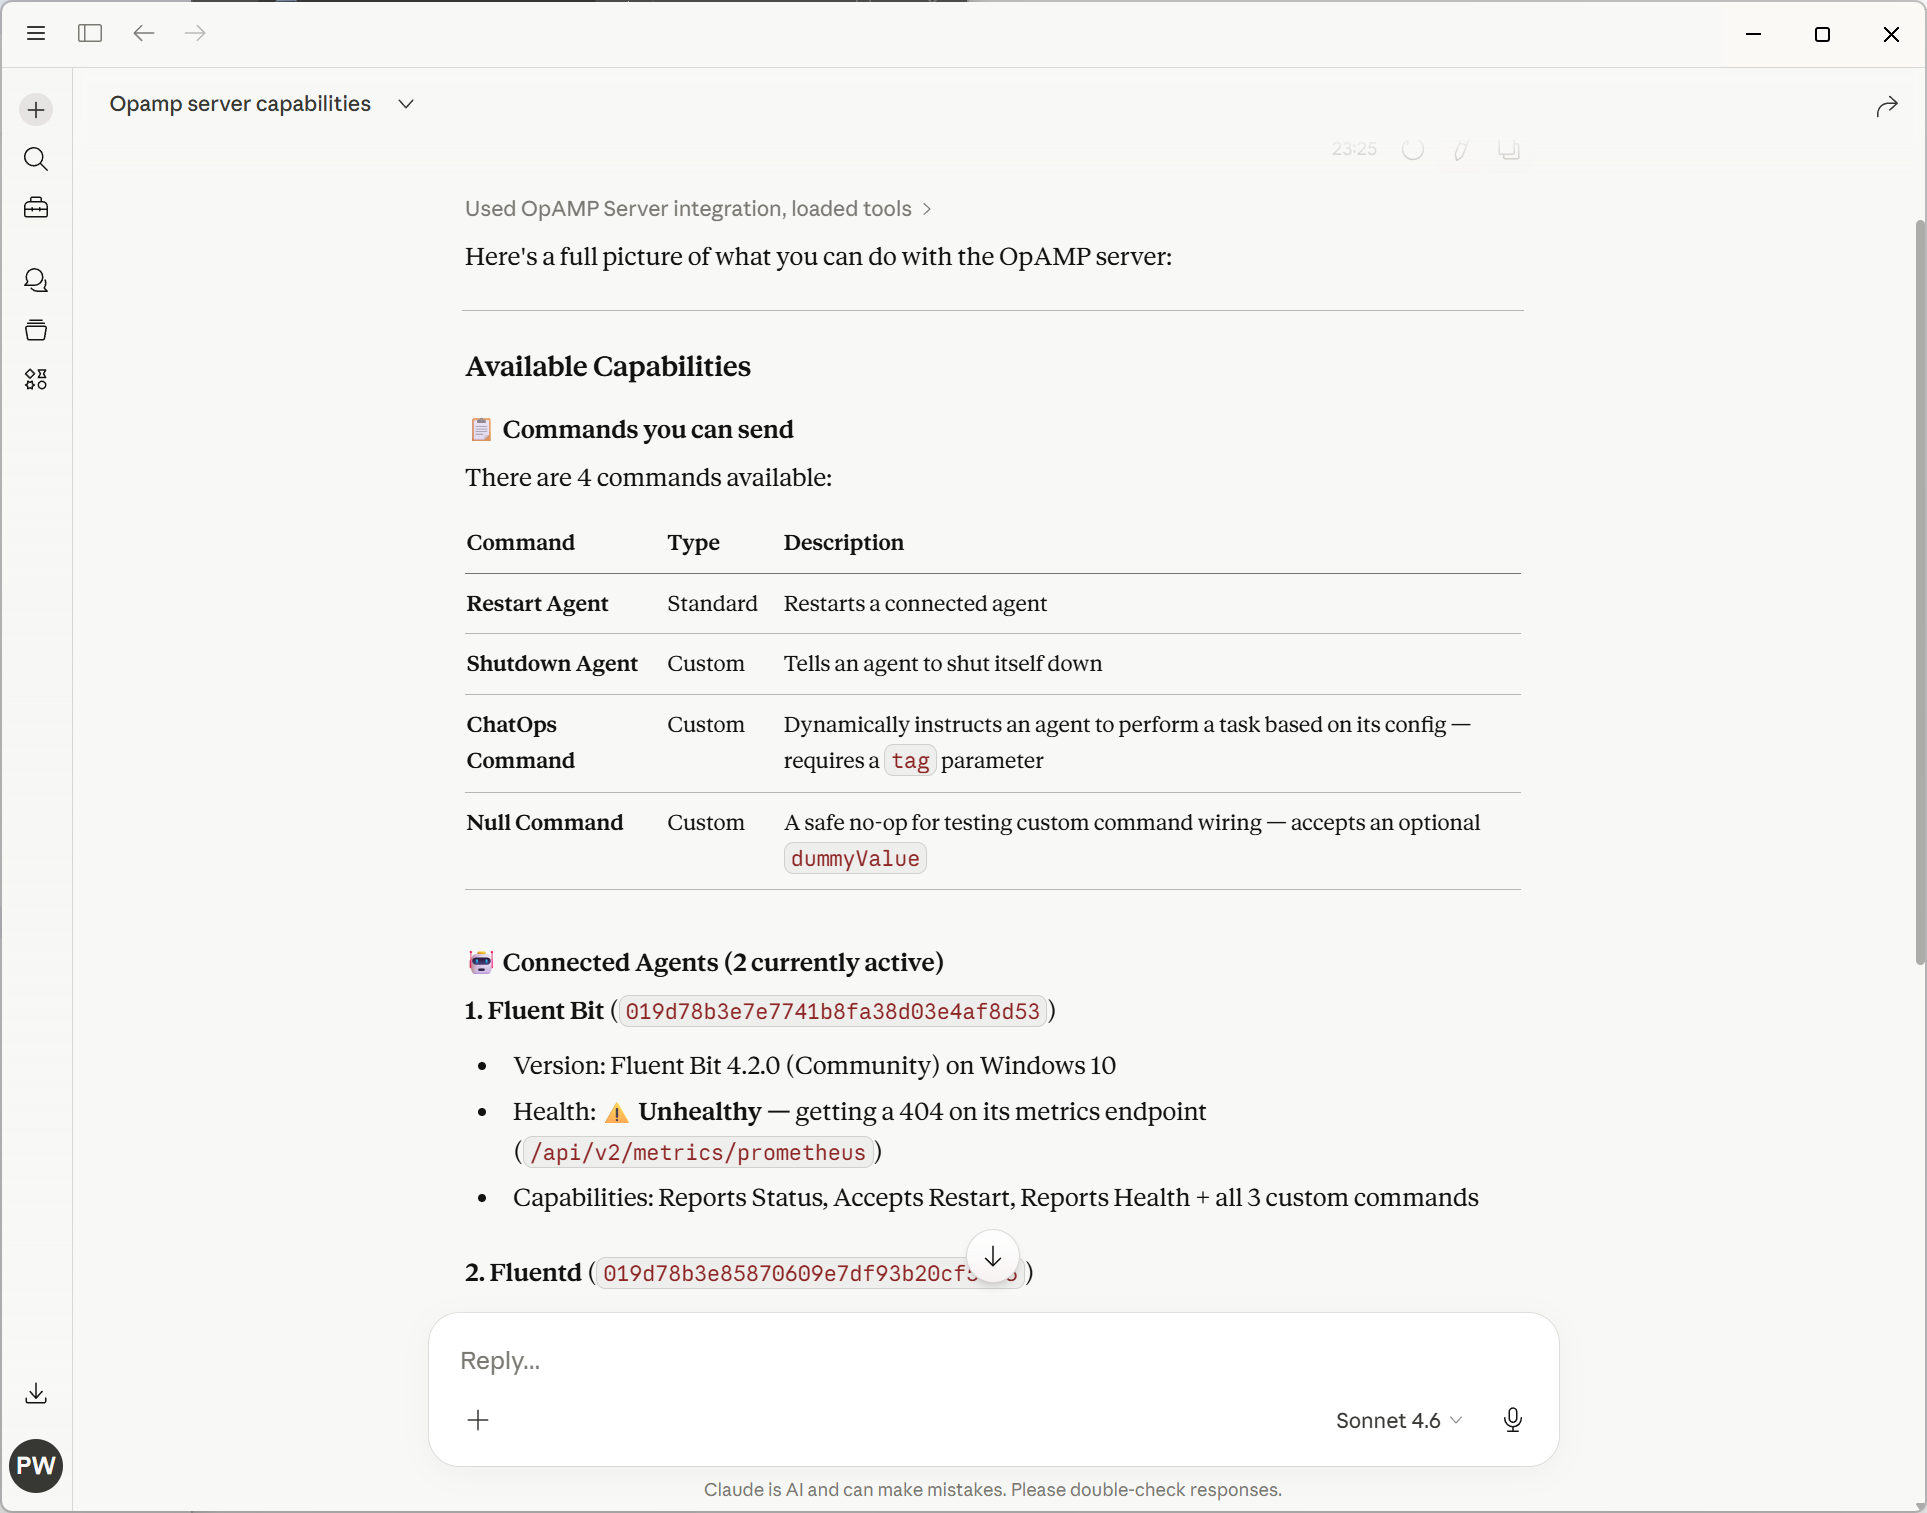
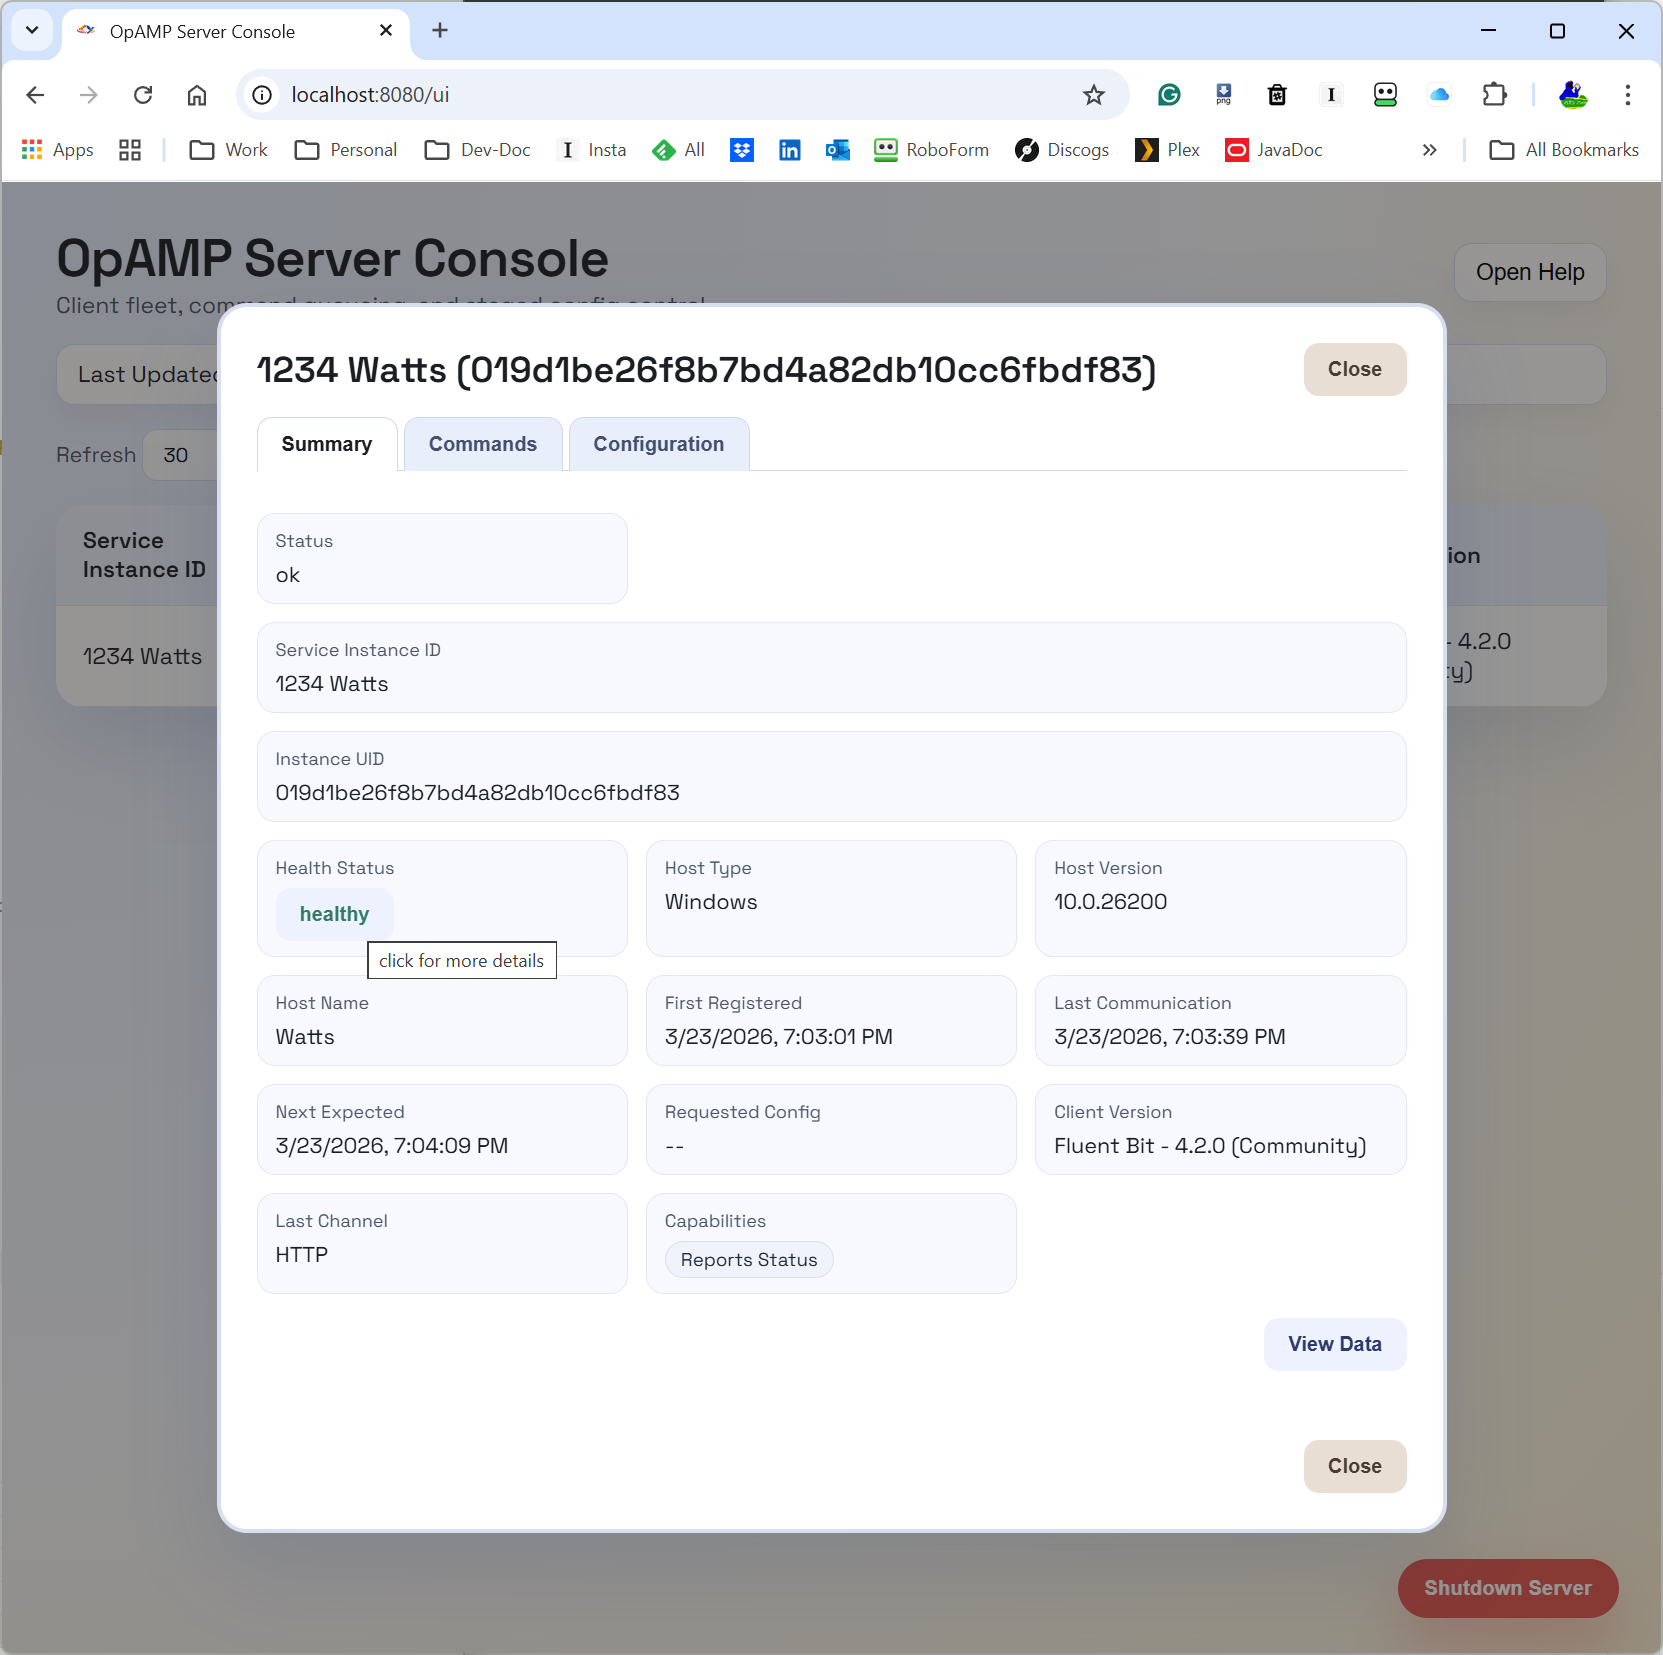
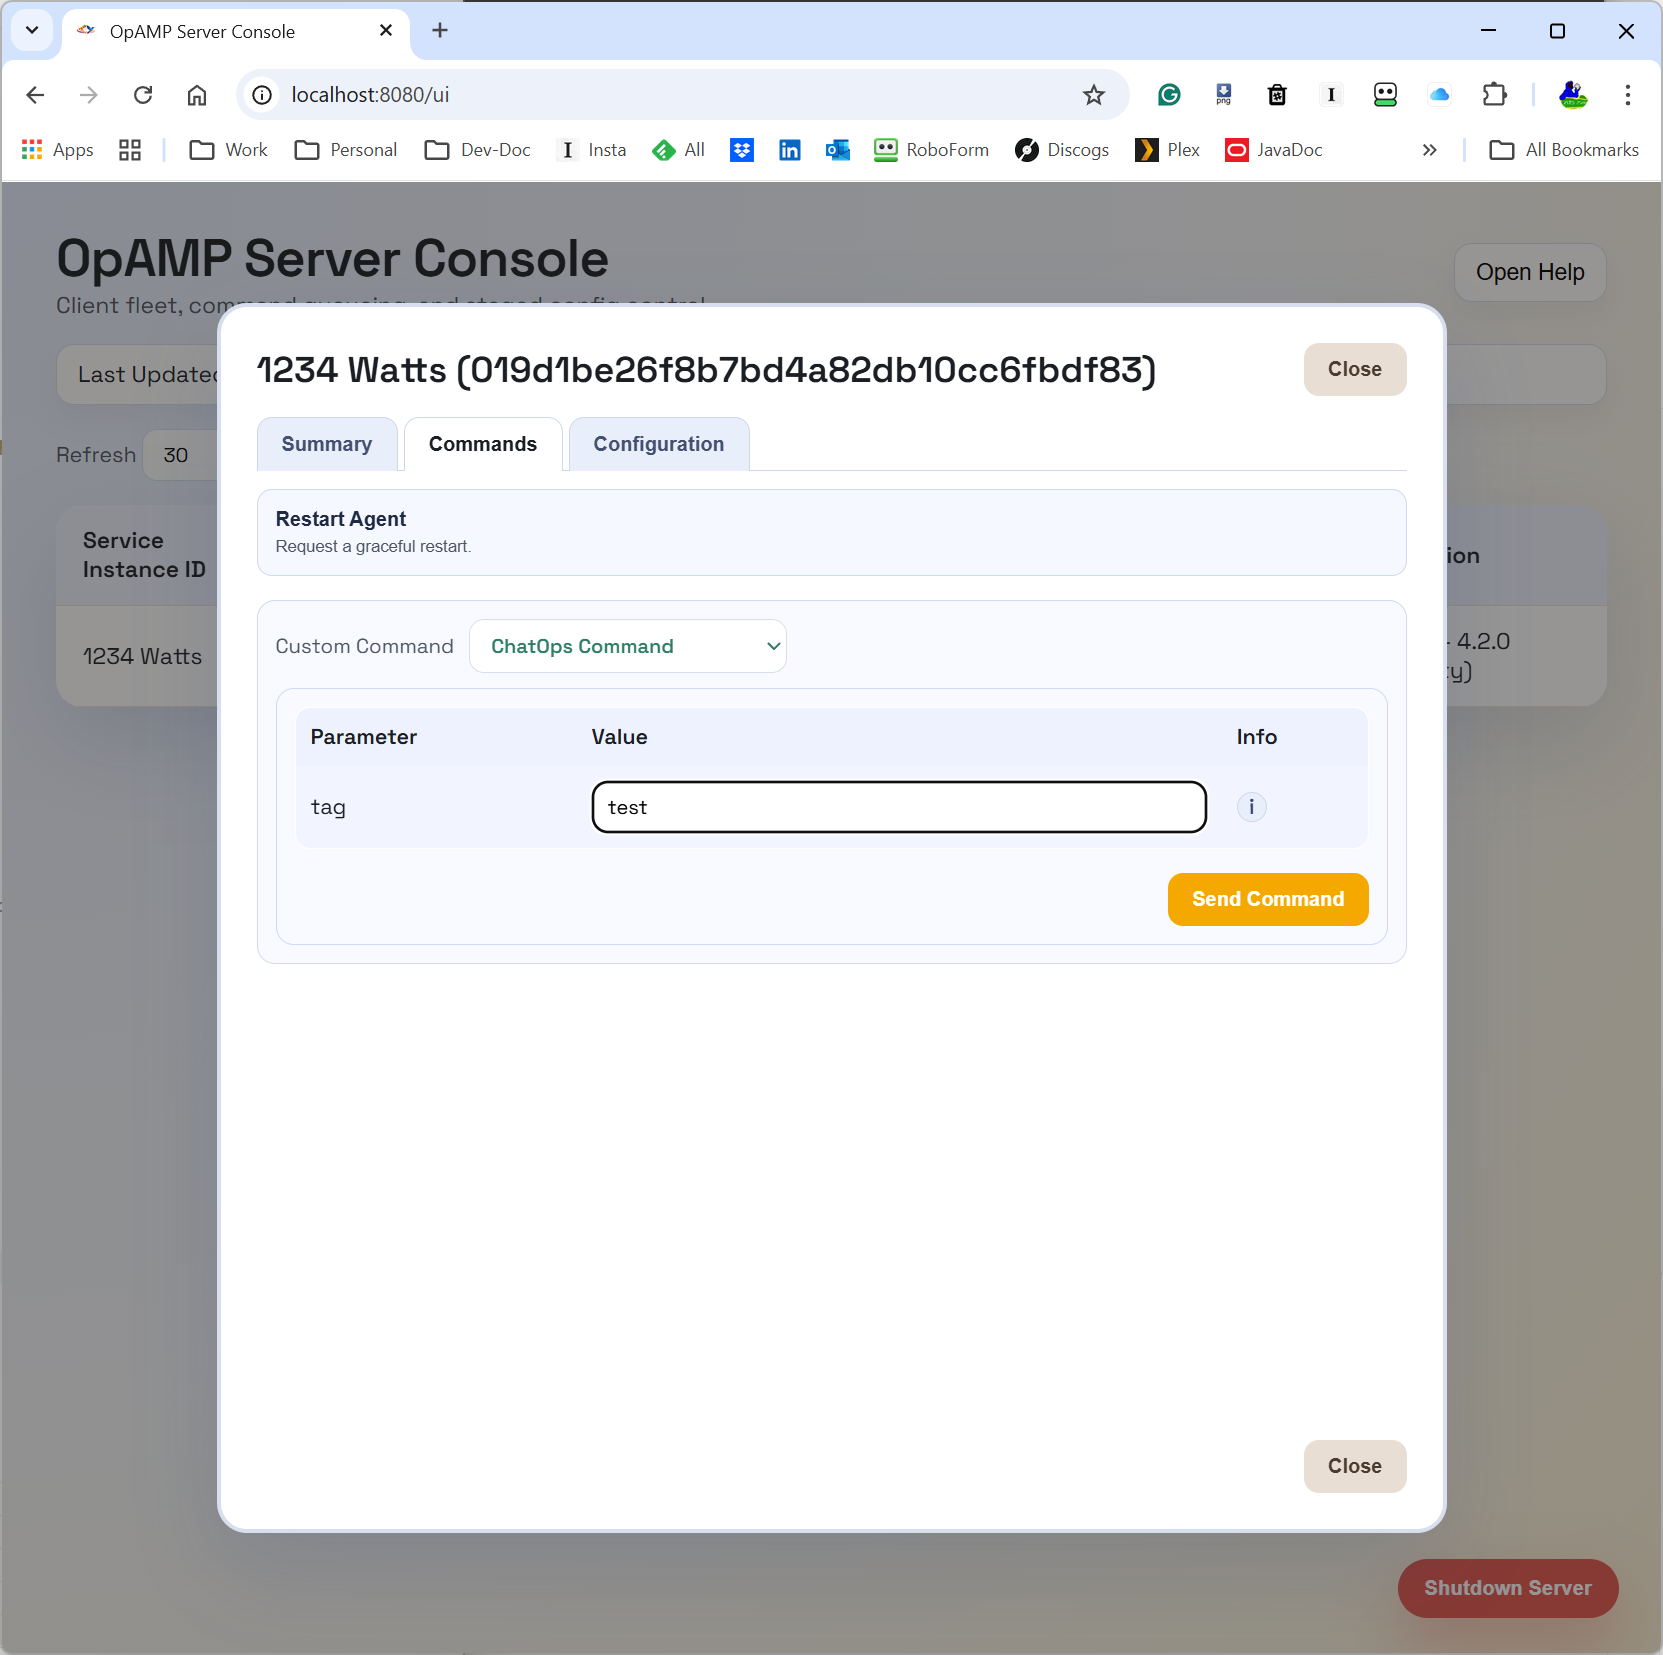
With the first level of the new ChatOps dynamism being through LLM desktop tooling and MCP, the following are screenshots showing how we’ve exposed part of our OpAMP server via APIs. As you can see in the screenshot within our OpAMP server, we have the concept of commands. What we have done is take some of the commands described in the OpAMP spec, call them standard commands, and then define a construct for Custom Commands (which can be dynamically added to the server and client).
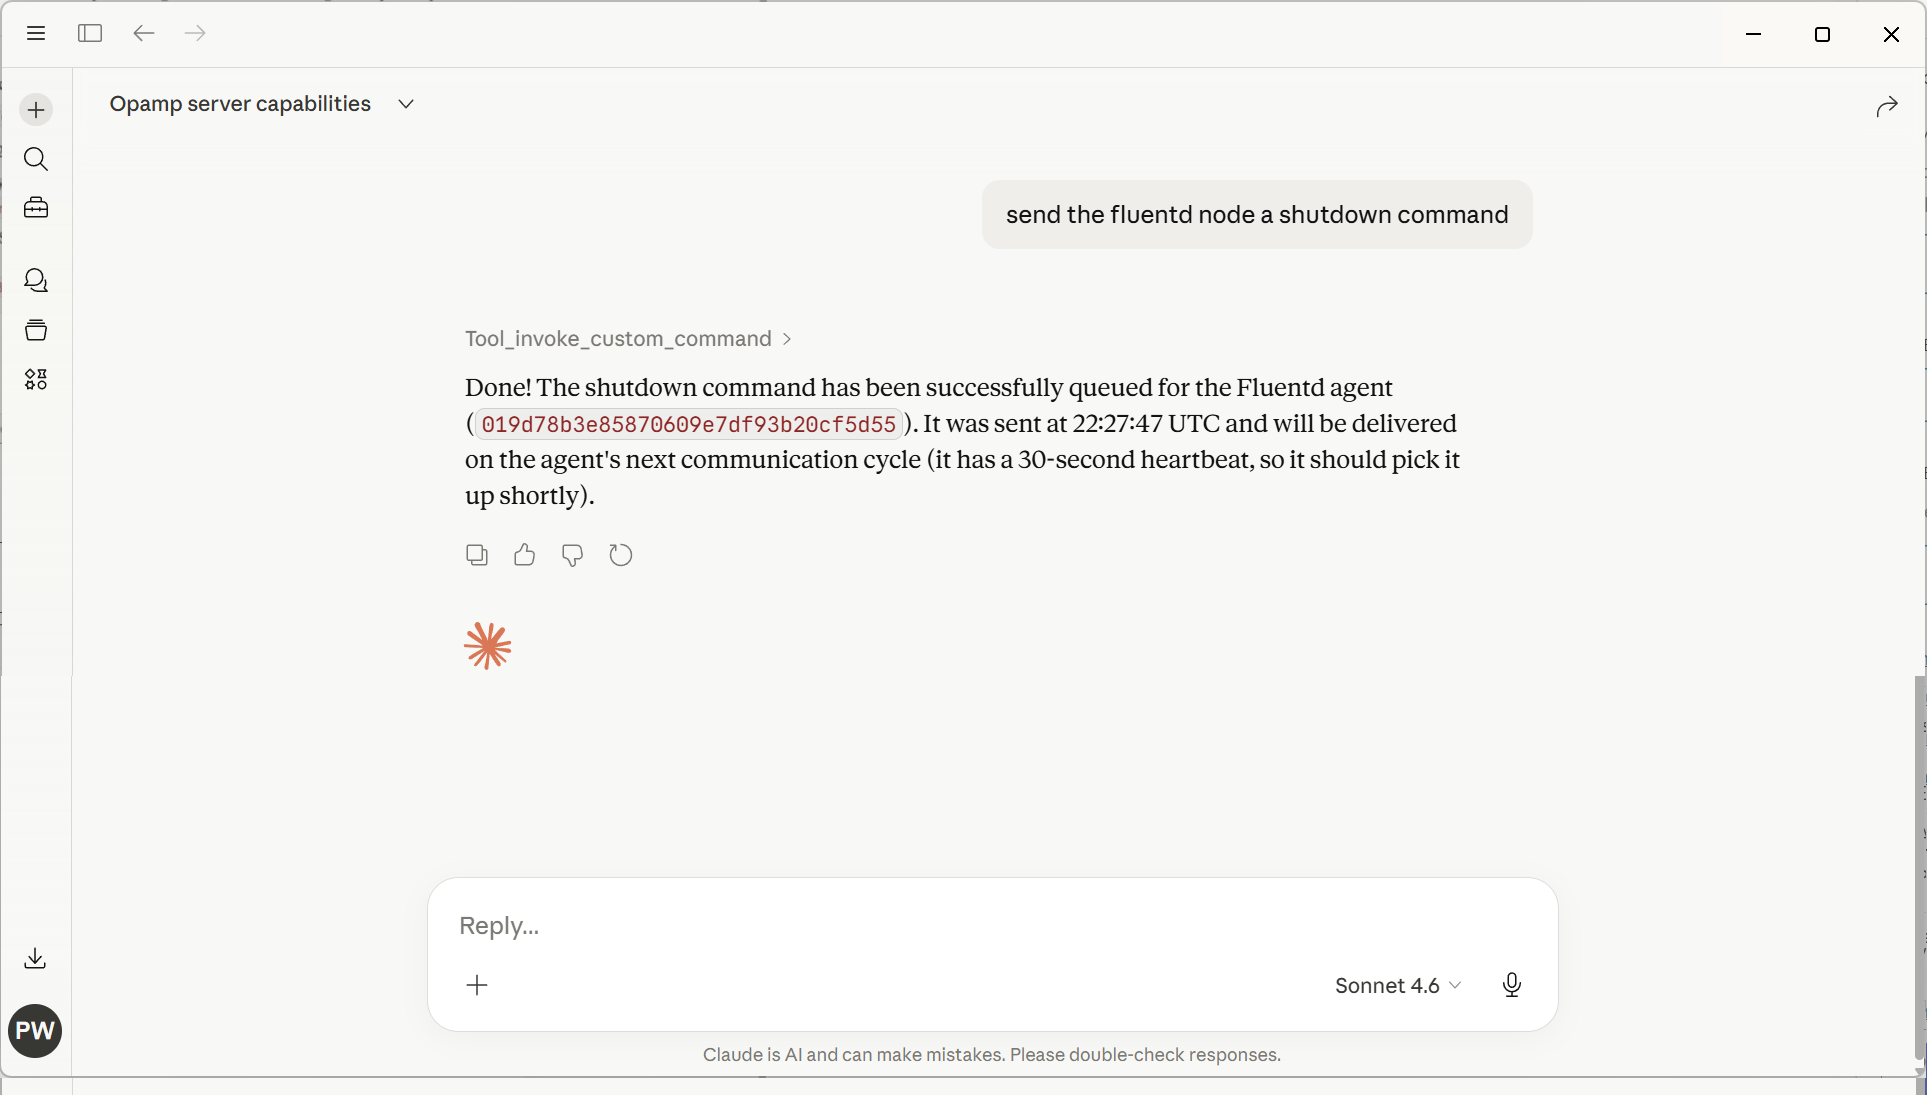
The following screenshot illustrates using plain text rather than trying to come up with structured English to get the OpAMP server to shut down a Fluentd node (in this case, as we only had 1 Fluentd node, it worked out which node to stop).
Interesting considerations
What will be interesting to see is the LLM token consumption changes as the portfolio of managed agents changes, given that, to achieve the shutdown, the LLM will have had to obtain all the Fluent Bit & Fluentd instances being managed. If we provide an endpoint to find an agent instance, would the LLM reason to use that rather than trawl all the information?
Next phase
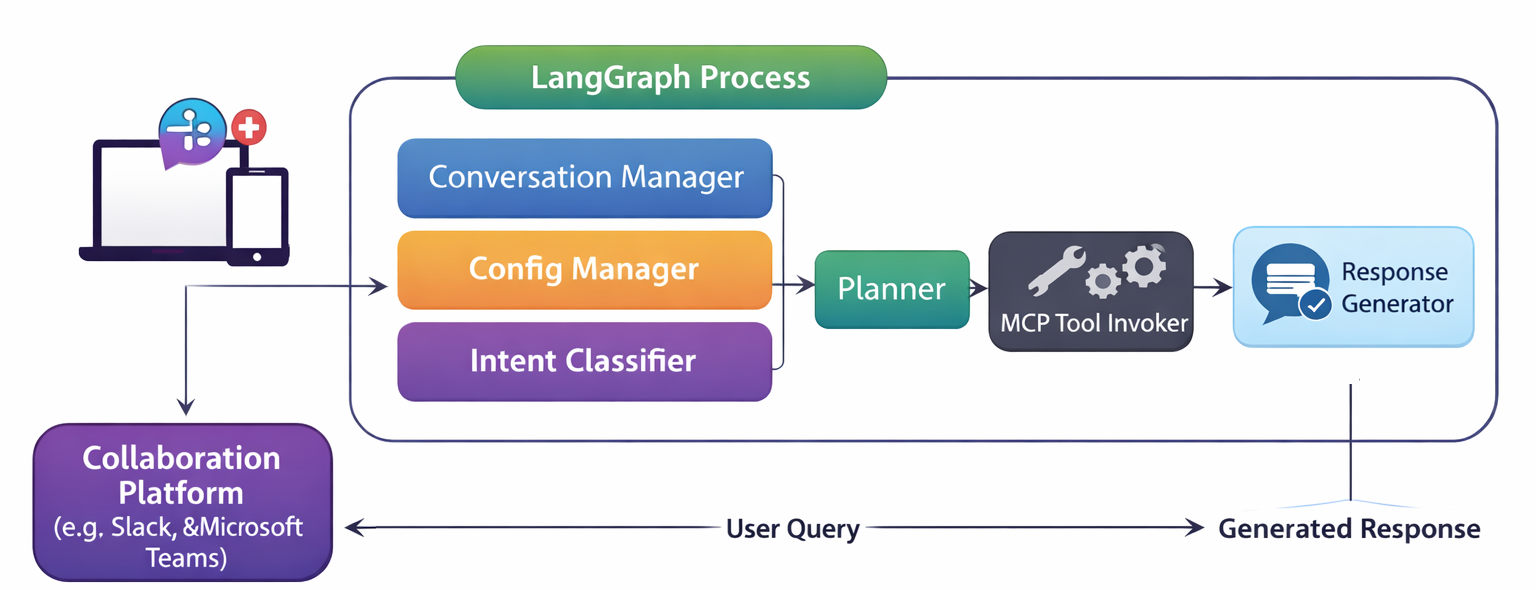
ChatGPT, Claude Desktop, and others already incorporate some level of collaboration capabilities if the users involved are on a suitable premium account (Team/Enterprise). It would be good to enable greater freedom and potentially lower costs by enabling the capability to operate through collaboration platforms such as Teams and Slack. This means the next steps need to look something along the lines of:
With KubeCon Europe happening this week, it felt like a good moment to break cover on this pet project.
If you are working with Fluent Bit at any scale, one question keeps coming up: how do we consistently control and observe all those edge agents, especially outside a Kubernetes-only world?
This is exactly the problem the OpAMP specification is trying to solve. At its core, OpAMP defines a standard contract between a central server and distributed agents/supervisors, so status, health, commands, and config-related interactions follow one protocol instead of ad-hoc integration per tool.
That is where this project sits. We’re implementing the OpAMP specification to support Fluent Bit (and later Fluentd).
In this implementation, we have:
a provider (the OpAMP server), and
a consumer acting as a supervisor to manage Fluent Bit deployments.
Right now, we are focused on Fluent Bit first. That is deliberate: it keeps scope practical while we validate the framework. The same framework is being shaped so it can evolve to support Fluentd as well.
The provider/server is the control plane endpoint. It tracks clients, accepts status, queues commands, and returns instructions using OpAMP payloads over HTTP or WebSocket.
The consumer/supervisor handles the local execution and reporting. It launches Fluent Bit, polls local health/status endpoints, sends heartbeat and metadata to the provider, and handles inbound commands (including custom ones). The server and supervisor can be deployed independently, which is important for real-world rollout patterns.
Because they follow the OpAMP protocol model, clients and servers can be interchanged with other OpAMP-compliant implementations (although we’ve not yet tested this aspect of the development).
Together, they give us a manageable, spec-aligned path to coordinating distributed Fluent Bit nodes without hard-coding one-off control logic into every environment.
Deployment options and scripts
There are a few practical ways to get started quickly:
Deploy just the server/provider using scripts/run_opamp_server.sh (or scripts/run_opamp_server.cmd on Windows).
Deploy just the client/supervisor using scripts/run_supervisor.sh (or scripts/run_supervisor.cmd on Windows).
Run both components either together in a single environment or independently across different hosts.
The scripts will set up a virtual environment and retrieve the necessary dependencies.
If you want an initial MCP client setup as part of your workflow, there are helper scripts for that too:
mcp/configure-codex-fastmcp.sh and mcp/configure-codex-fastmcp.ps1
mcp/configure-claude-desktop-fastmcp.sh and mcp/configure-claude-desktop-fastmcp.ps1
Server screenshots
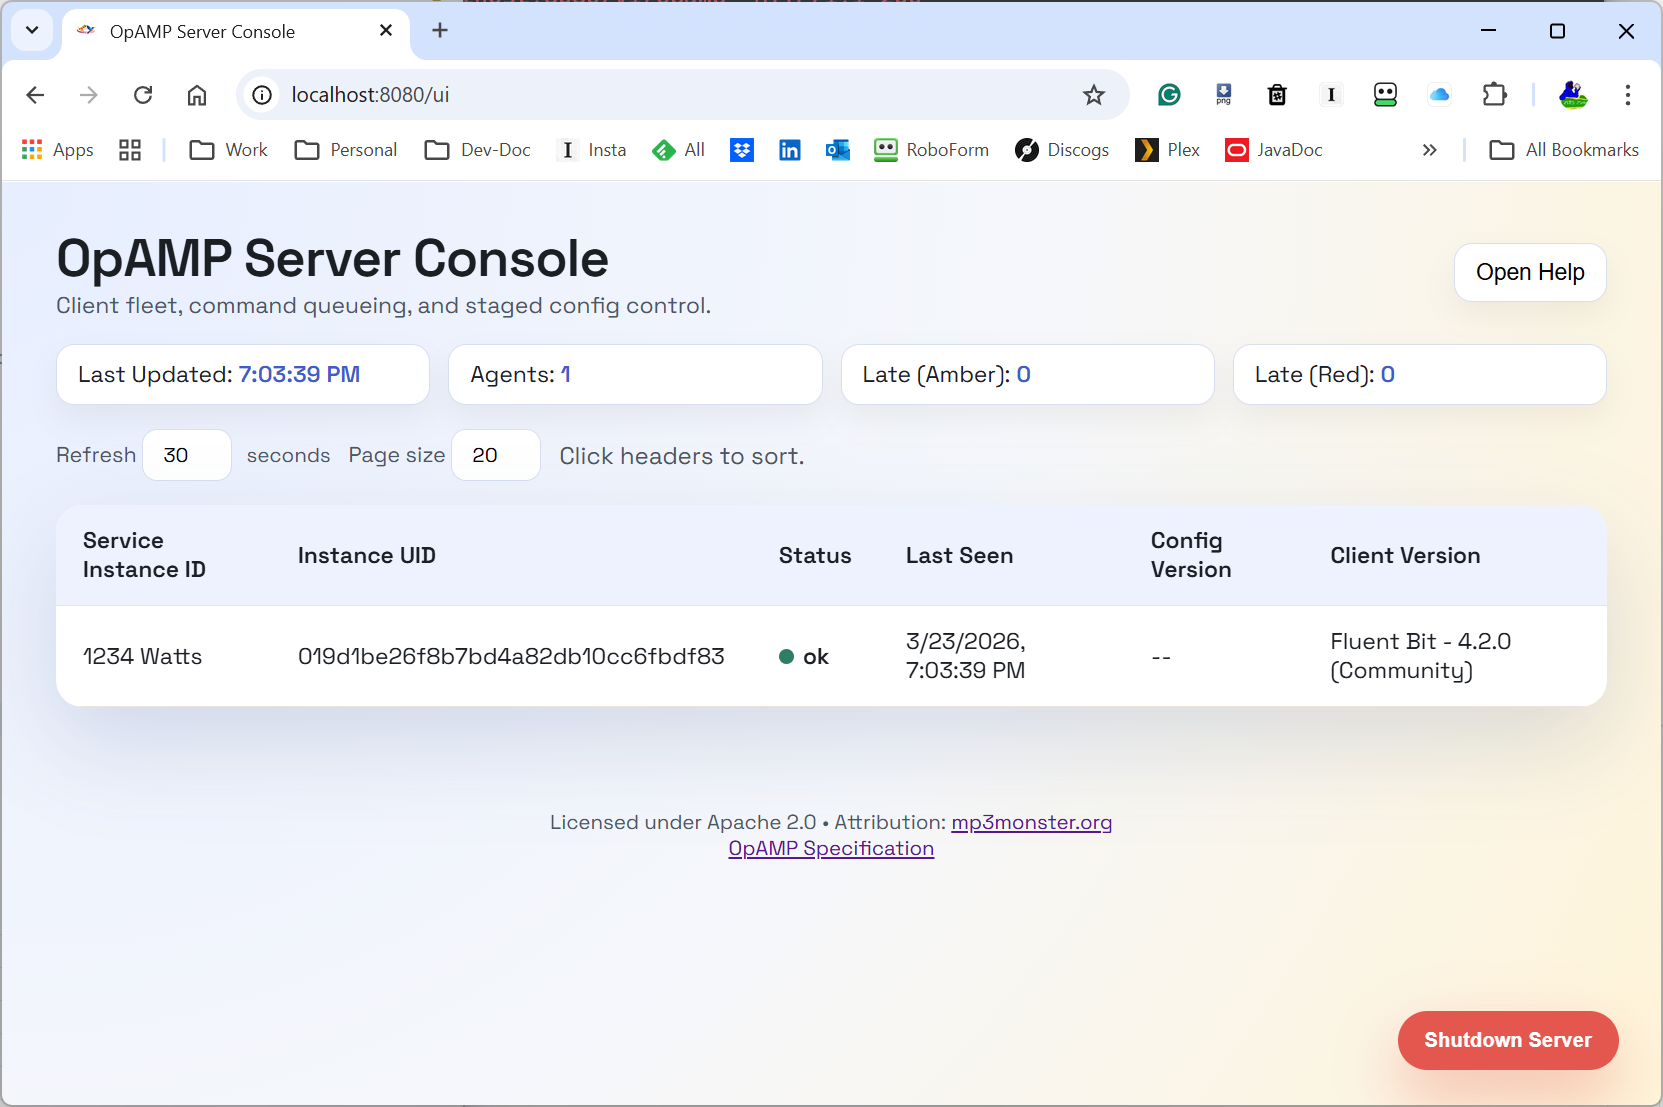
Here is a first server view we can include in the post:
The Server Console with a single Agent
The UI is still evolving, but this gives a concrete picture of the provider side control plane we are discussing.
What the OpAMP server (provider) does
The provider is responsible for the shared view of fleet state and intent.
Today it provides:
OpAMP transport endpoints (/v1/opamp) over HTTP and WebSocket.
API and UI endpoints to inspect clients and queue actions.
In-memory command queueing per client.
Emission of standard command payloads (for example, restart).
Emission of custom message payloads for custom capabilities.
Discovery and publication of custom capabilities supported by the server side command framework.
Operationally, this means we can queue intent once at the server and let the next client poll/connection cycle deliver that action in protocol-native form.
What the supervisor (consumer) does for Fluent Bit
The supervisor is the practical glue between OpAMP and Fluent Bit:
Starts Fluent Bit as a local child process.
Parses Fluent Bit config details needed for status polling.
Polls Fluent Bit local endpoints on a heartbeat loop.
Builds and sends AgentToServer messages (identity, capabilities, health/status context).
Receives ServerToAgent responses and dispatches commands.
Handles custom capabilities and custom messages through a handler registry.
So for Fluent Bit specifically, the supervisor gives us a way to participate in OpAMP now, even before native in-agent OpAMP support is universal.
And to be explicit: this is the current target. Fluentd support is a planned evolution of this same model, not a separate rewrite.
Where ChatOps fits
ChatOps is where this gets interesting for day-2 operations.
In this implementation, ChatOps commands are carried as OpAMP custom messages (custom capability org.mp3monster.opamp_provider.chatopcommand). The provider queues the custom command, and the supervisor’s ChatOps handler executes it by calling a local HTTP endpoint on the configured chat_ops_port.
That gives us a cleaner control path:
Chat/user intent can go to the central server/API.
The server routes to the right node through OpAMP.
The supervisor performs the local action and can return failure context when local execution fails.
This is a stronger pattern than directly letting chat tooling call every node individually, and it opens the door to better auditability and policy controls around who can trigger what.
Reality check: we are still testing
This is important: we are still actively testing functionality.
Current status is intentionally mixed:
Core identity, sequencing, capabilities, disconnect handling, and heartbeat/status pathways are in place.
Some protocol fields are partial, todo, or long-term backlog.
Custom capabilities/message pathways are implemented as a practical extension point and are still being hardened with test coverage and real-world runs.
So treat this as a working framework with proven pieces, not a finished all-capabilities implementation.
What is coming next (based on docs/features.md)
Near-term priorities include:
stricter header/channel validation,
heartbeat validation hardening,
payload validation against declared capabilities,
server-side duplicate websocket connection control behaviour.
Broader roadmap themes include:
authentication/security model for APIs and UI,
persistence in the provider,
richer UI controls for node/global polling and multi-node config push,
certificate and signing workflows,
packaging improvements.
And yes, a key strategic direction is evolving the framework abstraction so it can support Fluentd in due course, not only Fluent Bit. Some feature areas (like package/status richness) make even more sense in that broader collector ecosystem.
Why this matters
OpAMP gives us a standard envelope for control-plane interactions; the server/supervisor split gives us pragmatic deployment flexibility; and ChatOps provides a human-friendly control surface.
Put together, this becomes a useful pattern for managing telemetry agents in real environments where fleets are mixed, rollout velocity matters, and “just redeploy everything” is not always an option.
If you are evaluating this right now, the right mindset is: useful today, promising for tomorrow, and still under active verification as we close feature gaps.
Recently, a question came up on the Fluent Bit Slack group about how the Fluentd Label feature and the associated relabel plugin map from Fluentd to Fluent Bit.
Fluentd Labels are a way to implement event routing, and we’ll look more closely at them in a moment. Both Fluent Bit and Fluentd support the control of which plugins respond to an event by using tags, which are based on a per-plugin basis.
To address this, let’s take a moment to see what Fluentd’s labels do.
What do Fluentd’s Labels Do?
Fluentd introduced the concept of labels, where one or more plugins could be grouped, creating a pipeline of plugins. Events can also be labeled, effectively putting them into a pipeline that can be defined with that label.
As a result, we would see something like:
<input>
  Label myLabel
</input>

<input>
  Label myOtherLabel
</input>

<label myLabel>
    <filter>
         -- do something to the log event
    </filter>

    <filter>
         -- do something to the log event
    </filter>

    <output>
    </output>
</label>

<label myOtherLabel>
    <filter>
         -- do something to the log event
    </filter>

    <output>
    </output>
</label>

<output tagName>
</output>
Fluentd’s labelling essentially tries to simplify the routing of events within a Fluentd deployment, particularly when multiple plugins are needed, aka a pipeline.
Fluent Bit’s routing
Fluent Bit doesn’t support the concept of labels. While both support tags can include wildcards within the tag name, Fluent Bit has an extension that adds power to the routing using tags. Rather than introducing an utterly separate routing control, it extended how tags can be used by allowing the matching to be achieved through regular expressions, which is far more flexible. This could look like (using classic format):
[INPUT]
    Name plugin-name
    Tag  myTag

[INPUT]
    Name another-plugin-name
    Tag  myOtherTag

[INPUT]
    Name alternate-plugin-name
    Tag  myAlternateTag

[OUTPUT]
    Name   output-plugin-name
    Match  myTag

[OUTPUT]
    Name   another-output-plugin
    Match_regex  my[Other|Alternate]Tag
The only downsides to processing regular expressions this way are the potentially greater computational effort (depending on the sophistication of the regular expression) and the use of the match on every plugin.
Migration options
The original question was prompted by the idea of migrating from Fluentd to Fluent Bit. When considering this, Labels don’t have a natural like-for-like transition path.
Often, tags originate from a characteristic or direct attribute of the event message (payload). Instead, treat a tag purely as a routing mechanism, design a hierarchical routing strategy based on domains, and then use your tags for just this purpose. Aligning tags to domains rather than technical characteristics will help.
This creates the opportunity to progressively refactor out the need for labels. this will then make the transition through
REGEX
An alternative to this is to adopt regular expressions to select appropriate tags regardless of their structure, naming convention, or use of case. While this is very flexible, the expressions can be harder to maintain, and if some tags are driven by event data, there is an element of risk (although likely small) of an unexpected event being caught and processed by a plugin as it unwittingly matches a regular expression.
Multiple Fluent Bit Instances
Fluent Bit’s footprint is very small, notably smaller than that of Fluentd, as no runtime components like Ruby are involved. This means we could deploy multiple instances, with each instance acting as an implicit pipeline for events to be processed. The downside is that the equivalent of relabelling is more involved, as you’ll have to have a plugin to explicitly redirect the event to another instance. We also need to ensure that the events start with the correct Fluent Bit node.
Conclusion
When we try to achieve the same behaviour in two differing products that do have feature differences, trying to force a new product to produce exactly the same behaviour can result in decisions that can feel like compromises. In these situations, we tend to forget that we may have made trade-off decisions that led to the use of a feature in the first place.
When we find ourselves in such situations, while it may feel more costly, it may be worth reflecting on whether it is more cost-effective to return to the original problem, design the solution based on the new product’s features, and maximize the benefit.
Fluentd to Fluent Bit Portability a possibility?
This may start to sound like Fluentd to Fluent Bit portability is impossible and requires us to build our monitoring stack from scratch. Based on my experiences, these tools are siblings, not direct descendants, so there will be differences. In the work on building a migration tool (a project I’ve not had an opportunity to conclude), I’d suggest there is an 85/15 match, and migration is achievable, and the bulk of such a task can be automated. But certainly not all, and just seeking a push-button cutover means you’ll miss the opportunity to take advantage of the newer features.
Do you need a migration?
Fluentd may not be on the bleeding edge feature-wise now, but if your existing systems aren’t evolving and demanding or able to benefit from switching to Fluent Bit, then why force the migration? Let your core product path drive the transition from one tool to another. Remember, the two have interoperable protocols – so a mixed estate is achievable, and for the most part will be transparent.
Earlier in the year, I made a utility available that supported the migration from Fluent Bitclassic configuration format to YAML. I also mentioned I would explore the migration of Fluentd to Fluent Bit. I say explore because while both tools have a common conceptual foundation, there are many differences in the structure of the configuration.
We discussed the bigger ones in the Logs and Telemetry book. But as we’ve been experimenting with creating a Fluentd migration tool, it is worth exploring the fine details and discussing how we’ve approached it as part of a utility to help the transformation.
Routing
Many of the challenges come from the key difference in terms of routing and consumption of events from the buffer. Fluentd assumes that an event is consumed by a single output; if you want to direct the output to more than one output, you need to copy the event. Fluent Bit looks at things very differently, with every output plugin having the potential to output every event – the determination of output is controlled by the match attribute. These two approaches put a different emphasis on the ordering of declarations. Fluent Bit focuses on routing and the use of tags and match declarations to control the rounding of output.
We can also see that Fluentd’s directives are more hierarchical (e.g., buffer, and format are within the store) than the structures used by Fluentd Bit, so we need to be able to ‘flatten’ the hierarchy. As a result, it makes sense that where the copy occurs, we’ll define both outputs in the copy declaration as having their own output plugins.
Buffering
There is a notable difference between the outputs’ buffer configurations: in Fluent Bit, the output can only control how much storage in the filesystem can be used. As you can see in the preceding example, we can set the flushing frequency, control the number of chunks involved (regardless of storage type).
Pipelines
Fluentd allows us to implicitly define multiple pipelines of sources and destinations, as ordering of declarations and event consumption is key. ~In addition to this, we can group plugin behavior with the use of the Fluentd label attribute. But the YAML representation of a Fluent Bit doesn’t support this idea.
Fluentd also supports the idea of a secondary output as the following fragment illustrates. If the primary output failed, you could write the event to an alternate location. Fluent Bit doesn’t have an equivalent mechanism. To create a mapping tool, we’ve taken the view we should create a separate output.
The reworked structure requires consideration for the matching configuration, which isn’t so easily automated and can require manual intervention. To help with this, we’ve included an option to add comments to link the new output to the original configuration.
Configuration differences
While the plugins have a degree of consistency, a closer look shows that there are also attributes and, as a result, features of plugins that don’t translate. To address this, we have commented out the attribute so that the translated configuration can be seen in the new configuration to allow manual modification.
Conclusion
While the tool we’re slowly piecing together will do a lot of the work in converting Fluentd to Fluent Bit, there aren’t exact correlations for all attributes and plugins. So the utility will only be able to perform the simplest of mappings without developer involvement. But we can at least help show where the input is needed.
With the Christmas holidays happening, things slowed down enough to sit and catch up on some reading – which included reading Cloud Observability in Action by Michael Hausenblas from Manning. You could ask – why would I read a book about a domain you’ve written about (Logging In Action with Fluentd) and have an active book in development (Fluent Bit with Kubernetes)? The truth is, it’s good to see what others are saying on the subject, not to mention it is worth confirming I’m not overlapping/duplicating content. So what did I find?
Cloud Observability in Action by Michael Hausenblas
Cloud Observability In Action has been an easygoing and enjoyable read. Tech books can sometimes get a bit heavy going or dry, not the case here. Firstly, Michael went back to first principles, making the difference between Observability and monitoring – something that often gets muddied (and I’ve been guilty of this, as the latter is a subset of the former). Observability doesn’t roll off the tongue as smoothly as monitoring (although I rather like the trend of using O11y). This distinction, while helpful, particularly if you’re still finding your feet in this space, is good. What is more important is stepping back and asking what should we be observing and why we need to observe it. Plus, one of my pet points when presenting on the subject – we all have different observability needs – as a developer, an ops person, security, or auditors.
Next is Michael’s interesting take on how much O11y code is enough. Historically, I’ve taken the perspective – that enough is a factor of code complexity. More complex code – warrants more O11y or logging as this is where bugs are most likely to manifest themselves; secondly, I’ve looked at transaction and service boundaries. The problem is this approach can sometimes generate chatty code. I’ve certainly had to deal with chatty apps, and had to filter out the wheat from the chaff. So Michael’s approach of cost/benefit and measuring this using his B2I ratio (how much code is addressing the business problems over how much is instrumentation) was a really fresh perspective and presented in a very practical manner, with warnings about using such a measure too rigidly. It’s a really good perspective as well if you’re working on hyperscaling solutions where a couple of percentage point improvements can save tens of thousands of dollars. Pretty good going, and we’re only a couple of chapters into the book.
The book gets into the underlying ideas and concepts that inform OpenTelemetry, such as traces and spans, metrics, and how these relate to Observability. Some of the classic mistakes are called out, such as dimensioning metrics with high cardinality and why this will present real headaches for you.
As the data is understood, particularly metrics you can start to think about how to identify what normal is, what is abnormal, or an outlier. That then leads to developing Service Level Objectives (SLOs), such as an acceptable level of latency in the solution or how many errors can be tolerated.
The book isn’t all theory. The ideas are illustrated with small Go applications, which are instrumented, and the generated metrics, traces, and logs. Rather than using a technology such as Fluentd or Fluent Bit, Michael starts by keeping things simple and directly connecting the gathering of the metrics into tools such as Prometheus, Zipkin, Jaeger, and so on. In later chapters, the complexity of agents, aggregators, and collectors is addressed. Then, the choices and considerations for different backend solutions from cloud vendor-provided services such as OpenSearch, ElasticSearch, Splunk, Instana and so on. Then, the front-end visualization of the data is explored with tools such as Grafana, Kibana, cloud-provided tools, and so on.
As the book progresses, the chapters drill down into more detail, such as the differences and approaches for measuring containerized solutions vs. serverless implementations such as Lambda and the kinds of measures you may want. The book isn’t tied to technologies typically associated with modern Cloud Native solutions, but more traditional things like relational databases are taken into account.
The closing chapters address questions such as how to address alerting, incident management, and implementing SLOs. How to use these techniques and tools can help inform the development processes, not just production.
So I would recommend the book, if you’re trying to understand Observability (regardless of a cloud solution or not). If you’re trying to advance from the more traditional logging to a fuller capability, then this book is a great guide, showing what, why, and how to evaluate the value of doing so.
To come back to my opening question. The books have small points of overlap, but this is no bad thing, as it helps show how the different viewpoints intersect. I would actually say that the Observability in Action shows how the wider landscape fits together, the underlying value propositions that can help make the case for implementing a full observability solution. Then, Logging in Action and the new book, Fluent Bit with Kubernetes, give you some of the common context, and we drill into the details of how and what can be done with Fluent Bit and Fluentd. All Manning needs now is content to deep dive into Prometheus, Grafana, Jaeger, and OpenSearch to provide an end-to-end coverage of first principles to the art of the possible in Observability.
I also have to thank Michael for pointing his readers and sections of Logging in Action that directly relate and provide further depth into an area.
Development trends have shown a shift towards precompiled languages like Go and Rust away from interpreted or Just-In-Time (JIT) compiled languages like Java and Ruby as it removes the startup time of the language virtual machine and the JIT compiler as well as a smaller memory footprint. All desirable features when you’re scaling containerized solutions and percentage point savings can really add up.
Oracle has been leading the way with its work on GraalVM for some years now, and as a result, not only can GraalVM be used to produce native binary images from Java code, GraalVM also supports TuffleRuby and GraalPy, among others. As TruffleRuby is an open-source project, Oracle isn’t the only vendor contributing to it, work effort has also come from Shopify.
Helping Ruby move forward isn’t new for the Shopify engineering team, and part of that investment is that they have just announced the open-sourcing of a toolchain called Ruvy. Ruvy takes Ruby and creates a WebAssembly (WASM) from it the code. This builds on the existing project ruby.wasm. In doing so they’ve addressed the Ruby startup overhead of the language VM we mentioned. They have also simplified the process of deployment, eliminating the need for Web Assembly System Interface (WASI) arguments, and overcome constraints of class loading by reading files by having the code bundled within the assembly and then accessing the content using WASI-VFS, a simple virtual file system.
The published benchmarks show a massive performance boost in the process of executing where the Ruby code needs to be executed by the packaged JIT. For me, this is interesting as one of the related cloud-native trends is the shift from Fluentd to Fluent Bit. Fluentd was built with Ruby and has a huge portfolio of third-party extensions. But Fluent Bit is built using C to get those performance gains previously described. But it does support plugins through WASM. This raises an interesting question can we take existing Ruby plugins and wrap them so the required interfacing works – which should be minimal and more likely to be impacted by the fact Fluent Bit v2 has refined the internal data structure that was common to both Fluentd and Fluent Bit to allow Fluent Bit to more easily engaged with OpenTelemetry.
If the extra bit of wrapping code isn’t complex, then applying Ruvy should mean the core plugin can then work with Fluent Bit. If this can be templated, then Fluent Bit is going to make a big leap forward with the number of available plugins.
One of the areas I present publicly is the use of Fluentd. including the use of distributed and multiple nodes. As many events have been virtual it has been easy to demo everything from my desktop – everything is set up so I can demo things very easily. While doing this all on one machine does point to how compact and efficient Fluentd is as I can run multiple instances concurrently it does undermine distributed capabilities somewhat.
Add to that I now work for Oracle it makes sense to use OCI resources. With that, I have been developing the scripts to configure Ubuntu VMs to set up the demo environments installing Ruby, Fluentd, and various gems needed and pulling the relevant configurations in. All the assets can be found in the GitHub repository https://github.com/mp3monster/logging-demos. The repository readme includes plenty of information as well.
While I’ve been putting this together using OCI, the fact that everything is based on Ubuntu should mean it can be run locally on VMs, WSL2, and adaptable for MacOS as well. The environment has been configured means you can still run on Ubuntu with a single node if desired.
Additional Log Destinations
As the demo will typically be run on OCI we can not only run the demo with a multinode setup, we have extended the setup with several inclusion files so we can utilize OCI services OpenSearch and OCI Log Analytics. If you don’t want to use these services simply replace the contents of several inclusion files including files with the contents of the dummy_inclusion.conf file provided.
Representation of the Demo setup
The configuration works by each destination having one or two inclusion files. The files with the postfix of label-inclusion.conf contains the configuration to direct traffic to the respective service with a configuration that will push log events at a very high frequency to the destination. The second inclusion file injects the duplication of log events to each service. The inclusion declarations in the main node Fluentd config file references an environment variable that should provide the path to the inclusion file to use. As a result, by changing the environment variable to point to a dummy file it becomes possible o configure out the use of one of the services. The two inclusions mean we can keep the store declarations compact and show multiple labels being used. With the OpenSearch setup, we have a variant of the inclusion file model where the route inclusion can reference the logic that we would use in the label directly within the sore declaration.
The best way to see the use of the inclusions is to experiment with setting the different environment variables to reference the different files and then using the Fluentd dry-run feature (more on this in the book).
Setup script
The setup script performs a number of tasks including:
Pulling from Git all the resources needed in terms of configuration files and folders
Retrieving the necessary plugins against the possibility of their use.
Setting up the various environment variables for:
Slack token
environment variables to reference inclusion files
shortcut environment variables and aliases
network (IP) address for external services such as OpenSearch
Setting up a folder for OCI tokens needed.
Setting up temp folders to be used by OCI Plugins as a file-based cache.
Feeding the log analytics service is a more complex process to set up as the feeds need to have metadata about the events being ingested. The downside is the configuration effort is greater, but the payback is that it becomes easier to extract meaningful information quickly because the service has a greater understanding of the content. For example, attributing the logs to a type of source means the predefined or default log formats are immediately understood, and maximum meaning can be retrieved from the log event.
Going to OCI Log Analytics does cut out the need for the Connections hub, which would allow rules and routing to be defined to different OCI services which functionally can help such as directing log events to PagerDuty.
When configuring Fluentd we often need to provide credentials to access event sources, targets, and associated services such as notification tools like Slack and PagerDuty. The challenge is that we don’t want the credentials to be in clear text in the Fluentd configuration.
Using Env Vars
In the Logging In Action with Fluentd book, we illustrated how we can take the sensitive values from environment variables so the values don’t show up in the configuration file. But, we’ve seen regularly the question of how secure is this, can’t the environment variable be seen by everyone on that machine?
The answer to this question comes down to having a deeper understanding of how environment variables work. There is a really good explanation here. The long and short of it is that environment variables can only be seen by the process that creates the variable and any child process will receive a copy of the parent’s variables.
This means that if we create the variable in a shell, only that shell and any processes launched by that shell can see the environment variable. So as long as we don’t set variables up as part of a system-level configuration then we already have a level of security. So we could wrap the start of Fluentd with a script that sets the environment variables needed. Then everything launches that script.
's Blog")


You must be logged in to post a comment.