's Blog")
NOTE:This utility needs revamping to support IDCS for more see Making Scripts Work with IDCS Deployed PaaS
The Oracle API Platform provides the means to examine statistics and slice and dice the numbers by application, gateway, duration and so on resulting in visually appealing graphical representations. The way the analytics works means you can book mark specific views, so you can return the same report view with the relevant features as often as you like. However, presently there is no data export option.
The question why would I want to export the information comes down to several possible use cases, all of which relate to cost management. The API Platform will eventually have all the desired data views, but now something to help address the following:
- money-tization, we can see which consumer has been using the services by how much and then send the data to a companies accounting systems to invoice the users
- Ability to examine demand and workload over time to create a projection of the likely infrastructure – to achieve this the API statistics need to be overlaid with infrastructure and performance details so we can extrapolate API growth against server workload.
To address these kinds of requirements, we have taken advantage of the fact the API Platform has drunk its own Champagne as they say and made many of the analytics querying APIs publicly available. As with the other API Platform tools, the logic has been written in Groovy, and freely available for use – we’ve covered the code through a Create Common license.
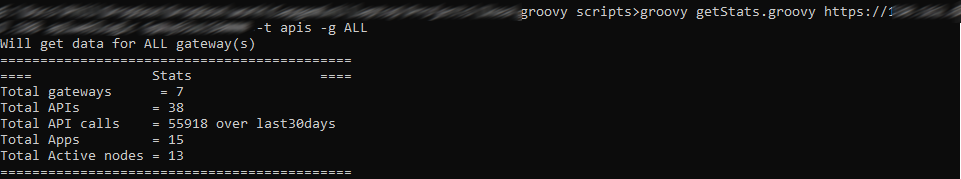
Tool includes a range of parameters to allow the data retrieved into a CSV file having filtered in a number of different ways – which logical gateways to examine, which API or Application(s) to report on. Finally, just to help some basic stats are produced with a count of logical gateways, API calls, APIs defined and Application definitions. The first three factors inform your cloud costs. Together the stats can help Oracle understand your use case. Note that the parameters which impact the CSV generation can also materially impact the reporting numbers.
Parameters:
The 1st three values must always be provided and in the order shown here
- user name to access the source management cloud
- password for the source management cloud
- The server address without any attributes e.g. https://1.2.3.4
All the following values are optional
- -h or -help – provides this information
- -g – Logical gateway to retrieve numbers from e.g. production or development. using ALL with this parameter will result in ALL gateways being examined
- -f – the file to target the CSV data should be written to. If not set then the default of
- -t – indicates whether the data provided should be taken from an APPS perspective or from an API view by passing either APPS | API
- -d – will get script to report more information about what is happening
- -p – reporting period which is defined by a number as follows:
- 0 – Last 365 days – data is given as per month
- 1 – Last 30 days – this is the default if no information is provided – data is given as per day
- 2 – Last 7 days – data is given as per day
- 3 – Last day – data is given as per hour
NB – still testing the utility at this moment – will remove this comment once happy


You must be logged in to post a comment.