• Home
  • Site Aliases
    • www.cloud-native.info
    • oracle.cloud-native.info
    • Phil-Wilkins.uk
  • About
    • Background
    • Presenting Activities
    • Internet Profile
      • LinkedIn
    • About
  • Books & Publications
    • Logging in Action with Fluentd, Kubernetes and More
      • Logging in Action with Fluentd – Book
      • Fluentd Book Resources
      • Log Generator
    • API & API Platform
      • API Useful Resources
    • Oracle Integration
      • Book Website
      • Useful Reading Sources
    • Publication Contributions
  • Resources
    • GitHub
    • Oracle Integration Site
    • Oracle Resources
    • Mindmaps Index
    • Useful Tech Resources
    • Python Setup & related stuff
  • Music
    • Music Reading
    • Music Listening

Phil (aka MP3Monster)'s Blog

~ from Technology to Music

Phil (aka MP3Monster)'s Blog

Tag Archives: monitoring

New Article for SE Daily…

27 Thursday Apr 2023

Posted by mp3monster in ExternalWebPublications, Fluentd, General, Technology

≈ Leave a comment

Tags

Cloud, Hybrid, monitoring, multicloud, observability, SE Daily, Software Engineering Daily

We’ve just had a new article published for Software Engineering Daily which looks at monitoring in multi-cloud and hybrid use cases and highlights some strategies that can help support the single pane of glass by exploiting features in tools such as Fluentd and Fluentbit that perhaps aren’t fully appreciated. Check it out …

Challenges of Multi-Cloud and Hybrid Monitoring

Share this:

  • Twitter
  • Facebook
  • LinkedIn
  • Print
  • Pocket
  • Email
  • Tumblr
  • Reddit
  • Pinterest
  • WhatsApp
  • Skype

Like this:

Like Loading...

Avoid creating an event storm when using social outputs with Fluentd

14 Thursday Apr 2022

Posted by mp3monster in Fluentd, General, Technology

≈ Leave a comment

Tags

Fluentd, logging, mail storm, monitoring, Plugin, social, supress

Fluentd has an incredible catalogue of plugins including notification and collaboration channels from good old-fashioned email through to slack, teams, and others.

The thing to remember if you use these channels is that if you’re sending errors, from application logs it isn’t unusual for there to be multiple error events as a root event can cause a cascade of related issues. For example, if your code is writing transactions to a database and the database goes down with no failover mechanism, then your code will most likely experience an error, roll back the transaction perhaps to some sort of queue, and then try to process the next event. Which will again fail. This is the classic situation where multiple errors will get reported for the same issue. This problem is often referred to as a mail storm given that there was a time when we didn’t have social collaboration tools and everyone used email.

There are several ways to overcome this problem. But the most simple and elegant of these is using the suppress plugin in its filter mode.

<filter **>
  @type suppress
  interval 60       # period in seconds when the condition to supress is triggered
  num 2             # number of occurences of a value before suppressing
  attr_keys source  # the element of the event to consider.
</filter>

In this example if we encounter an event with an attribute called source containing the same value twice then the suppression will kick in for 60 seconds. If you want the key to the valuebeing checked to be the tag then simply omit the attr_keys parameter.

Of course, we don’t want the suppression to kick in if the same value in the attribute keys occured once every few hours. To address this the occurence count is applied over not a time period, but a number of events received by the configuration of max_slot_num which defaults to 10k, but resets

In the filter mode, this plugin is best positionbed immediately before the match block. This means we don’t accidentally suppress messages before they are routed anywhere else.

For the purposes of a demo this is less of an issue. But for a realworld use case would probably benefit from some tuning. All the documentation for this plugin is at https://github.com/fujiwara/fluent-plugin-suppress

Share this:

  • Twitter
  • Facebook
  • LinkedIn
  • Print
  • Pocket
  • Email
  • Tumblr
  • Reddit
  • Pinterest
  • WhatsApp
  • Skype

Like this:

Like Loading...

Blog Post on Oracle.com and more

19 Wednesday May 2021

Posted by mp3monster in General, Oracle, Technology

≈ Leave a comment

Tags

blog, book, Capgemini, conference, Fluentd, IaaS, manning, monitoring, OCI, Oracle, WorldFestival

We recently received an invite to write a guest blog post for Oracle. We’re please to say it has gone live, and can be found at https://blogs.oracle.com/cloud-infrastructure/oracle-cloud-infrastructure-logging-and-alert-rapid-smoke-testing-of-config-and-alerts. A little different to my typical posts. Hope you find it interesting.

Opening of the blog post on blogs.oracle.com
my Author Profile on blogs.oracle.com

World Festival Conference

We’ve also scored another success, this time we’ve been invited to speak at WorldFestival in August, this is an online conference organized by the same team behind DeveloperWeek. This is the first time outside of an Oracle linked event where I’ve been amongst the first few named speakers, so proud of that. The conference looks really interesting as it looks beyond just core developer themes with conference tracks on Space & Transportation, Smart Cities, Robotics, Digital Health to name a few of the 12 streams. Worth checking out.

WorldFestival Conference
World Festival Conference Themes

Share this:

  • Twitter
  • Facebook
  • LinkedIn
  • Print
  • Pocket
  • Email
  • Tumblr
  • Reddit
  • Pinterest
  • WhatsApp
  • Skype

Like this:

Like Loading...

Book Project Unveiled – Unified Logging with Fluentd

03 Wednesday Jun 2020

Posted by mp3monster in Books, Fluentd, General, Technology

≈ Leave a comment

Tags

book, development, Fluentd, logs, manning, MEAP, monitoring, writing

Fluentd is both an open source solution for making log management so much easier to work with, particularly for distributed / multi component solutions. But not only that it is supported by many log analytics tools, and central to several cloud vendors log management services.

The goal of the book is to explain how Fluentd can help us and to use the tool. We can’t cover every possible plugin, so we walk through the use of enough plugins and the way features interact you can extrapolate to other plugins.

Share this:

  • Twitter
  • Facebook
  • LinkedIn
  • Print
  • Pocket
  • Email
  • Tumblr
  • Reddit
  • Pinterest
  • WhatsApp
  • Skype

Like this:

Like Loading...

Mastering FluentD configuration syntax

19 Thursday Sep 2019

Posted by mp3monster in Cloud, Fluentd, General, Technology

≈ Leave a comment

Tags

configuration, Fluentbit, Fluentd, google, GPC, monitoring, observability, OKE, slack

Getting to grips with FluentD configuration which describes how to handle logging event(s) it has to process can be a little odd (at least in my opinion) until you appreciate a couple of foundation points, at which point things start to click, and then you’ll find it pretty easy to understand.

It would be hugely helpful if the online documentation provided some of the points I’ll highlight upfront rather than throwing you into a simple example, which tells you about the configuration but doesn’t elaborate as deeply as may be worthwhile. Of course, that viewpoint may be born from the fact I have reviewed so many books I’ve come to expect things a certain way.

But before I highlight what I think are the key points of understanding, let me make the case getting to grips with FluentD.

Why master FluentD?

FluentD’s purpose is to allow you to take log events from many resources and filter, transform and route logging events to the necessary endpoints. Whilst is forms part of a standard Kubernetes deployment (such as that provided by Oracle and Azure for example) it can also support monolithic environments just as easily with connections working with common log formats and frameworks. You could view it as effectively a lightweight (particularly if you use FluentBit variant which is effectively a pared-back implementation) middleware for logging.

If this isn’t sufficient to convince you, if Google searches are a reflection of adoption, then my previous post reflecting upon Observability -London Oracle Developer Meetup shows a plot reflecting the steady growth.  This is before taking into account that a number of cloud vendors have wrapped Fluentd/fluentbit into their wider capabilities such as Google (see here).

Not only can you see it as middleware for logging it can also have custom processes and adapters built through the use of Ruby Gems, making it very extensible.

FluentD

Remember these points

and mastering the config should be a lot easier…

Continue reading →

Share this:

  • Twitter
  • Facebook
  • LinkedIn
  • Print
  • Pocket
  • Email
  • Tumblr
  • Reddit
  • Pinterest
  • WhatsApp
  • Skype

Like this:

Like Loading...

Observability -London Oracle Developer Meetup

10 Tuesday Sep 2019

Posted by mp3monster in Dev Meetup, Fluentd, General, Technology

≈ 1 Comment

Tags

Fluentd, Istio, Jaeger, Kiali, logging, meetup, monitoring, observability, OKE, OpenTracing, Oracle, Tracing

meetup-monitoringLast night was the London Oracle Developer Meetup’s sessions around observability.  Andrei Cioaca with a focus on the use of OpenTracing as provided by Jaeger, in a standard Kubernetes deployment with Istio – realized with Oracle Kubernetes Engine (OKE).  This was followed by my session on another pillar using logging via FluentD. Also incorporated into standard Kubernetes, but also able to support traditional monolithic use cases.

@andreicioaca starts talking about Oracle #Kubernetes #OKE #istio and #OpenTracing at the #OracleDeveloperMeetup #London @PaaSCommunity pic.twitter.com/HISzpmxjaN

— Phil Wilkins (@PhilConsultant) September 9, 2019

Andrei provided a great overview of the 3 pillars and the strengths and weaknesses of the different pillars. With the basics covered Andrei then dove into the configuration and execution of Istio combined with Jaeger and the corresponding insights available.  including a look at the kinds of visual insights that Jaeger and Kiali provide.  Some probing conversations followed about the relationship to Spring Cloud Sleuth, Open Zipkin and the OpenTracing as a concept more generally.

Andrei’s presentation material can be found in his GitHub repository here.

search-trend-fluentd

Google Analytics on Search Terms

My session followed a pizza break, as there was a delay in its arrival. With everybody having chatted over pizza about OpenTracing, we picked up on FluentD and the Logging aspect to Observability. FluentD, as an open-source project has been growing steadily, and actually baked into several Log Analytics products and services – as the above analytics from Google shows.

The presentation looked at the growing challenges of modern software in terms of making sense of logging.  We explored the capabilities of FluentD before drilling into real-world use cases and potential deployment models.

As you’ll see from the slides we ran a couple of demos. The configuration for the demos can be found at https://github.com/mp3monster/fluentd-demos along with an example payload.

The next meetup we have organized is around Blockchain, all the details can be found at https://www.meetup.com/Oracle-Developer-Meetup-London/events/264661742/.

Other related info …

  • Mastering Distributed Tracing – book review
  • Article direct to LinkedIn – OpenTracing and API Gateways

Share this:

  • Twitter
  • Facebook
  • LinkedIn
  • Print
  • Pocket
  • Email
  • Tumblr
  • Reddit
  • Pinterest
  • WhatsApp
  • Skype

Like this:

Like Loading...

Mastering Distributed Tracing – book review

29 Saturday Jun 2019

Posted by mp3monster in Books, Fluentd, General, Technology

≈ 4 Comments

Tags

CNCF, Jaeger, monitoring, open tracing, Tracing

So recently we have been working on ‘knowing what I don’t know’ when it comes to Open Tracing and how such tech may intersect with traditional logging and the use of FluentD.

As part of that, I have read the Packt book Mastering Distributed Tracing written by Yuri Shkuro who has been key in the OpenTracing API and Jaeger and is the technical lead for Uber’s tracing team.

Whilst I have a good relationship with Packt, the fact they published the book is pretty much coincidental.

Understanding tracing over traditional logging is very important when moving into the world of microservices and reactive frameworks such as Node.js where threads are picked up and put down, you don’t know where and when the next service in a solution will pick up the next related activity. When you add to this solutions are more polyglot than ever – not only in the sense of different languages that may be used but a more diverse source of middle features e.g. historically you’d probably use JMS based messaging if you’re a Java developer and MSMQ for .net. Now you may be using AWS SNS as easily as Kafka. This means the mechanisms for passing and tracing events through these services need to be more unifying than ever.

Complexity of Observability

Continue reading →

Share this:

  • Twitter
  • Facebook
  • LinkedIn
  • Print
  • Pocket
  • Email
  • Tumblr
  • Reddit
  • Pinterest
  • WhatsApp
  • Skype

Like this:

Like Loading...

Oracle Enterprise Manager

23 Wednesday Dec 2015

Posted by mp3monster in Books, General, Oracle, Technology

≈ Leave a comment

Tags

Enterprise Manager, monitoring, OEM, OEMCC, OLL, Oracle, Oracle Learning Library, Packt, Qualogy, SOA

Following my recent blog about Single Pane of Glass & OEM I came across an article which illustrates using the OEM packs to monitor Qualogy; article on OEM.  In addition to this article you can get more material about setting up OEM from the YouTube Oracle Learning Library (OLL) here (in addition to the resources on the Oracle OTN site – here).

Packt also have a book on OEM here, which until the end of December 2015 is also available for only $5 (£4).

I’ve been thinking about working on some material to show how you can use OEM to monitor non Oracle resources.

Share this:

  • Twitter
  • Facebook
  • LinkedIn
  • Print
  • Pocket
  • Email
  • Tumblr
  • Reddit
  • Pinterest
  • WhatsApp
  • Skype

Like this:

Like Loading...

A single pane of glass to manage and monitor with?

19 Thursday Nov 2015

Posted by mp3monster in General, Oracle

≈ 1 Comment

Tags

Cloud Control, Enterprise Manager, monitoring, OEM, Oracle

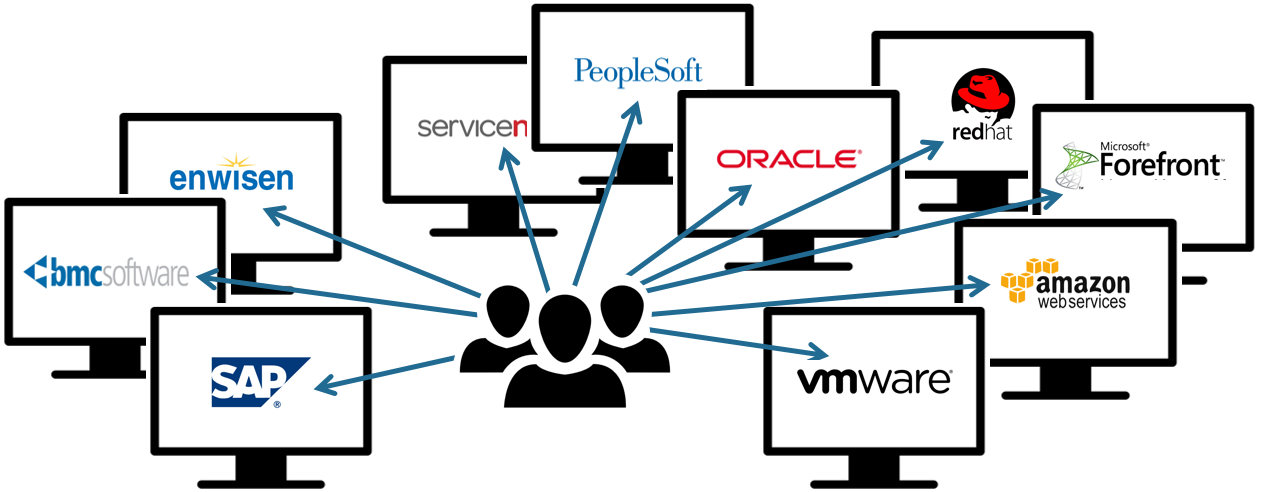
So a strong message for Oracle Enterprise Manager (OEM) Cloud Control is the ‘Single Pane of Glass’ on your IT systems. It isn’t Just Oracle who will make this case, you can expect it from all the general purpose monitoring products ranging from ManageEngine to the CA products and into Nagios. That’s before the general press articles (e.g. InformationWeek). But what I wanted to do is examine the case and potential for OEM to meet this aspiration and the sort of things that will help a tool achieve this magical goal.

Why examine the case? Well some will tell you ‘single pane of glass’ is not the best goal (e.g. TechTarget). In addition to which some vendors have a reputation of being very strong in some specific areas – for example SolarWinds for network monitoring. Finally, it is common for the larger product vendors (IBM/CA/Oracle) to offer monitoring capabilities that are strong for their own products but not so great beyond that (so if you’re running a number of Oracle products the buy OEM; IBM then consider Tivoli Monitoring and so on).

catalog-sprawl

So can OEM reach beyond Oracle products?  What does it offer to do this? Well starting with our first question, the answer is simply yes, it can do more than Oracle. So let’s look at the means through which OEM can reach beyond prebuilt monitoring for its own products.

Firstly, as a Java solution is is naturally able to exploit JMX to the maximum. This is ideal for Java solutions (assuming they are suitably instrumented with MBeans). So your custom java apps running in your Weblogic container can be easily monitored. But this is an ever shrinking estate as more solutions become available from vendors and SaaS providers, and what if you’ve got specialist hardware as could be expected with a manufacturer?

So the next stop is the ability to monitor web services.  OEM provides the tools to generate monitoring configurations that can invoke a web service. The tooling achieves this by parsing a WSDL file which works out what services are available and allowing you to select a service to invoke.  So you can then invoke the service. However the information you capture reflects things like basic performance measures and fault responses.

There is support for the WS-Management standard which is  overseen by the DMTF (Distributed Management Task Force). WS-Management although also ratified as an ISO standard is a bit of an oddity given the majority of WS-* standards are covered by OASIS. That said WS-Management has all the major players you would expect involved (EMC, IBM, Oracle and so on). If you wanted to instrument your product using this protocol then there are open source implementations that may help jump start that initiative. Although it has to be said, that a lot of adoption of this standard has come from OS/platform & hardware vendors. I am unaware of an equivalent capability for REST engagement at present, however the REST framework used by Weblogic can provide additional monitoring insights that could be harvested.

plugindevelopmentdiagram

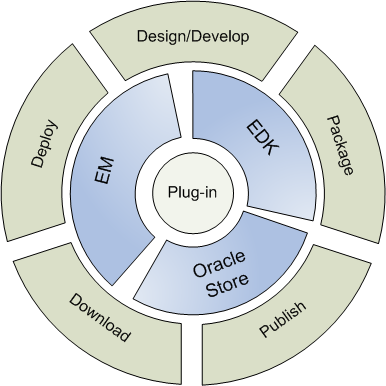
One answer is the Extensibility Development Kit which allows vendors to build their own product plugins for OEM. These can then be offered by the vendors directly or through the Exchange Oracle has provided.  It is worth noting that not all vendors are building these plugins, they may come from third parties. For example there are 2 plugins for F5 BigIP – one from F5 themselves, and another through a software house called Comtrade. If there is a plugin available from a 3rd party rather than a vendor, you do have the opportunity to see if the vendor has used the Oracle Partner programme to validate their plugin (background here). Although I have to say that the Exchange is a disappointing platform. Of course there is nothing to stop customers building their own plugins using this framework.

There is also a .Net specific framework as well to build monitoring for a Windows environment.

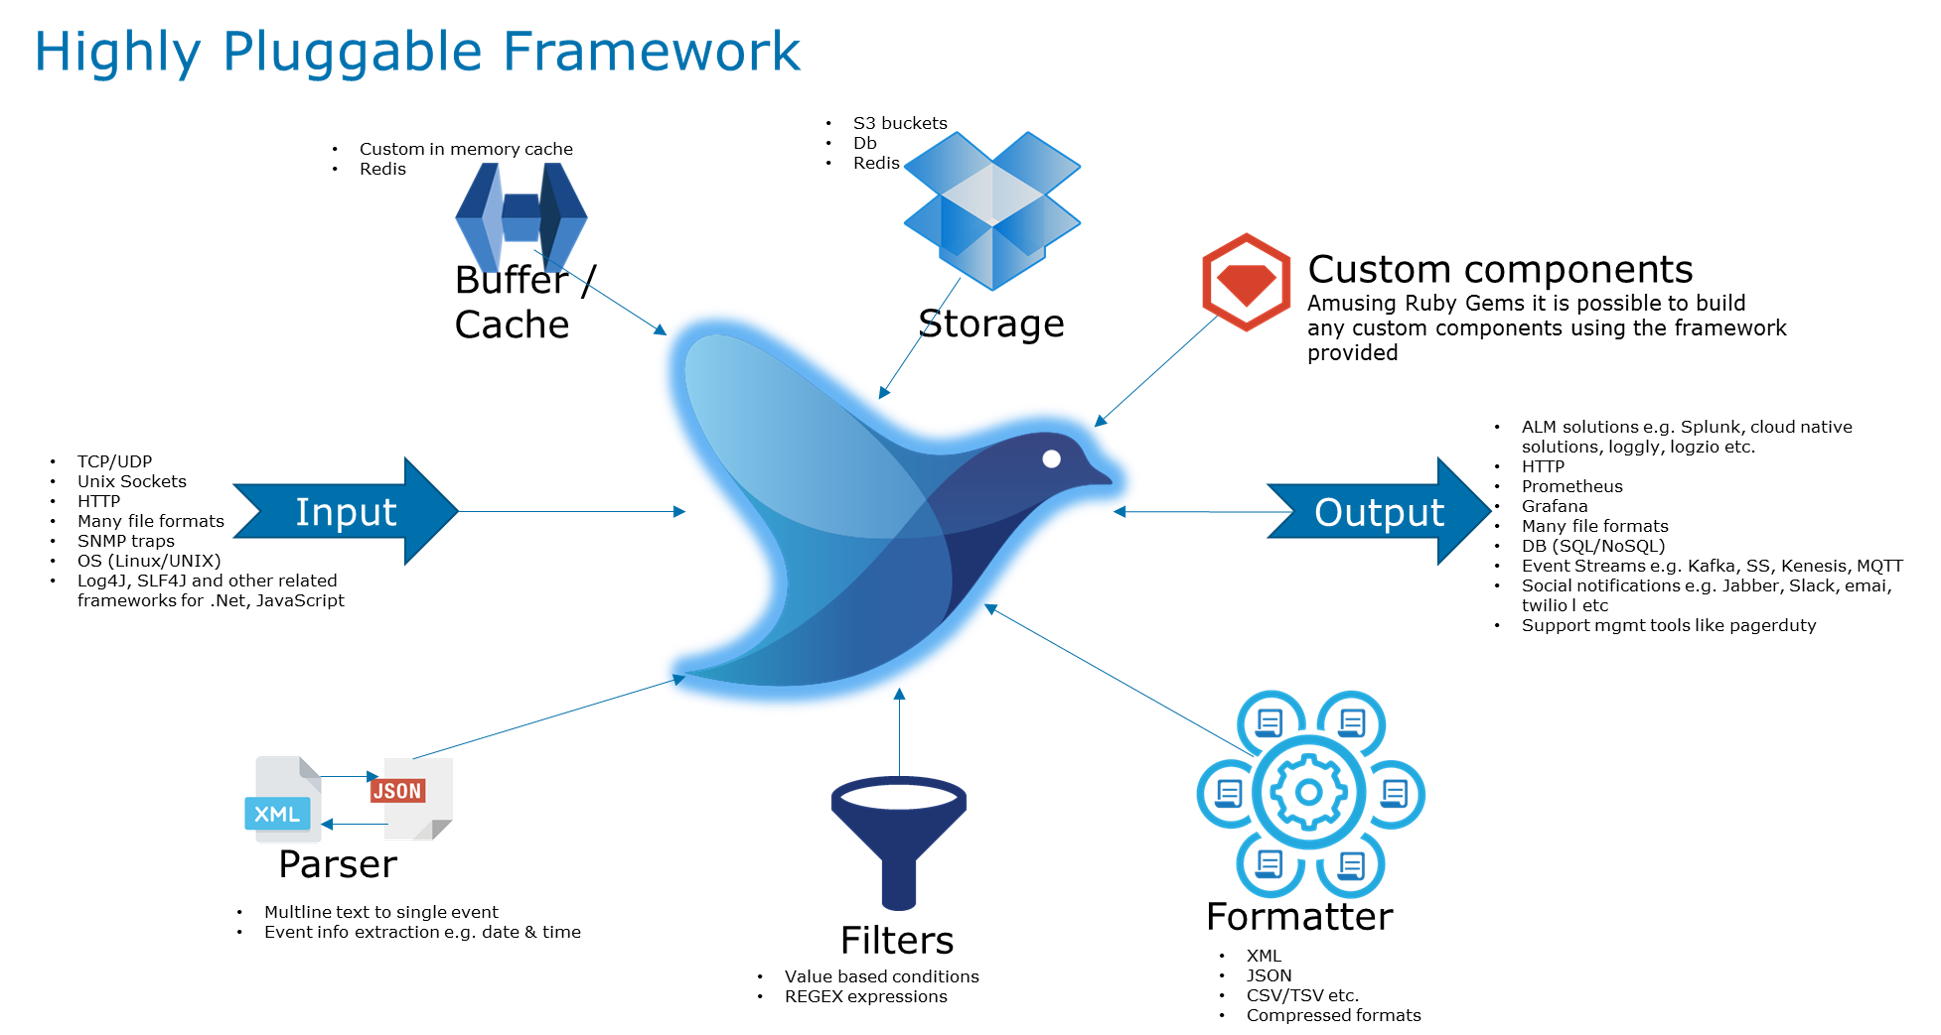
Next option is use of system level information capture so you can hook up SNMP traps, or log file monitoring.  The log file monitoring is relatively simplistic in so far as it effectively tracks a log file scanning for occurrences of that match Perl expressions. This is unfortunately relatively simple compared to some more sophisticated log management mechanisms where you can describe the log file layout and attribute semantic meaning to perform more intelligent log monitoring as a result.

fig1_1

Of course in all this, there is the human perspective which from my experience, when it comes to IT tools things can take on something of a zealous perspective (another being IDEs in the Java world). In Oracle’s perspective an answer other than using OEM as the single pain of glass isn’t desirable. But the reality is that customers will license OEM to make it easy to manage the Oracle products and want to use something else for the single pane.  OEM does accommodate this situation with connectors for Events and Ticketing. Again connectors can be built by other vendors or yourself and the Exchange  offers these as well. Additionally there is a bidirectional exchange connector available for the reversed role, so if you want to bring in additional data such as BAM measures or data points/events from 3rd party tools such as SolarWinds you can.

If you’re going to leverage multiple products you probably want to consider developing a portal for bringing the UIs of the different tools together. So you can start with the single pane view, but as you drill down in analysis of either an operational issue or even just a simple SLA performance failure.

So for on premise systems, even if they’re not out of the box friendly to OEM you can with a bit of effort build out monitoring capabilities from a very quick error detection or occurrence of log messages count through to creating custom extensions that can ‘probe’ more effectively the target. But SaaS is a bit more challenging, you have the Web service invocation capability, although service providers are more and more frequently offering REST interfaces that are JSON conversent.  Beyond again building custom capabilities the next option is to exploit OEM enhancing products such as Real User Experience Insight (RUEI) – a very powerful tool that reaches far beyond the norm of operational monitoring and awareness to provide analytics on websites.

So back to my second question – it is possible to get OEM to offer a single pane of glass?  Unless you’re one of the few organisations that is a pure Oracle only environment then you’re likely to have to configure/build out additional capabilities and potentially invest in additional products (RUEI isn’t presented as a plugin and its capabilities extend beyond that of a plugin) to stand a chance of succeeding.  There is no doubt that OEM offers plenty of extensibility potential – the points of extension go beyond those described here.  It does raise the question of how OEM custom extensions could migrate to the cloud monitoring offering.

We may write a future blog on OEM to show how these plugins can be actually implemented.

OEM Resources:

  • OEM Documentation (general), Extensibility Development Kit
  • OEM Blog
  • OEM Extension Exchange
  • Hooking up SNMP Traps
  • Creating Data Exchange Connectors
  • Web Service Monitoring
  • WS-Management standard
  • .Net specific framework
  • Cloud Monitoring Strategies

Share this:

  • Twitter
  • Facebook
  • LinkedIn
  • Print
  • Pocket
  • Email
  • Tumblr
  • Reddit
  • Pinterest
  • WhatsApp
  • Skype

Like this:

Like Loading...

Oracle IT Strategies and logging 

20 Saturday Jun 2015

Posted by mp3monster in General, ITSO & OEAF, Oracle, Technology

≈ Leave a comment

Tags

accreditation, arcchitecture, autonomics, BCS, Chaos Monkey, ITSO, Kubernetes, monitoring, Netflix, Open Group, semantics, TOGAF, TRM

So I have an objective to get myself certified as an Oracle Technical Architect. Although the training is only open to Oracle and Partners, the exam is open to all.  As you may have guessed from my blog posts I use a lot of Oracle technology. However the Technical Architect examination is based  largely on Oracle’s IT Strategies library, and usually referred to as ITSO. Before non-Oracle users switch off, the ITSO is actually built around presenting solid good solution agnostic practises, and only once that is laid out does the material overlay Oracle products. So at least 75% percent of the material applies regardless of the vendor (yes cynics will say the practises will naturally lead you to products – but hey someone has to be bad guy).  This actually makes it a worthwhile accreditation – as far as any accreditation can go (no I’ve not done a detailed comparison against Open Group’s Certified Architect – very expensive or the BCS accreditation – bound to BCS membership). TOGAF gives your framework, processes, means to communicate, and the ITSO does well at explaining the technical considerations and could be mapped onto the TOGAF Technical Reference Model (TRM) and Standards Information Base (SIB).

The point, I wanted to get across was in the ITSO is an element on Management and Monitoring (E16583-03 if you want the document reference on the Oracle Technology Network). It makes a lot of really good points about monitoring challenges such as bottom up approach where people monitor the parts of the full capability that they’re responsible for, rather than developing monitoring from a business perspective. The rationale for adopting the business based approach is explained (this is not to say you don’t go  into the technical measures & monitors of looking at your infrastructure, databases, services etc. But from the business approach you will capture the information to understand reporting from a user perspective which is how you’ll here about issues.  Through your detailed monitoring decomposition to get the right specific data points you can then look at correlation of monitoring data for root cause analysis, but also see and .

What the I think the document misses, or at least underemphasises is the ever increasing importance of the monitoring and logging of what is happening as systems and environments become ever more elastic and self managing, and have as IBM call it  autonomics. or self healing, self scaling characteristics. So consider trying to diagnose a problem when a user complains of intermittent performance issues, but you have Kubernetes or another tool scaling up your environment for a period and then back down.  Only through measuring from a business context will you able to understand when the user might perceive performance as an issue. Then with  excellent logging and audit data as to what components are doing at all levels – so services maybe behaving perfectly but your scaling mechanisms are scaling back too soon.

This leads to another consideration, for those organisations that absolutely committed to idea of self healing and proving in resilience production, as the famous Netflix Chaos Monkey does. You need to be able to correlate the monkey’s activities to what is happening in your environment. Has the monkey uncovered an issue that manifests in a manner you hadn’t expected and as a result your user see intermittent issues.

This all leads me to a rather good presentation from Jimmi Dyson at RedHat who showed the simple value of ensuring you can get semantic meaning from logging. As that means you and slice and dice the information to get understanding of what is happening and lead to root cause. In Oracle land Oracle Enterprise Manage (OEM) is ensuring the semantic understanding when it come to known products.

I’ve meandered a bit, so key points  consider ITSO or any other vendor equivalent for sources of good practise. Monitor and measure from a business perspective, but still ensure your collecting detailed semantically meaningful metrics.

Share this:

  • Twitter
  • Facebook
  • LinkedIn
  • Print
  • Pocket
  • Email
  • Tumblr
  • Reddit
  • Pinterest
  • WhatsApp
  • Skype

Like this:

Like Loading...
← Older posts

Aliases

  • phil-wilkins.uk
  • cloud-native.info
  • oracle.cloud-native.info

I work for Oracle, all opinions here are my own & do not necessarily reflect the views of Oracle

Oracle Ace Director Alumni

TOGAF 9

Logging in Action

Oracle Cloud Integration Book

API Platform Book


Oracle Dev Meetup London

Categories

  • App Ideas
  • Books
    • Book Reviews
    • manning
    • Oracle Press
    • Packt
  • Enterprise architecture
  • General
    • economy
    • ExternalWebPublications
    • LinkedIn
    • Website
  • Music
    • Music Resources
    • Music Reviews
  • Photography
  • Podcasts
  • Technology
    • APIs & microservices
    • chatbots
    • Cloud
    • Cloud Native
    • Dev Meetup
    • development
      • languages
        • node.js
    • drone
    • Fluentd
    • logsimulator
    • mindmap
    • OMESA
    • Oracle
      • API Platform CS
        • tools
      • Helidon
      • ITSO & OEAF
      • Java Cloud
      • NodeJS Cloud
      • OIC – ICS
      • Oracle Cloud Native
      • OUG
    • railroad diagrams
    • TOGAF
  • xxRetired

My Other Web Content & Contributions

  • Amazon Author entry
  • API Platform
  • Dev Meetup (co-managed)
  • Fluentd Book
  • ICS Book Website
  • OMESA
  • Ora World
  • Oracle Community Directory
  • Packt Author Bio
  • Phil on Blogs.Oracle.com
  • Sessionize Profile

Enter your email address to subscribe to this blog and receive notifications of new posts by email.

Join 2,656 other subscribers

RSS

RSS Feed RSS - Posts

RSS Feed RSS - Comments

June 2023
M T W T F S S
 1234
567891011
12131415161718
19202122232425
2627282930  
« May    

Twitter

Tweets by mp3monster

History

Speaker Recognition

Open Source Summit Speaker

Flickr Pics

Architecture Summit at Bucharest Tech Week conferenceArchitecture Summit at Bucharest Tech Week conferenceArchitecture Summit at Bucharest Tech Week conferenceArchitecture Summit at Bucharest Tech Week conference
More Photos

    Social

    • View @mp3monster’s profile on Twitter
    • View philwilkins’s profile on LinkedIn
    • View mp3monster’s profile on GitHub
    • View mp3monster’s profile on Flickr
    • View philmp3monster’s profile on Twitch
    Follow Phil (aka MP3Monster)'s Blog on WordPress.com

    Blog at WordPress.com.

    • Follow Following
      • Phil (aka MP3Monster)'s Blog
      • Join 221 other followers
      • Already have a WordPress.com account? Log in now.
      • Phil (aka MP3Monster)'s Blog
      • Customize
      • Follow Following
      • Sign up
      • Log in
      • Report this content
      • View site in Reader
      • Manage subscriptions
      • Collapse this bar
     

    Loading Comments...
     

    You must be logged in to post a comment.

      Privacy & Cookies: This site uses cookies. By continuing to use this website, you agree to their use.
      To find out more, including how to control cookies, see here: Our Cookie Policy
      %d bloggers like this: