Tags
configuration, Fluent Bit, logs, metrics, observability, OpAMP, Open Telemetry, OTLP
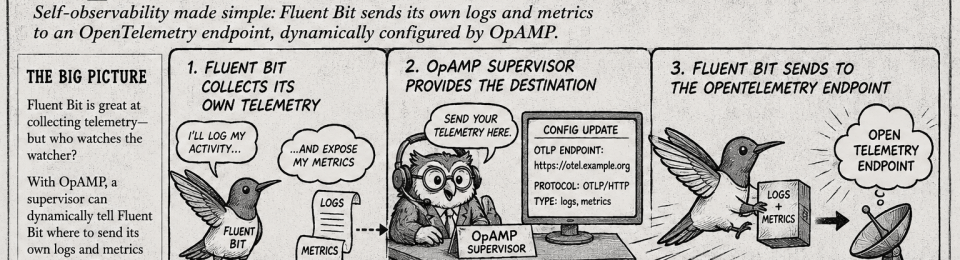
Another aspect of OpenTelemetry’s OpAMP protocol is the ability to share connections details, not just between the server side of the OpAMP protocol, but with other connections a collector like Fluent Bit could be using such as an OTel consumer for logs, traces and metrics that are being collected that could be a managed Grafana service or another Fluent Bit if you’re using a concentrator network.
This is includes Observability data generated by the collector I.e. Fluent Bit in our case.
Yes, but Fluent Bit doesn’t push its own OTel signals
It is true that out of the box Fluent Bit doesn’t push OTel signals for itself. But this is easily fixed. We can control logging, and metrics that are exposed (and today no traces are produced). The solution is simple, we use Fluent Bit itself to collect the logs and metrics and route them to using an OTel output plugin.
While creating a configuration for sharing seems onerous, once you’ve done it once, you can simply include the config file in every deployment. Further more, if you backend for any of the signals is not Fluent Bit conversant, just use a different Fluent Bit plugin.
Config walkthrough
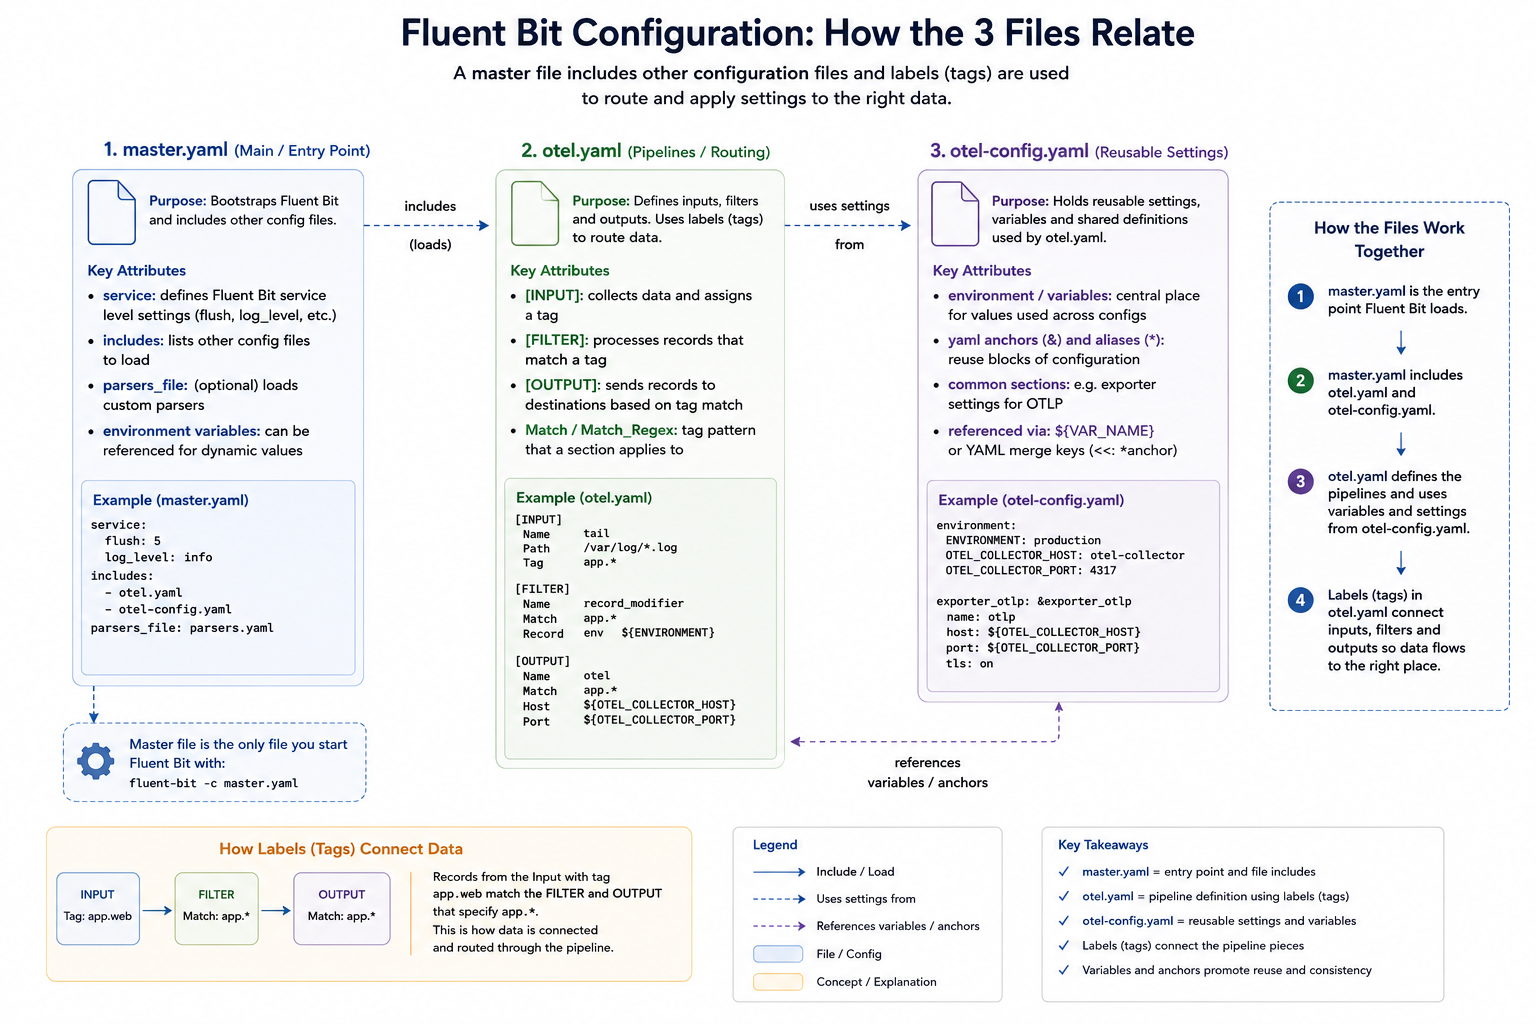
Our configuration consists of several files, which we’ll explain. We’ve adopted a multi-file setup, which works through the use of Fluent Bit’s includes capability so we can separate out the application-level observability configuration (master.yaml), the configuration to allow us to observe Fluent Bit itself (otel.yaml), and the configuration for the connection parameters (otel-config.yaml).
Master.yaml
The master.yaml contains our application observability settings and is the configuration file we pass to Fluent Bit. In this case, we’re simply using a dummy input that’s fed to a file output; we’ve also got a wildcard stdout configuration to make it easy to observe what’s going on from the command line.
includes:
  - otel.yaml

service:
  flush: 1
  log_level: debug
  http_server: ${http_server}
  http_listen: ${http_listen}
  http_port: ${http_port}
  log_file: ${log-file}

pipeline:
  inputs:
    - name: dummy
      tag: dummy.activity
      dummy: '{"message":{"msg":"grafana-cloud test event","service":"fluent-bit","source":"dummy"}}'


  outputs:
    - name: stdout
      match: "*"
      format: json_lines

    - name: file
      match: "dummy.*"
      file: dummy.log
There are at this level, two telltale signs of self-monitoring at this level:
- The includes declaration picks up otel.yaml, which includes additional inputs and outputs, as well as service configurations.
- The service settings that switch on the HTTP server. It is controlled via environment variables, so you could switch this off easily. We have to implement these settings here, as within the full set of file inclusions, there can only be a single service block.
- The service declaration also specifies where we want the log file that the Fluent Bit setup needs to go.
otel.yaml
We’ve separated the pipeline definitions for Fluent Bit observability to reuse the configuration across many deployments. As different deployments may need to talk to different instances of the observability backend (for example, when operating in a multi-cloud arrangement we have defined the environment variables that provide the credentials and target address).
We have defined additional environment variables at this level, so that anyone needing to understand master settings and the service values needs only look here. How this layer (or layers) is established is, to an extent, concealed. It also means we can use OpAMP to generate a configuration file, but we’ll come back to that.
includes:
  - otel-config.yaml

env:
  http_server: on
  http_listen: 0.0.0.0
  http_port: 2020
  log_file: ${own-log-file}

pipeline:
  inputs:
  - name: fluentbit_metrics
    tag: fb.metrics

  - name: tail
    path: ${own-log-file}
    tag: ${own-log-file}

  outputs:
  - name: opentelemetry
    match: "*"
    host: ${otel-host}
    port: 443
    http_user: ${otel-user}
    http_passwd: ${otel-password}
    logs_uri: ${own-otel-logs}
    metrics_uri: ${otel-metrics}
    traces_uri: ${otel-traces}
    tls: on
    tls.verify: off
    log_response_payload: true
    logs_body_key: message
    add_label:
      - environment dev
      - destination grafana-cloud
The environment variables that we define to be used by the master.yaml switch the HTTP server on, and indicate which ports to use. Making this easy to check for the person or people defining the master.yaml makes it easier to avoid port collisions.
We also tell Fluent Bit where to write its logs through the service setting. To consolidate the configuration, that value references a different environment variable, so we can put all of our configurations together. Even if we didn’t have this level of redirection, it is worthwhile setting the value using an environment variable as the file location is needed both as our output for the service and the input for a plugin.. As you can see, we’ve just named the file. So the file created will be relative to wherever we run Fluent Bit from.
Let’s look at the inputs and outputs being used, and what they do:
- Tail – this is the input that reads Fluent Bit’s logs, as we set Fluent Bit to log at debug level, we’ll see plenty of activity. Having Fluent Bit write to the file system, only for a thread in the same process to read it, is obviously inefficient. It can be optimised by using a RAMFS-like filesystem on Linux and a RAMDisk-like filesystem on Windows, so everything is in memory.
- Fluentbit_metrics – this is the active collection of metrics, which we simply point to the server part of Fluent Bit. If you’re using Fluent Bit as a sidecar in a pod, this has to be done carefully because of how networking for containers within a pod is handled.
- opentelemetry – This takes our different input signals we’ve been collecting and pushes them to the OTel-compliant service. If we had different backend products for different types of signals, then we’d need different or multiple plugins defined. Although OpAMP does infer an OTel-compliant backend.
That is the hard bit done. As a result of these inputs, we get the metrics and logs (and no traces are available). We now just need an OpenTelemetry output plugin to direct all the OTLP-represented signals. For simplicity, we’ve made use of a free account on Grafana Cloud.
otel-config.yaml
This configuration file is simple, which is key to making it easy for us to manage the connections setup using OpAMP. It simply defines the connection-based attributes needed, as shown:
env: otel-user: '-my Grafana Cloud Accound Id-' otel-password: '-my Grafana Cloud Account Token-' otel-logs: '/otlp/v1/logs' otel-metrics: '/otlp/v1/metrics' otel-traces: '/otlp/v1/traces' own-log-file: 'flb.log' otel-host: 'otlp-gateway-prod-gb-south-1.grafana.net'
While populating credentials in a file isn’t ideal, it makes it pretty straightforward for an OpAMP Client (observer or supervisor) to receive the credentials for the management side of the protocol, make them available to Fluent Bit quickly, and have Fluent Bit pick them up dynamically via hot-deploy functionality. This is precisely what we have implemented in our OpAMP. This approach works for both Fluent Bit and Fluentd configurations and we can even apply a similar approach for driving clients such as Elastic Beats.
This configuration file is simple enough that we can rewrite it whenever the configuration values are amended; there is no complexity in inserting such settings into the broader configuration. Furthermore, if Fluent Bit were running as an observed process rather than a supervised (i.e., child) process, setting environment variables could become problematic.
We can mitigate credential-related challenges in the file system by restricting filesystem permissions to the file being written, so only certain users and processes can access it. When working with containers, we can also keep this part of the file system within the image by using a transient storage layer.
Alternative strategy for securing credentials
An alternative approach would be for the client to receive the credentials and store them in an encrypted method, such as a credentials vault, and then the launcher for the process would read and decrypt the file as it launches Fluent Bit or another collector. The way we have implemented the client for our OpAMP certainly makes this possible, but it also complicates the process and suggests that the mechanics of credential management would be better handled by a distributed vault solution.
OpAMP’s assumption
The only niggle, is that when passing the connections, the protocol assumes that connection details are only needed for the collector. That’s fine if the collector includes the client side of the protocol. But as we know, the collector may be managed with a supervisor or observer process. We could use the connection for the collector and our supervisor, but that may not be what is wanted.
Visualising the configuration
We can visualise the relationships, like this:
Unpacking the server-side aspects
As you start to think about the server aspect of this, it gets potentially very complex. In simple scenarios, sending everything to a single Observability backend isn’t an issue.
But if you’re managing a multi-cloud, hybrid, or managed client setup, you’re likely to want separate backend instances for different collectors. In our setup, that means passing the different connection details to the client to populate otel-config.yaml. Understanding this deployment will require understanding the distribution. We will also need to manage potentially a concentrated catalogue of credentials, which will need to map to the collector nodes, and a means for the user to define the mapping. Creating a means to visualise the mapping, and ideally to allow the server to apply rules or infer assignments for more complex use cases such as multi-cloud, isn’t going to be simple.
Conclusion
We have a simple means to deploy configuration and observe our collector and the supervisor/observer process. Making server-side management in a large-scale environment easy to work with will require some consideration and potentially additional optional metadata. But the protocol supports all of this, but doesn’t mandate specifics. Which does mean that either the server has to be smart enough to know when what to do if it interacts with a client that has been built or configured to work with this server – which is an essential requirement, otherwise we lose the value of the


You must be logged in to post a comment.