There are several things that separate the turn-key/commercial observability solutions from the pure open source options. The most visible of these are:
Fleet management of you agents, particularly when working outside of a Kubernetes ecosystem
Deployed services and applications with default monitoring configuration
Prebuilt dashboards
While the issue of fleet management is a subject I’ve covered at length with OpAMP. We’ve not looked so closely at the discovery and automation. While the OpAMP server (and standalone option) provides schema driven editor, the key separation is to drive the configuration based on finding what solutions are deployed.
This process can look very sophisticated, but there are a number of open source tools that can help address it pretty easily. By bringing therse tools together we can achieve the same effect of detect and configure agents. At this stage we’re not looking at the backend of creating out of the box dashboards, but the potential to evolve the approach is there.
Detecting and Generating Configuration
The process we need has the following steps:
find the deployed solution(s)
Understand how they are deployed
Generate a configuration based on the detection
Push the configuration out to agents
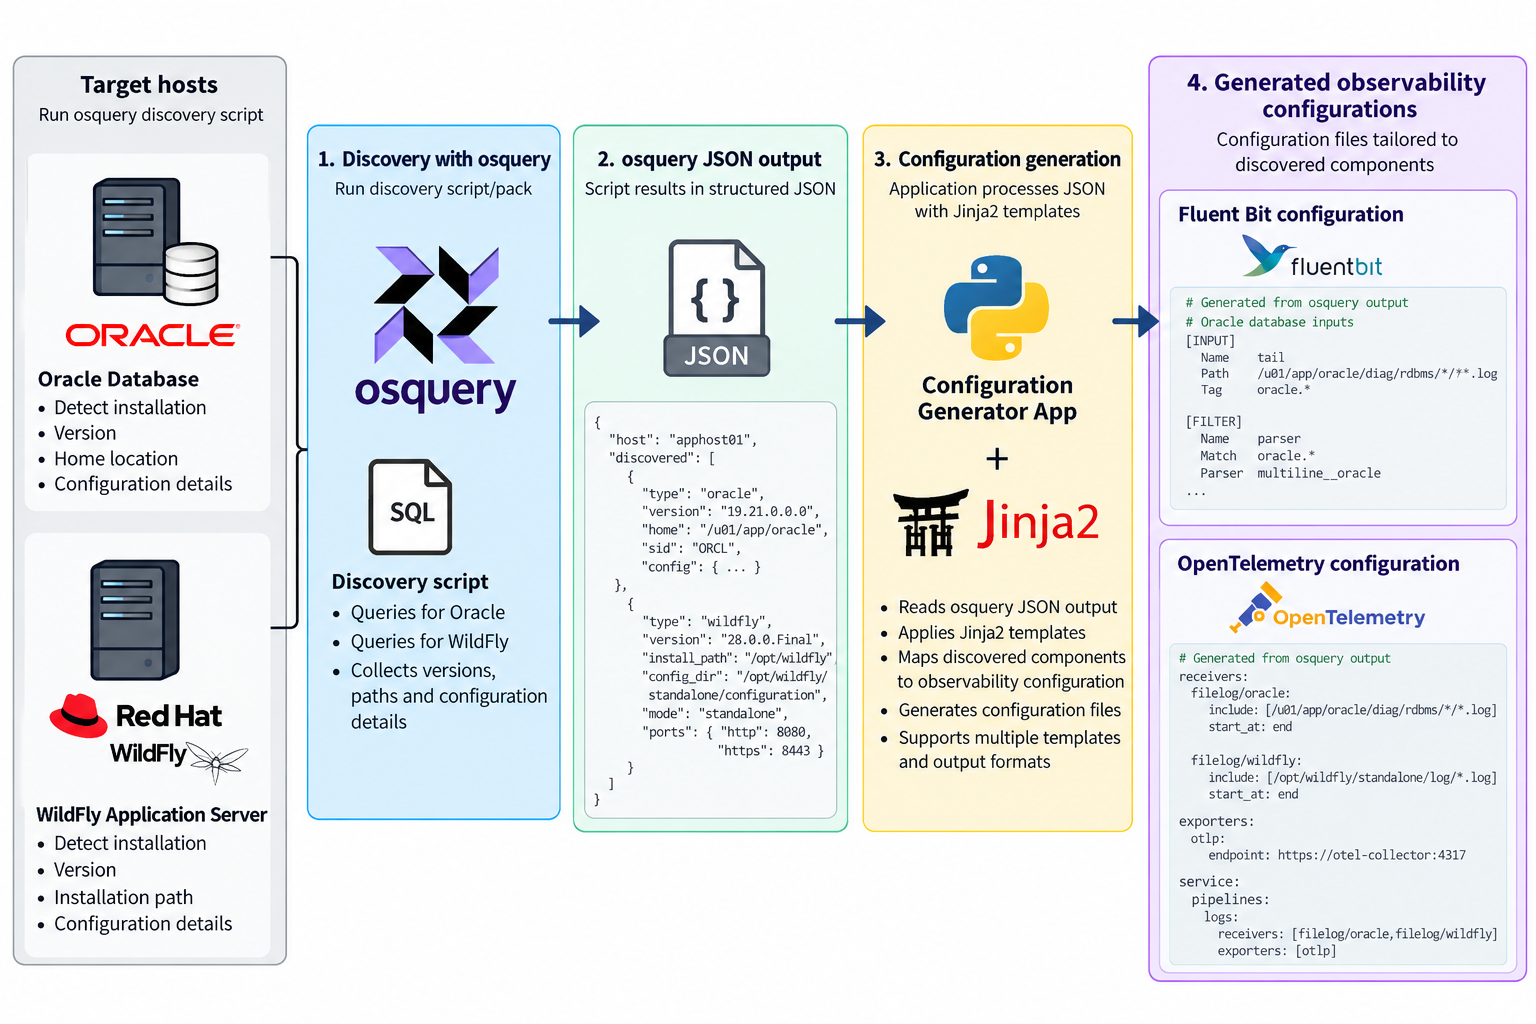
Detect and capture config
One of the more active solutions that provides a means to detect deployments, and find configurations in this space is OSQuery, which is used by some serious players (Airbnb, Dropbox, Netflix, Palantir, Etsy, and Uber are just a few). OSQuery is particularly appealing solution because of its ease of use. All the information OSQuery can make available is accessible through the use of SQL including all the power SQL provides to mix data together.
While SQL is powerful, we do want to return the results in an easily consumable manner, so the CLI tool allows us to ask for the result to be returned in JSON. This makes the result easy to work with and we can use it with technologies such as JSONPath, particularly if we can impose a defined schema on the output, something that can be done as we know the queries being run, and can use constructs such as select … as …
As we can query the JSON output to retrieve the relevant parts of the output, for example the result of the queries to look for an Oracle Database or a RedHat/IBM WildFly application server. We can then combine that data with a template, such as the templating capabilities of Jinja2. The template defines the configuration that we would want to use, for example we want to tail log files, we want to establish a Prometheus metrics pull. Then the values are pulled from the JSON to create an instance of the file.
Templates make the result reusable
By using templates, known queries and their result structures we can generate reusable configurations on a product by product basis. The last step is stitching it together. To be reusable each template is discrete for an application or standard stack. So we up with multiple configuration files that need to be combined. This could be addressed by simply merging all the files together, but a lot of the observability tools such as Fluent Bit and Fluentd provide the ability to include files. Obviously you still need to work out what to include to combine, but this pretty straight forward.
There are limits
So this brings together all the sources, for destination side for the turn key solutions is known as the backend is the core product. In the open source solution you’re probably going to run multiple tools, so you need to have a more advanced routing. You can create a standard backend routing and include it.
Convenience as a weakness?
While having turn-key solutions, makes setup so much easier, could it also be a weakness? As we can see with our automation, we’ve not got tailoring to filter data in the pipeline, or park it out of the way. Which ratchets up the costs, because of the retention costs, and greater computational effort to trawl the data. Nor can we derive new signals through correlation inflight. But then our approach with templating creates the same challenge, BUT this approach doesn’t preclude you from incorporating into the solution such smarts.
Backend Bootstrapping
Rapid configuration of the backend is going to be a bit harder because the chances are you’re wanting to mix and match the backend tools (one of the strengths of not going down a turnkey adoption). We’ll explore the possibilities of making this step easier in another post.
Another aspect of OpenTelemetry’s OpAMP protocol is the ability to share connections details, not just between the server side of the OpAMP protocol, but with other connections a collector like Fluent Bit could be using such as an OTel consumer for logs, traces and metrics that are being collected that could be a managed Grafana service or another Fluent Bit if you’re using a concentrator network.
This is includes Observability data generated by the collector I.e. Fluent Bit in our case.
Yes, but Fluent Bit doesn’t push its own OTel signals
It is true that out of the box Fluent Bit doesn’t push OTel signals for itself. But this is easily fixed. We can control logging, and metrics that are exposed (and today no traces are produced). The solution is simple, we use Fluent Bit itself to collect the logs and metrics and route them to using an OTel output plugin.
While creating a configuration for sharing seems onerous, once you’ve done it once, you can simply include the config file in every deployment. Further more, if you backend for any of the signals is not Fluent Bit conversant, just use a different Fluent Bit plugin.
Config walkthrough
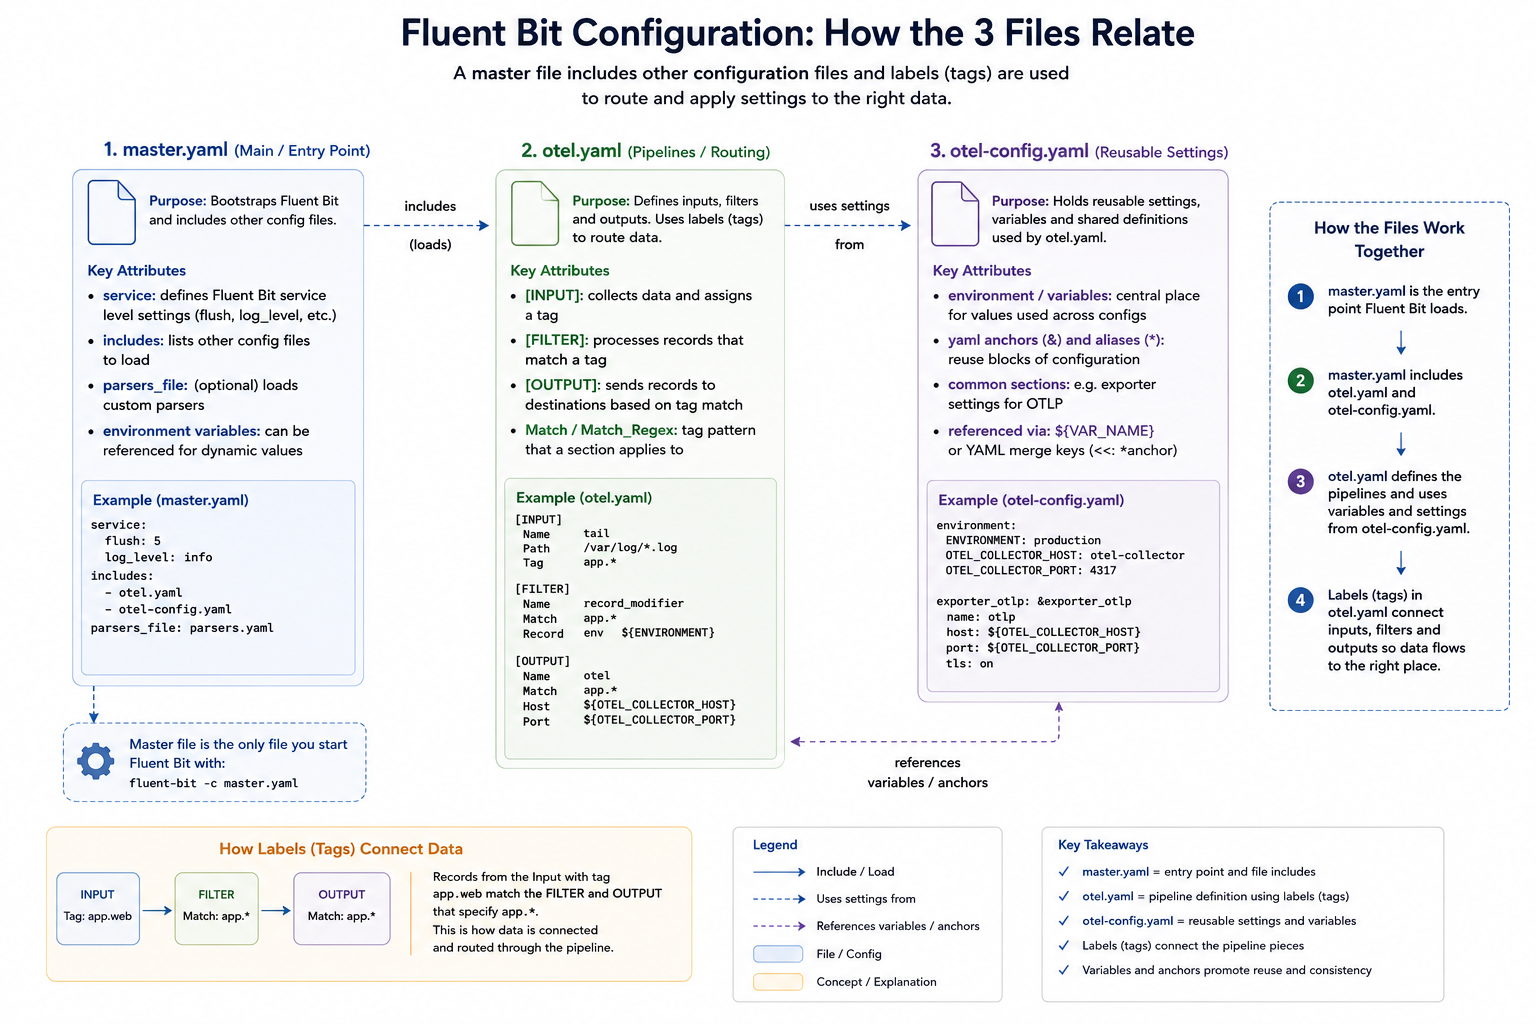
Our configuration consists of several files, which we’ll explain. We’ve adopted a multi-file setup, which works through the use of Fluent Bit’s includes capability so we can separate out the application-level observability configuration (master.yaml), the configuration to allow us to observe Fluent Bit itself (otel.yaml), and the configuration for the connection parameters (otel-config.yaml).
Master.yaml
The master.yaml contains our application observability settings and is the configuration file we pass to Fluent Bit. In this case, we’re simply using a dummy input that’s fed to a file output; we’ve also got a wildcard stdout configuration to make it easy to observe what’s going on from the command line.
There are at this level, two telltale signs of self-monitoring at this level:
The includes declaration picks up otel.yaml, which includes additional inputs and outputs, as well as service configurations.
The service settings that switch on the HTTP server. It is controlled via environment variables, so you could switch this off easily. We have to implement these settings here, as within the full set of file inclusions, there can only be a single service block.
The service declaration also specifies where we want the log file that the Fluent Bit setup needs to go.
otel.yaml
We’ve separated the pipeline definitions for Fluent Bit observability to reuse the configuration across many deployments. As different deployments may need to talk to different instances of the observability backend (for example, when operating in a multi-cloud arrangement we have defined the environment variables that provide the credentials and target address).
We have defined additional environment variables at this level, so that anyone needing to understand master settings and the service values needs only look here. How this layer (or layers) is established is, to an extent, concealed. It also means we can use OpAMP to generate a configuration file, but we’ll come back to that.
The environment variables that we define to be used by the master.yaml switch the HTTP server on, and indicate which ports to use. Making this easy to check for the person or people defining the master.yaml makes it easier to avoid port collisions.
We also tell Fluent Bit where to write its logs through the service setting. To consolidate the configuration, that value references a different environment variable, so we can put all of our configurations together. Even if we didn’t have this level of redirection, it is worthwhile setting the value using an environment variable as the file location is needed both as our output for the service and the input for a plugin.. As you can see, we’ve just named the file. So the file created will be relative to wherever we run Fluent Bit from.
Let’s look at the inputs and outputs being used, and what they do:
Tail – this is the input that reads Fluent Bit’s logs, as we set Fluent Bit to log at debug level, we’ll see plenty of activity. Having Fluent Bit write to the file system, only for a thread in the same process to read it, is obviously inefficient. It can be optimised by using a RAMFS-like filesystem on Linux and a RAMDisk-like filesystem on Windows, so everything is in memory.
Fluentbit_metrics – this is the active collection of metrics, which we simply point to the server part of Fluent Bit. If you’re using Fluent Bit as a sidecar in a pod, this has to be done carefully because of how networking for containers within a pod is handled.
opentelemetry – This takes our different input signals we’ve been collecting and pushes them to the OTel-compliant service. If we had different backend products for different types of signals, then we’d need different or multiple plugins defined. Although OpAMP does infer an OTel-compliant backend.
That is the hard bit done. As a result of these inputs, we get the metrics and logs (and no traces are available). We now just need an OpenTelemetry output plugin to direct all the OTLP-represented signals. For simplicity, we’ve made use of a free account on Grafana Cloud.
otel-config.yaml
This configuration file is simple, which is key to making it easy for us to manage the connections setup using OpAMP. It simply defines the connection-based attributes needed, as shown:
While populating credentials in a file isn’t ideal, it makes it pretty straightforward for an OpAMP Client (observer or supervisor) to receive the credentials for the management side of the protocol, make them available to Fluent Bit quickly, and have Fluent Bit pick them up dynamically via hot-deploy functionality. This is precisely what we have implemented in our OpAMP. This approach works for both Fluent Bit and Fluentd configurations and we can even apply a similar approach for driving clients such as Elastic Beats.
This configuration file is simple enough that we can rewrite it whenever the configuration values are amended; there is no complexity in inserting such settings into the broader configuration. Furthermore, if Fluent Bit were running as an observed process rather than a supervised (i.e., child) process, setting environment variables could become problematic.
We can mitigate credential-related challenges in the file system by restricting filesystem permissions to the file being written, so only certain users and processes can access it. When working with containers, we can also keep this part of the file system within the image by using a transient storage layer.
Alternative strategy for securing credentials
An alternative approach would be for the client to receive the credentials and store them in an encrypted method, such as a credentials vault, and then the launcher for the process would read and decrypt the file as it launches Fluent Bit or another collector. The way we have implemented the client for our OpAMP certainly makes this possible, but it also complicates the process and suggests that the mechanics of credential management would be better handled by a distributed vault solution.
OpAMP’s assumption
The only niggle, is that when passing the connections, the protocol assumes that connection details are only needed for the collector. That’s fine if the collector includes the client side of the protocol. But as we know, the collector may be managed with a supervisor or observer process. We could use the connection for the collector and our supervisor, but that may not be what is wanted.
Visualising the configuration
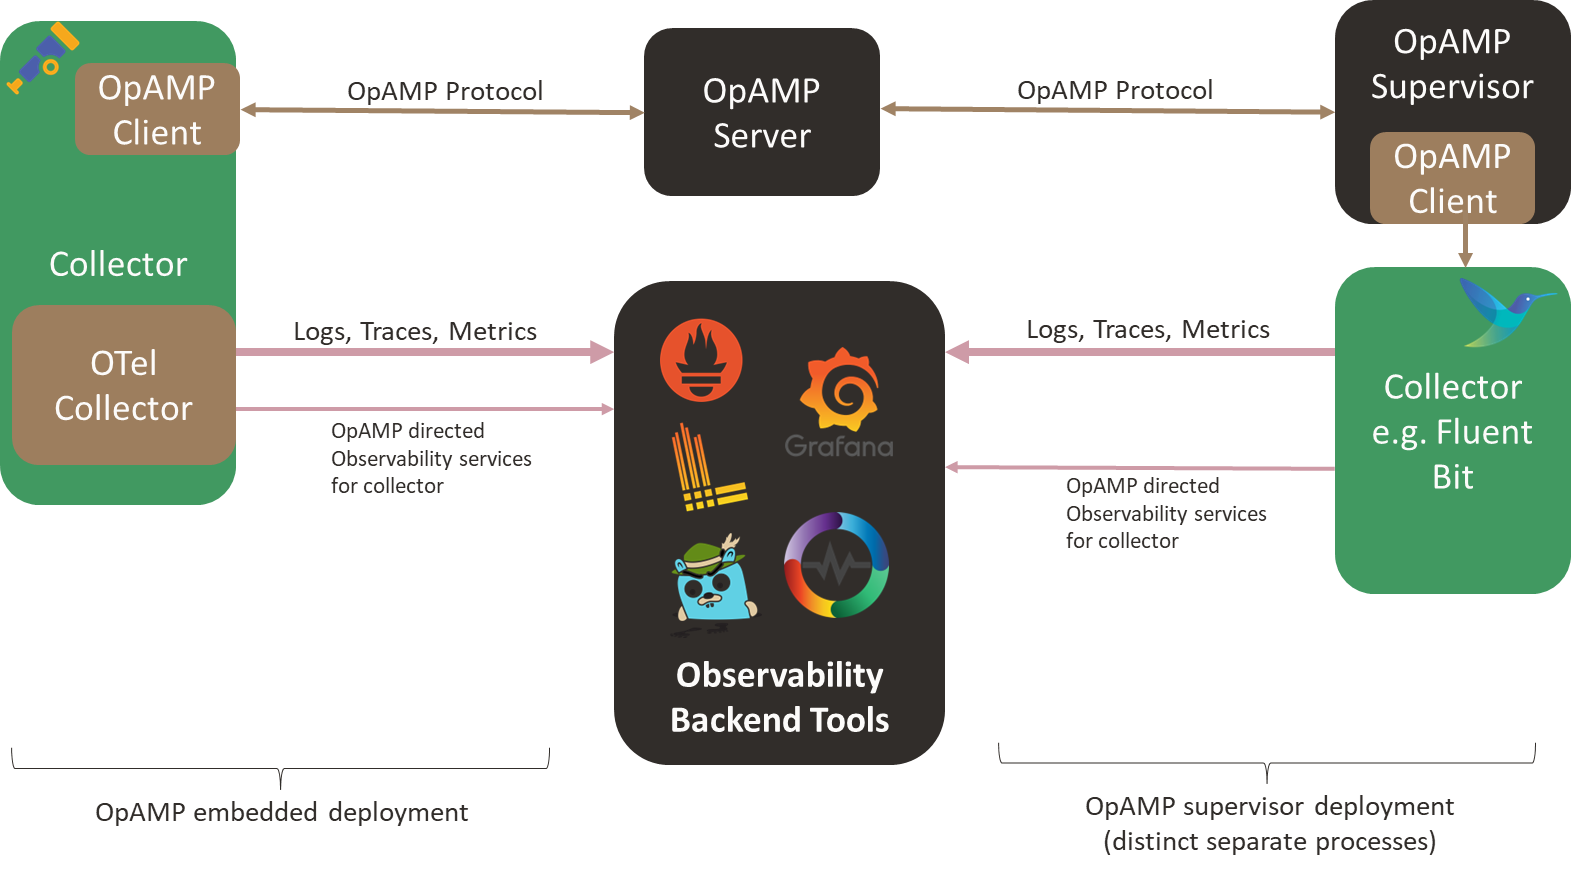
We can visualise the relationships, like this:
Unpacking the server-side aspects
As you start to think about the server aspect of this, it gets potentially very complex. In simple scenarios, sending everything to a single Observability backend isn’t an issue.
But if you’re managing a multi-cloud, hybrid, or managed client setup, you’re likely to want separate backend instances for different collectors. In our setup, that means passing the different connection details to the client to populate otel-config.yaml. Understanding this deployment will require understanding the distribution. We will also need to manage potentially a concentrated catalogue of credentials, which will need to map to the collector nodes, and a means for the user to define the mapping. Creating a means to visualise the mapping, and ideally to allow the server to apply rules or infer assignments for more complex use cases such as multi-cloud, isn’t going to be simple.
Conclusion
We have a simple means to deploy configuration and observe our collector and the supervisor/observer process. Making server-side management in a large-scale environment easy to work with will require some consideration and potentially additional optional metadata. But the protocol supports all of this, but doesn’t mandate specifics. Which does mean that either the server has to be smart enough to know when what to do if it interacts with a client that has been built or configured to work with this server – which is an essential requirement, otherwise we lose the value of the
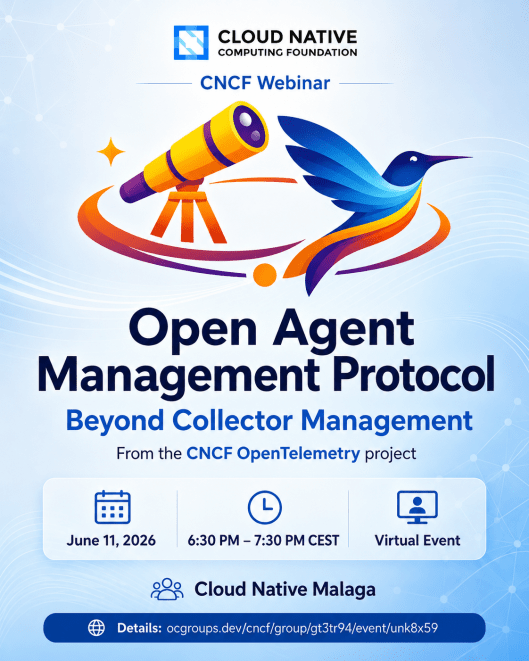
A short post, I’m excited to share that I will be presenting a Webinar for the CNCF Malaga meetup on the 11th June 6.30pm CEST where I’ll be talking about OpAMP – registration link.
I hope you can join me to hear about the value of the OpAMP protocol, which originated from the CNCF OpenTelemetry project. I’ll be talking about what the protocol can do for us, how it works, and while it has origins within the OpenTelemetry project, it has far-reaching value for almost any deployment context.
This isn’t all theory, I’ll be demoing the functionality we’ve built that leverages the OpAMP spec. While the focus will be on Fluent Bit, it will convey the value of the protocol. We’ll also look at how it can scale in both volume and the range of client applications it can support.
Fluent Bit and OpenTelemetry’s Collector (as well as many other observability tools) are designed to use a distributed/agent model for deployment. This model can pose challenges, including ensuring that all agents are operating healthily and correctly configured. This is particularly true outside of a Kubernetes ecosystem. But even within a Kubernetes ecosystem, more than basic insights are required (for example, is it running flat out or over-resourced). Fluent Bit exposes its own metrics and logs so that you can either configure Fluent Bit to forward the metrics and logs to an endpoint (or allow Prometheus to scrape the metrics).
As we’re usually using Fluent Bit to collect data and route it to tools like Prometheus, Grafana, etc., or perhaps a more commercial product. So it makes sense that Fluent Bit is also sharing its own status and health.
When it comes managing the configuration of Fluent Bit, we have lots of options for Kubernetes deployments (from forcing pod replacement, to sharing configurations via persistent volume claims, and Fluent Bit reloading configs), but given that Observability needs to operate on simple virtualized and bare metal scenarios, and not everything can be treated as dynamically replaceable more general strategies such as GITOps and potentially using Istio (yes, there really good use cases for Istio outside of Kubernetes) are available. But there is also more advanced tooling, such as Puppet, Chef, and Ansible.
The challenge is non of these tools provides out-of-the-box capabilities to fully exploit the control surface that OTel Collectors and Fluent Bit offer. So the OpenTelemetry community has elected to develop a new standard called OpAMP, which fits snuggly into the OTel ecosystem.
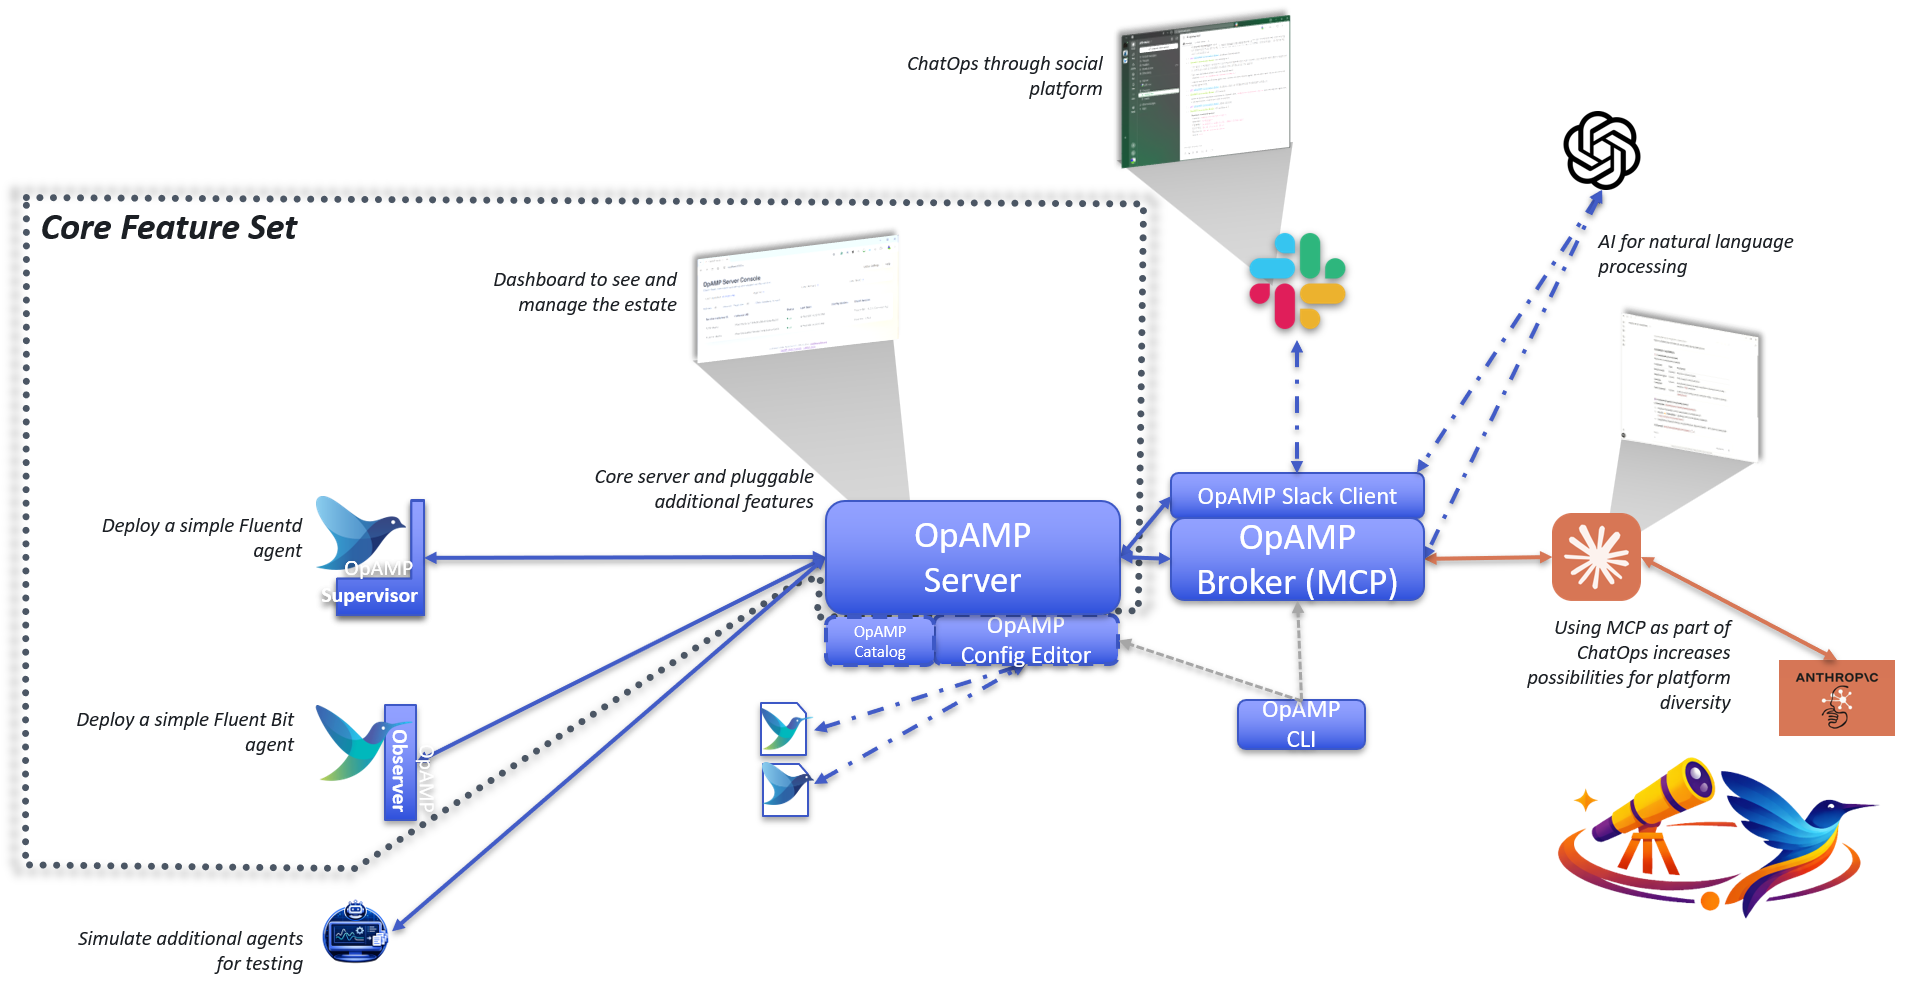
OpAMP defines an agent/client and server model in which the central server provides control, measurement, etc., to all Collectors. The agent/client side can be deployed in two ways: wired directly into a collector or via a separate supervisor tool. Integrating the client-side directly into the client is great, as it avoids introducing a new local process. The heart of OpAMP is the message exchange, which we’ll look at more in a moment.
Today, Fluent Bit would need to use the Supervisor model without modification (although GitHub shows a feature request to support the protocol, we haven’t heard whether or when it will be implemented). But it is early days, and some aspects of the protocol are still classified as ‘development’. That said, it is worth looking more closely at OpAMP as it offers some interesting opportunities, particularly around how we could easily evolve ideas such as chatOps.
While I’m not a fan of having a peer process for Fluent Bit, on the basis that we now have two distinct processes to support observability, we could experiment with the supervisor spawning Fluent Bit as a child process, which would let the supervisor easily spot Fluent Bit failing. At the sametime the supervisor can communicate with Fluent Bit using the localhost loopback adapter and the usual APIs.
Understanding the OpAMP Protocol and what it offers
Lets start with what the OpAMP protocol offers, firstly very little of it is mandatory (this is both good and bad – it means we can build compatibility in a more incremental manner, if certain behaviours are provided elsewhere, then the agent doesn’t have to offer a capability it is also tolerant of what an agent or collector can and can’t do):
Heatbeat and announce the agent’s existence to the server, along with what the agent is capable of/allowed to do regarding OpAMP features.
Status information, including:
environmental information
configuration being run
modules being used
Perform updates to resources, including:
Agent configuration
TLS certificate rotation
Credentials management
module or even an entire agent installation
issuing of custom commands.
directing the agent’s own telemetry to specific services/endpoints.
The heart of this protocol is the contract between the client (agent/collector) and the server, defined using Protobuf3. This means you can easily create the code skeleton to handle the payload objects, which will be transmitted in binary form (giving network traffic efficiency and the price of not being humanly readable or dynamically processable, insofar as you need to know the Protobuf definition to extract any meaning).
In addition to the Protobuf definitions, there are rules for handling messages, specifying when a message or response is required, message sequence numbering, and the default heartbeat frequency. But there aren’t any complex exchanges involved.
The binary payloads are exchanged over Sockets (allowing full-duplex exchanges where the server can send requests at any time) or over HTTP (providing half-duplex, aka polling/client check-in, at which point the server can respond with an instruction) – a strategy that is becoming increasingly common today.
The benefits we see
Regardless of whether you’re in a Kubernetes environment, the ability to ask agents/collectors to quickly tweak their configuration is attractive. If you start suspecting a service or application is not behaving as expected, if Fluent Bit is filtering your logs or sampling traces, you can quickly push a config change out to allow more through, providing further insight into what is going on – you don’t need to wait for a Kubernetes scheduler to roll through with replacing pods.
With the rise of AI, having a central point of contact makes it easier to wrap a central server as an MCP tool and have a natural language command interface. Along with the possibility that you can potentially send custom commands to the agent (or supervisor) to initiate a task. This was part of the functionality we effectively implemented in our original chatops showcase. The problem was that in the original solution, we deployed a small Slack bot that directed HTTP calls to Fluent Bit. With the OpAMP framework, we can direct the request to the server, which will route the command to the correct Fluent Bit node through a more trustworthy channel.
Implementation
The OpAMP protocol is likely to be widely adopted by commercial service providers (Bindplane,OneUpTime, for example), as it allows them to start working with additional agents/collectors that are already deployed (for example, a supervisor could be used to manage a Fluentd fleet, where there isnt the appetite to refactor all the configuration to Fluent Bit or an OTel Collector). Furthermore, it has the potential to simplify by standardizing functionality.
In terms of resource richness in the OpenTelemetry GitHub repo, I suspect (and hope) there will be more to come (a UI and richer details on how a base server can be extended, for example). At the time of writing, within the OpenTelemetry GitHub repository, we can see:
Go implementation of the protocol: the server accepts and responds to messages, and the client includes some test functionality to populate messages.
A supervisor implementation that, through configuration, can be pointed at an agent to observe, and the configuration so that the supervisor is uniquely identifiable to the server. This is also implemented in Go.
The latest release of Fluent Bit is only considered a patch release (based on SemVer naming). But given the enhancements included it would be reasonable to have called it a minor change. There are some really good enhancements here.
Character Encoding
As all mainstream programming languages have syntaxes that lend themselves to English or Western-based languages, it is easy to forget that a lot of the global population use languages that don’t have this heritage, and therefore can’t be encoded using UTF-8. For example, according to the World Factbook, 13.8% speak Mandarin Chinese. While this doesn’t immediately translate into written communication or language use with computers, it is a clear indicator that when logging, we need to support log files that can be encoded to support idiomatic languages, such as Simplified Chinese, and recognized extensions, such as GSK and BIG5. However, internally, Fluent Bit transmits the payload as JSON, so the encoding needs to be handled. This means log file ingestion with the Tail plugin ideally needs to support such encodings. To achieve this, the plugin features a native character encoding engine that can be directed using a new attribute called generic. encoding, which is used to specify the encoding the file is using.
The Win**** encodings are Windows-based formats that predate the adoption of UTF-8 by Microsoft.
Log Rotation handling
The Tail plugin, has also seen another improvement. Working with remote file mounts has been challenging, as it is necessary to ensure that file rotation is properly recognized. To improve the file rotation recognition, Fluent Bit has been modified to take full advantage of fstat. From a configuration perspective, we’ll not see any changes, but from the viewpoint of handling edge cases the plugin is far more robust.
Lua scripting for OpenTelemetry
In my opinion, the Lua plugin has been an underappreciated filter. It provides the means to create customized filtering and transformers with minimal overhead and effort. Until now, Lua has been limited in its ability to interact with OpenTelemetry payloads. This has been rectified by introducing a new callback signature with an additional parameter, which allows access to the OLTP attributes, enabling examination and, if necessary, return of a modified set. The new signature does not invalidate existing Lua scripts with the older three or four parameters. So backward compatibility is retained.
The most challenging aspect of using Lua scripts with OpenTelemetry is understanding the attribute values. Given this, let’s just see an example of the updated Lua callback. We’ll explore this feature further in future blogs.
function cb(tag, ts, group, metadata, record)
  if group['resource']['attributes']['service.name'] then
    record['service_name'] = group['resource']['attributes']['service.name']
  end

  if metadata['otlp']['severity_number'] == 9 then
    metadata['otlp']['severity_number'] = 13
    metadata['otlp']['severity_text'] = 'WARN'
  end

  return 1, ts, metadata, record
end
Other enhancements
With nearly every release of Fluent Bit, you can find plugin enhancements to improve performance (e.g., OpenTelemetry) or leverage the latest platform enhancements, such as AWS services.



You must be logged in to post a comment.