
Tags
agentic, agents, AI, collector, Fluent Bit, Fluentd, Lua, observability, open-source, OpenTelemetry, OTel, OTTL, Transformation, Vector
In our first post on Moving Open-Source Observability closer to turn-key solutions, we discussed how we can automate the source-to-pipeline. But turn-key solutions also flow data to the backend and provide logs and metrics that are contextually aware of the systems being monitored.
While detecting sources and building the capture mechanism may seem more challenging at first glance, it is easier – we have a defined technology, and our observability agent defines the output structure. So what makes the pipeline to the backend more complex?
- We’re more likely to have a variety of products, and some products may have functional overlaps.
- Greater configuration diversity in how tools can be configured.
- Greater contextual awareness is needed.
Let’s break these down in more detail.
Greater variety of tools means we need a common way to set up transformations; otherwise, the mechanics of a transformation process in our pipeline will explode in complexity.
One benefit of going open source is that you can choose the tools that fit your needs for log analytics, metrics, alert routing, and so on, but this can lead to functional overlaps. For example, you may use Prometheus for infrastructure-based metrics, but want to use Elastic APM for Application Performance Management (APM) as you’re using an Elastic Java stack for app development.
The different approaches to configuring tools, or configuration diversity, is probably the single largest challenge, and the number of approaches multiplies the number of configuration permutations that must be achievable. While there appears to be some initia behind the support the Prometheus mixin framework which provides templates for different scenarios such as infrastructure dashboards and alerts. It is far from universal adoption today. For example, Prometheus and Grafana support its use. But other solution stacks such as Elastic do not. If you align on a common technology stack, the chances of a harmonised configuration process rise.
We need contextual awareness from the source, as well as the collected data, to map data to the table(s). For efficiency, if we can avoid putting all metrics into a single table, queries could have one less dimension to filter. Context awareness will inform how we render the dashboards and set alert thresholds. For example, general filesystem storage capacity thresholds would be hugely different to database storage thresholds.
All of this means that if we want a deterministic, transformation-based process, we’ll end up with an unsustainable set of combinations that need to be mappable, testable, and maintainable as the different solutions grow, evolve, and occasionally get archived as contributions dry up.
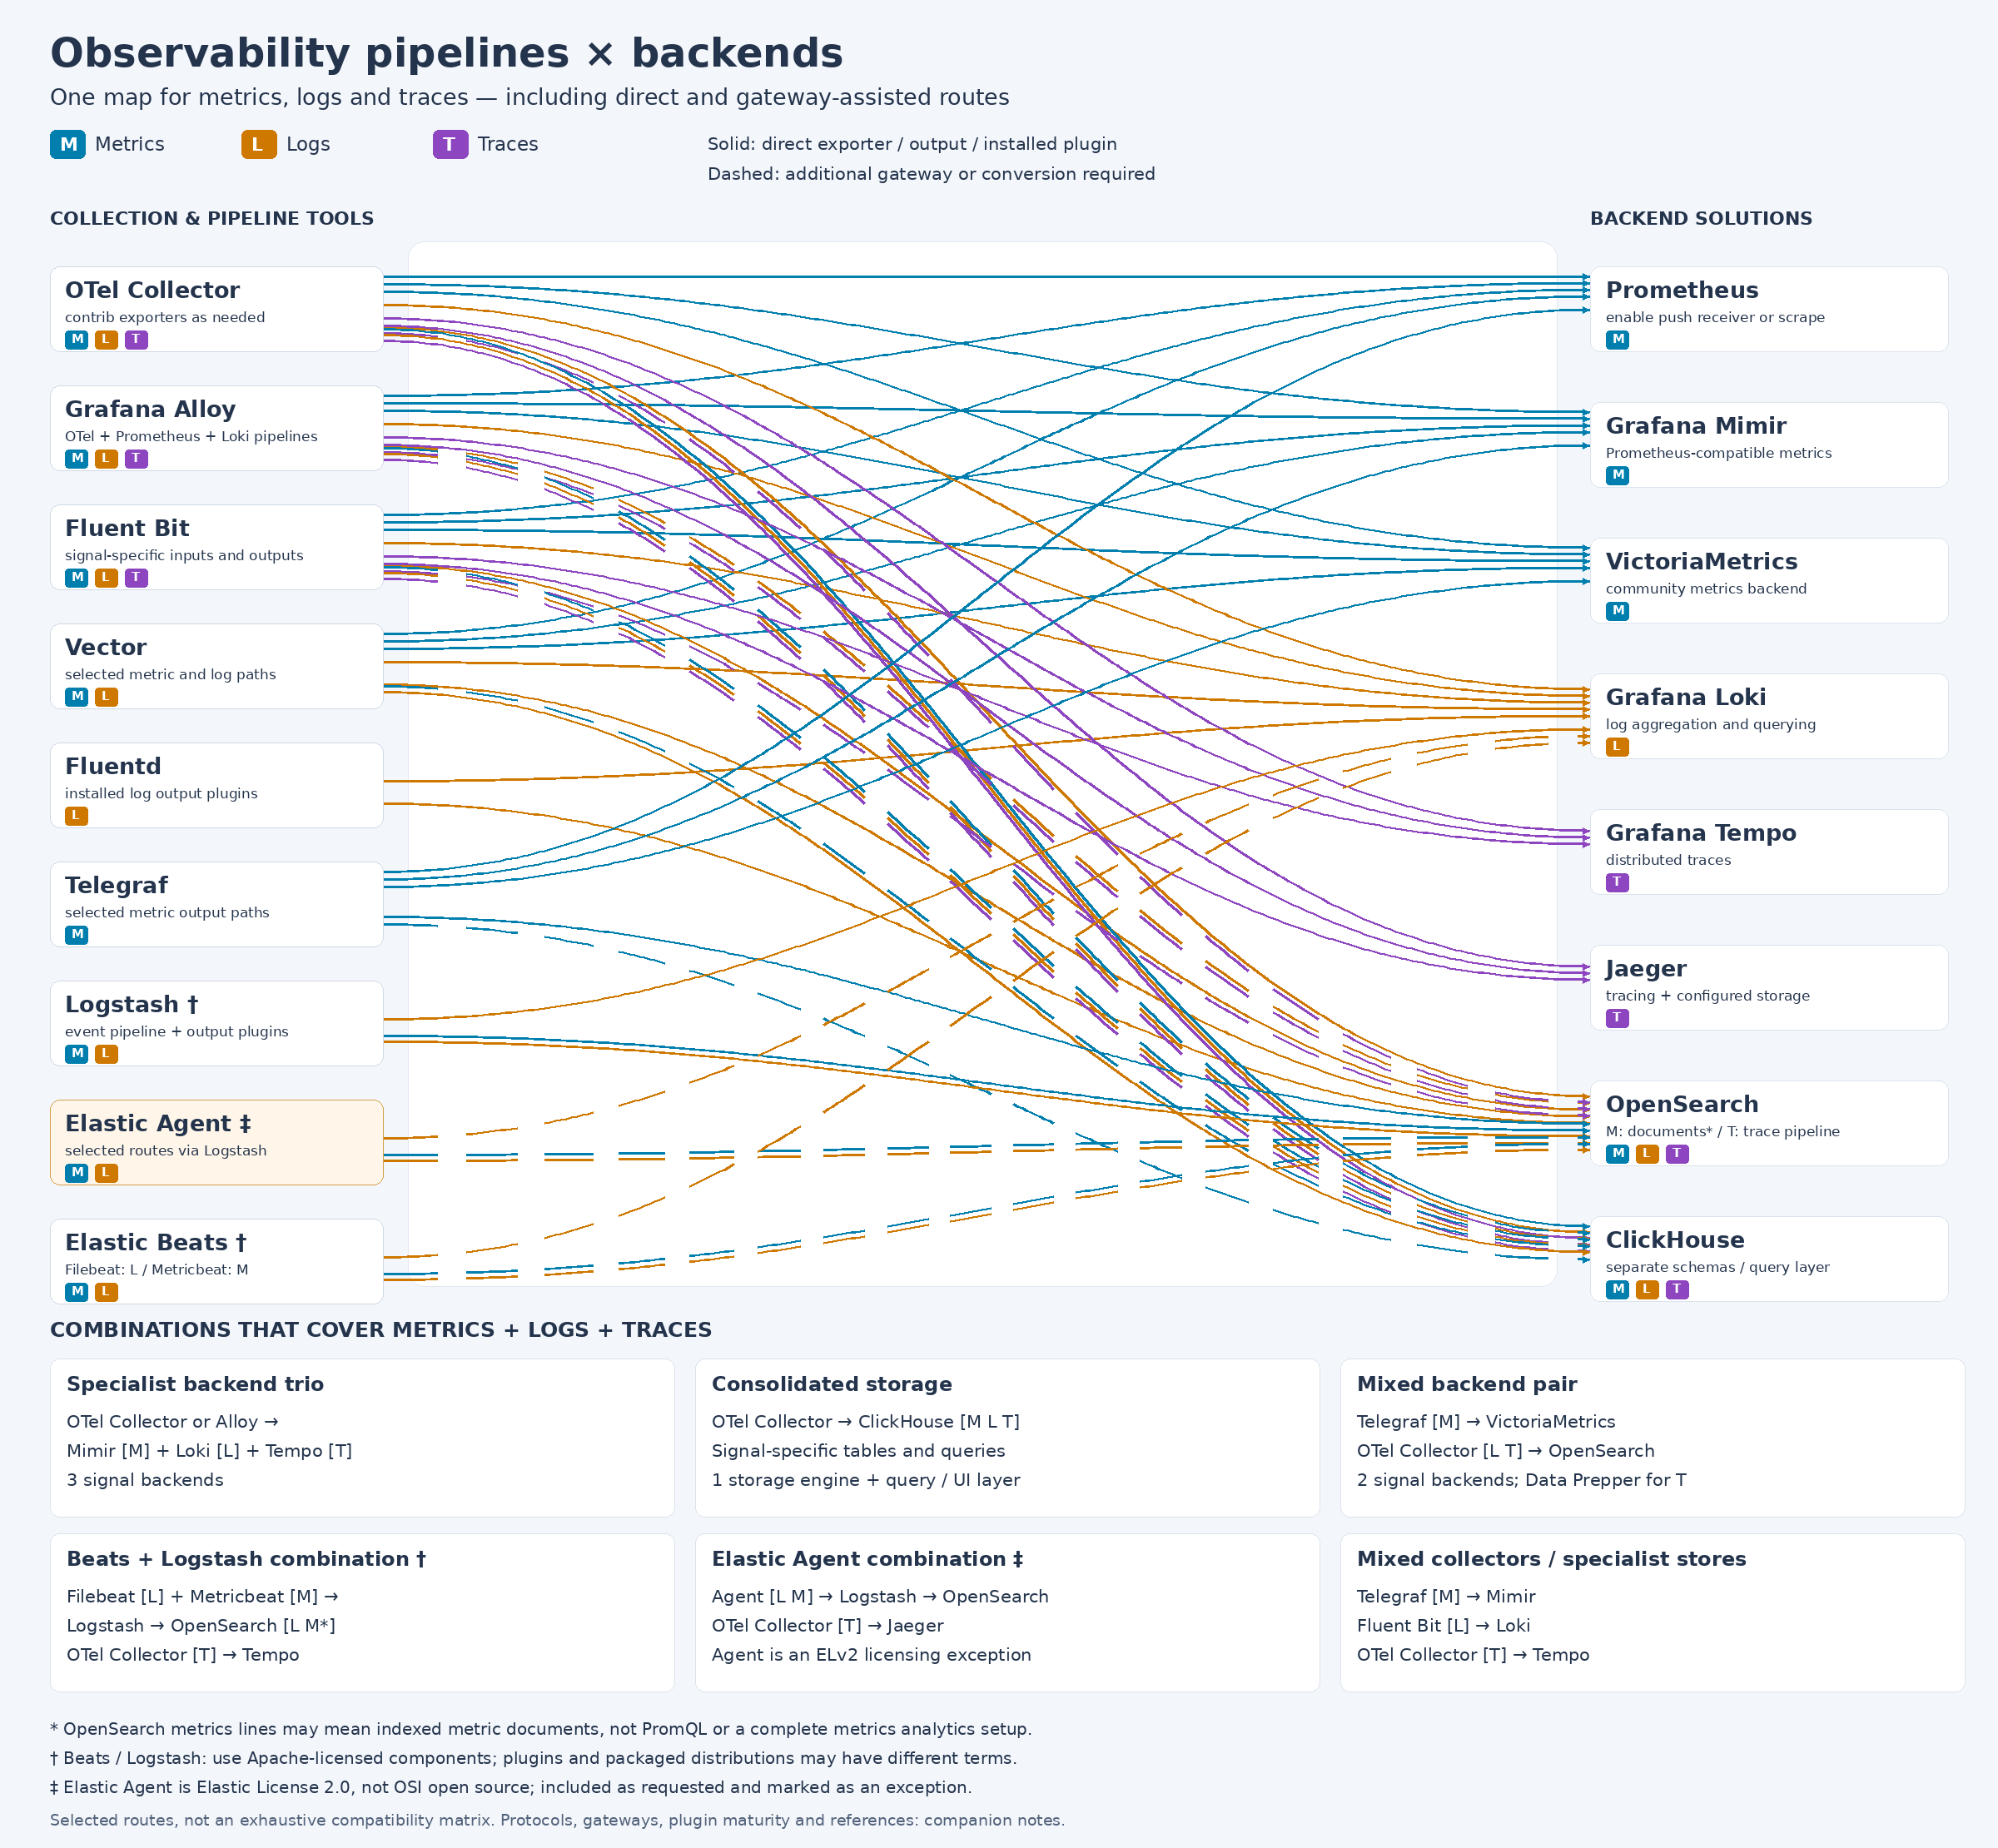
As turnkey solutions, bring an opinionated answer and either build their own backends from scratch (e.g. Oracle’s Enterprise Manager) and leveraging open source as building blocks – they effectively eliminate the challenges of functional overlaps and configuration diversity – at the same time removing that flexibility. To underline how messy things could get, we experimented in a branch of the repo to see how messy it could get, while trying to keep the divergence as narrow as possible. This diagram illustrates the point visually.
Solution
If a deterministic approach is unsustainable, are there options to ease the challenge or achieve a solution?
Simplification option
One option that can simplify, but certainly doesn’t solve, the challenge is to leverage OpenTelemetry’s work on semantic conventions, where they have been cultivating naming conventions that define data elements likely to be transmitted. When you manually map data, the process becomes more intuitive (and therefore quicker) and improves the chances of an AI agent mapping successfully. In some respects, this is like middleware-driven efforts to build data ontologies, so you need to avoid the problems global ontologies had.
Bringing AI to the game
Because configuration is linguistic and well documented, you can apply an LLM-based approach to the problem. The process of mapping from the ingestion part of the pipeline to the back end needs to be flow-driven so we can:
- Perform a validation process by selecting and using validation tools to verify the configuration(s).
- When validations fail, the process can be pushed back to the configuration stage again.
- When users are in the loop, it becomes possible to drive a conversation for more clarity.
- With a conversational process, it becomes possible to create in-pipeline transforms as a result of user conversation, along with simpler transforms to handle possible data formats and names.
What we’re describing here isn’t trivial, and could arguably be offered as a commercial product in its own right. The config management feature of our OpAMP solution also provides meaningful inputs, as it defines valid data types for observability agents like Fluent Bit where a concrete schema is not provided.
Using AI – agent graph
Agent descriptions
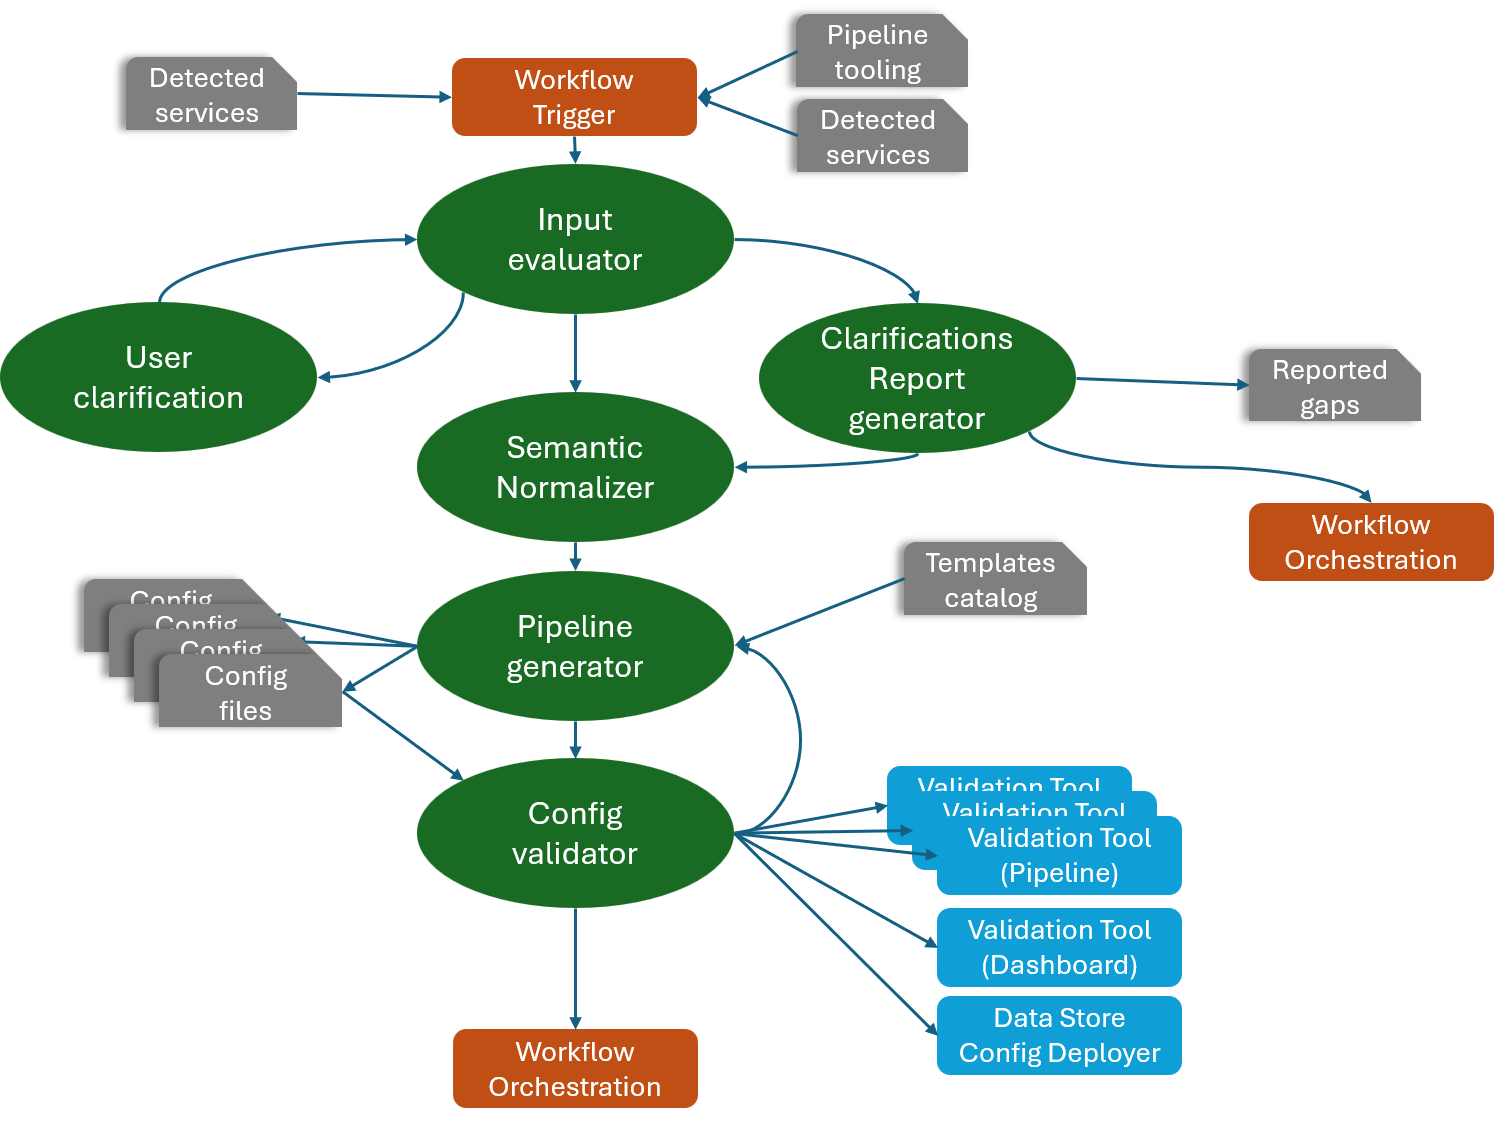
The agentic process illustrated in the preceding diagram is not trivial. It will be pretty context-heavy, as much of the information to work with can’t be easily addressed through targeted RAG or semantic search. In most cases, these core agents will need tools such as web search, since their training isn’t as up to date as the latest features of the different tools.
- Input evaluator – We need a variety of inputs covering the target systems and, if there is overlap in capability, guidance on which ones to use. We need to tell the agent what tooling the pipeline needs. We’ll likely need metadata on the sources. For example, if we detect a database, we need to know which type so we can inject the correct queries. The input evaluator will use this to decide whether the detail is sufficient. The result of this analysis could be one of several things:
- Use a client conversational agent that chats with the user to get clarifications; there is some overlap here, as the conversation will need to know what answers are needed, and some answers may open up new questions. Once this agent believes it has compiled the details for the answers. it returns to the Input Evaluator to reassess the picture.
- We can ask the evaluator to pause the process and generate a report showing the gaps identified. This can be done using the Clarifications Report generator.
- The Input evaluator may determine that it reports the gaps and presses on with a best effort.
- Semantic normalizer – To simplify the flow, mapping source names to the semantic definitions from OpenTelemetry would need to understand the source and the OTel Semantic Naming model.
- Pipeline generator – Once we confirm the details and have simplified semantics, we can have the AI build out the rest of the pipeline. The agent may need to be handed back to the agent for correction.
- Config validator – once the pipeline generator hands off the configurations, the validator agent determines the best tools to verify whether the configurations are valid. If the tool returns an error, it hands the cause back to the pipeline generator. Ideally, tool calls will return meaningful error descriptions. But if not, we’d need to create a simple knowledge base to extract details from.
- Clarifications Report generator – The clarifications report generator’s role is to take the gaps identified and generate and share them via a document repository or email in a user-friendly format
- User clarification – The conversational interface with the user to obtain missing details, according to the Input evaluator. One difference between this and the Input evaluator is that this agent will need to consider conversational history to build the required additional detail. The input evaluator shouldn’t need prompting.
Controlling complexity
We’ve seen that allowing flexibility and removing the opinionated constraints of turnkey solutions increases complexity very quickly. The AI solution will become much more reliable if we strip back the options we allow agents to choose from, or if we push more organizations to standardize on consistent configuration strategies that enable a move toward templatization.
A Unified pipeline syntax
The other path that could radically simplify things is the Open Telemetry Transformation Language (OTTL), which has just reached the version 1 milestone. While it is not a complete solution, it offers a way to advance the standardized pipelines. We’ll explore OTTL in a separate blog in more depth. But essentially, if you look at the collector as two parts- the wire-level mechanism to capture or emit data and a second part for routing and manipulation- then OTTL is about the routing and manipulation. OTTL has both a formal syntax and an implementation as a Go library. While the library may not help if you’re using Vector, Fluentd, Fluent Bit, etc., the formal notation will work with ANTLR4; the resources are available through the OTLery OTTL-Lang repo. This allows us to generate, across many languages (C, Java, Ruby, Lua, etc.), a parser for the OTTL syntax into a tree structure that can then be walked. This still needs the intelligence to translate data references into references for the observability tool, and the functions, editors, and transformers to be implemented. Still, most of these can be mapped onto language-native libraries.
With a formal notation and a growing catalogue of prepared OTTL scripts and utilities, such as those offered by the OTLery repos, there is the ability to leverage AI to generate the transformation logic. As many observability tools such as Fluent Bit and Vector include support for scripting and plugins, incorporating a complete parser becomes a practical option. With both Vector and Fluent Bit, for example, supporting Lua being incorporated into the pipeline, and ANTLR4 supporting Lua as well, it should be possible to implement OTTL in those pipelines.
There is one downside to using OTTL: we lower our observability agents to the lowest common denominator. For example, Fluent Bit provides basic stream analytics. Transformations are now going through a parser phase rather than going directly to native binary processes.
Conclusion
The more we can restrict options, the closer we can get to being able to automate the creation of the observability pipeline quickly, and efficiently, but at the price of potentially not maximizing feature exploitation (the downside of using OTTL across different observability agents). The problem is to provide a solution that is very flexible, which will require a fair bit of effort. That flexibility also creates the possibility of exploiting the full feature set of the available tools.


You must be logged in to post a comment.