The hyper scaler cloud vendors all offer Logging and monitoring capabilities. But they tend to focus on supporting their native services. If you’re aware of Oracle’s Cloud (OCI) messaging, then you’ll know that there is a strong recognition of the importance of multi-cloud. This extends not only to connecting apps across clouds but also to be able to observe and manage cloud-spanning solutions. Ultimately, most organizations want to headline observability-related views of their solutions.
Late last year, I presented these ideas, illustrating the ideas with the use of Fluent Bit and OCI’s Observability and Management products to visualize and analyze what is happening. I finally found the time to write how the very basic demo was built from a clean sheet over on the Oracle Devs blog on Medium.
This also highlights the fact that the Fluent Bit book, while I believe, once completed, will be through, can’t cover everything – and certainly not build end-to-end use cases like the Oracle Observability & Management example. To help address this, the book includes an appendix of helpful additional information, some of which I have included here, along with other content that we encounter – all of which can be found at Fluentd & Fluent Bit Additional stuff.
We could solve this with custom integrations, or we can exploit an IETF standard called SCIM (System for Cross-domain Identity Management). The beauty of SCIM is that it brings a level of standardization to the mechanics of sharing personal identity information, addressing the fact that this data goes through a life cycle.
While Oracle’s IDCS and IAM support identity management for authentication and authorization for OCI and SaaS such as HCM, SCM, and so on. Most software ecosystems need more than that. If you have personalized custom applications or COTS or non-Oracle SaaS that need more than just authentication and need some of your people’s data needs to be replicated.
The lifecycle would include:
Creation of users.
Users move in and out of groups as their roles and responsibilities change.
User details change, reflecting life events such as changing names.
Users leave as they’re no longer employees, deleted their account for the service, or exercise their right to be forgotten.
It means any SCIM-compliant application can be connected to IDCS or IAM, and they’ll receive the relevant changes. Not only does it standardize the process of integrating it helps handle compliance needs such as ensuring data is correct in other applications, that data is not retained any longer than is needed (removal in IDCS can trigger the removal elsewhere through the SCIM interface). In effect we have the opportunity to achieve master data management around PII.
SCIM works through the use of standardized RESTful APIs. The payloads have a standardized set of definitions which allows for customized extension as well. The customization is a lot like how LDAP can accommodate additional data.
The value of SCIM is such that there are independent service providers who support and aid the configuration and management of SCIM to enable other applications.
Securing such data flows
As this is flowing data that is by its nature very sensitive, we need to maximize security. Risks that we should consider:
Malicious intent that results in the introduction of a fake SCIM client to egress data
Use of the SCIM interface to ingress the poisoning of data (use of SCIM means that poisoned data could then propagate to all the identity-connected systems).
Identity hijacking – manipulating an identity to gain further access.
There are several things that can be done to help secure the SCIM interfaces. This can include the use of an API Gateway to validate details such as the identity of the client and where the request originated from. We can look at the payload and validate it against the SCIM schema using an OCI Function.
We can block the use of operations by preventing the use of certain HTTP verbs and/or URLs for particular or all origins.
Outside of my Oracle cloud-related content, we’ve just published an article on DZone. Those who follow this blog will be familiar with the article theme as it relates to the Log Simulator work. We’ve also written for Devmio – although we don’t yet know when the article will be published and whether the content will be publicly available or behind their paid firewall.
We haven’t blogged too much recently as we have been busy helping get and producing content for my employer Oracle, working with Software Engineering Daily, and developing a collaborative book. So, I thought I’d pull together some links to these new resources.
We’ve been busy putting together a number of Oracle Architecture Center assets over the last week. This has included building LogSimulator extensions that can either be run in a very simple manner using just a single file, but limited in the payloads that can be sent to OCI (if you take the appropriate custom file from the LogSimulator you do need to make one minor tweak. But the code has also been added to the Oracle GitHub repository here in a manner that doesn’t require the full tool. There of course a price to pay for the simplified implementation. This comes in the form of the notifications being sent and received being hardwired into the code rather than driven through the insulator’s configuration options.
The decoupling has been done by implementing the interface for the custom methods in a class without the implements declaration, and then we extend the base class and apply the implements declaration at that level.
While notifications could take log events, it is more suited to JSON payloads. But as the simulator can tailor the content being sent using some formatting, it does not care if the provided events to send are pre-formatted as JSON objects making it an easy tool to test the configuration of OCI Notifications.
Unit testing as well
In addition to the new channel, as previously mentioned we have been making some code improvements. To support that we have started to add unit tests, and double checking code will compile under Java. To keep the dependencies down we’re making use of Java assert statements rather than a pretty JUnit. But the implementation ideas are very similar. As the tests use Java asserts the use of asserts does need to be enabled in the command line; for example:
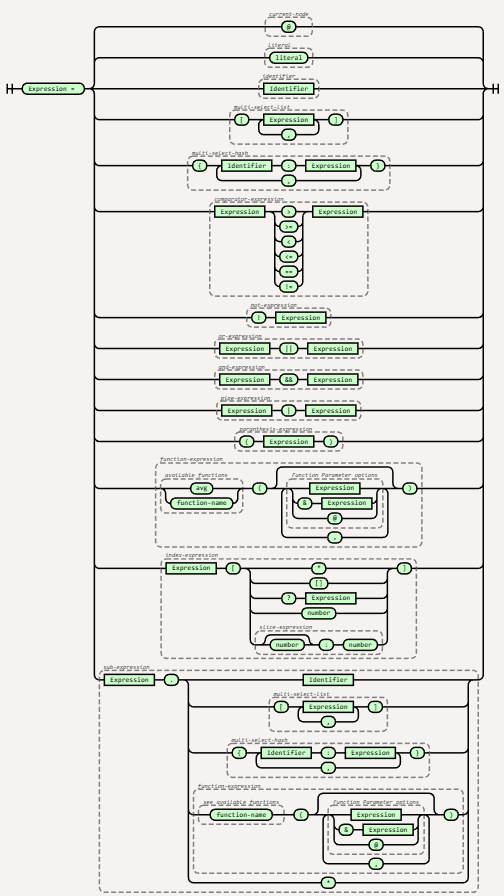
JMESPath is a mature syntax for traversing and manipulating JSON objects. The syntax is also supported with multiple language implementations available through GitHub (and other implementations exist). As a result, it has been very widely adopted; just a few examples include:
Azure CLI
AWS CLI and Lambda
Oracle Cloud WAF
Splunk
As the syntax is very flexible and recursive in its use following the documented notation can be a little tricky to start with. So following the syntax can be rather tricky. The complete definition runs to 97 lines, of which 32 lines focus on the syntactical structure. The others describe the base types such as numbers, characters, accepted escaped characters, and so on. Nothing wrong with this, as the exhaustive definition is necessary to build parsers. But for the majority of the time it is those 32 lines that we need to understand.
As the expression goes – ‘a picture says a thousand words’, there might not be a thousand words, but there is enough to suggest a visual representation will help. Even if the visual only helps us traverse the use of the detailed syntax. So we’ve use our favoured visual representation – the railroad diagram and the tool produced by Tab Akins to create the representation. We’ve put the code and created images for the syntax in my GitHub repository here, continuing the pattern previously adopted.
Here is the resulting diagram …
To make it easy to trace back to the original syntax document we’ve included groupings on the diagram that have names from the original speciofication.
Parts of the diagram make the expressions look rather simple, but you’ll note that it is possible for the sections to be iterative which allows for the expression to traverse a JSON object of undefined depth. But what can be really challenging is that an in many areas it is possible to nest expressions within expressions. Visually there is no simple way to represent the expression possibilities of this in a linear manner. Other than be clear about where the nesting can take place.
Those who have been using my Logging in Action book will know that to help test the configuration of monitoring tools including Fluentd we have built a LogGenerator that can very easily play and replay logging events into a variety of destinations and formats. all written in Groovy to make the utility easy to run as a script and extend without needing to set up a proper Java development environment.
With the number of different destinations built into the script and the logic to load the source log events and format them the utility is getting rather large for a single file. Rather than letting it continue to grow as we add more destinations to pump log events too, I’ve extended the implementation so you can point to a Groovy file that implements the logic to send the log events. It only requires three simple methods to be implemented.
To demonstrate the feature we have created a custom extension and fully documented it. The extension allows you to send log events to the OCI Logging service. This includes an optional crude aggregation mechanism as sending individual log events is a little inefficient over REST. By doing this we can send synthetic or playback logs as if we’re an application in real-life to ensure that any alerting or routing for the logging works properly before we get anywhere production and do not need to run the application and induce error events.
Beyond this, we’re also thinking about creating a plugin to fire log events at Prometheus so we can send events using the Prometheus pushgateway. As a result, we can tune Prometheus’ configuration.
More improvements – refactoring the existing code
We will refactor the existing code to use the same approach which should make the code more maintainable, but the changes won’t stop the utility from working as it always has (so we won’t break out the existing output channels from the core).
We have also started to improve the code commenting – so hopefully it will make the code a bit more navigable.
One of the areas I present publicly is the use of Fluentd. including the use of distributed and multiple nodes. As many events have been virtual it has been easy to demo everything from my desktop – everything is set up so I can demo things very easily. While doing this all on one machine does point to how compact and efficient Fluentd is as I can run multiple instances concurrently it does undermine distributed capabilities somewhat.
Add to that I now work for Oracle it makes sense to use OCI resources. With that, I have been developing the scripts to configure Ubuntu VMs to set up the demo environments installing Ruby, Fluentd, and various gems needed and pulling the relevant configurations in. All the assets can be found in the GitHub repository https://github.com/mp3monster/logging-demos. The repository readme includes plenty of information as well.
While I’ve been putting this together using OCI, the fact that everything is based on Ubuntu should mean it can be run locally on VMs, WSL2, and adaptable for MacOS as well. The environment has been configured means you can still run on Ubuntu with a single node if desired.
Additional Log Destinations
As the demo will typically be run on OCI we can not only run the demo with a multinode setup, we have extended the setup with several inclusion files so we can utilize OCI services OpenSearch and OCI Log Analytics. If you don’t want to use these services simply replace the contents of several inclusion files including files with the contents of the dummy_inclusion.conf file provided.
Representation of the Demo setup
The configuration works by each destination having one or two inclusion files. The files with the postfix of label-inclusion.conf contains the configuration to direct traffic to the respective service with a configuration that will push log events at a very high frequency to the destination. The second inclusion file injects the duplication of log events to each service. The inclusion declarations in the main node Fluentd config file references an environment variable that should provide the path to the inclusion file to use. As a result, by changing the environment variable to point to a dummy file it becomes possible o configure out the use of one of the services. The two inclusions mean we can keep the store declarations compact and show multiple labels being used. With the OpenSearch setup, we have a variant of the inclusion file model where the route inclusion can reference the logic that we would use in the label directly within the sore declaration.
The best way to see the use of the inclusions is to experiment with setting the different environment variables to reference the different files and then using the Fluentd dry-run feature (more on this in the book).
Setup script
The setup script performs a number of tasks including:
Pulling from Git all the resources needed in terms of configuration files and folders
Retrieving the necessary plugins against the possibility of their use.
Setting up the various environment variables for:
Slack token
environment variables to reference inclusion files
shortcut environment variables and aliases
network (IP) address for external services such as OpenSearch
Setting up a folder for OCI tokens needed.
Setting up temp folders to be used by OCI Plugins as a file-based cache.
Feeding the log analytics service is a more complex process to set up as the feeds need to have metadata about the events being ingested. The downside is the configuration effort is greater, but the payback is that it becomes easier to extract meaningful information quickly because the service has a greater understanding of the content. For example, attributing the logs to a type of source means the predefined or default log formats are immediately understood, and maximum meaning can be retrieved from the log event.
Going to OCI Log Analytics does cut out the need for the Connections hub, which would allow rules and routing to be defined to different OCI services which functionally can help such as directing log events to PagerDuty.
Infrastructure as Code (IaC) should be treated the same way as any other code. That is to say that we should be considering configuration management, testing, regression, code quality, and coverage. We should be addressing these points for the same reasons we address them with our application code. Such as ensuring that we don’t introduce bugs as things evolve and develop, ensuring that the code is maintainable over a prolonged period etc.
The problem is that the only real way to test IaC is to run it. Particularly with the likes of Terraform where it is largely declarative rather than containing a lot of logic. This point is nicely conveyed by Yevgeniy Brikman’s presentation (below)
The presentation goes on to illustrate Terratest which has the look and feel of JUnit or any other xUnit test framework. Terratest is implemented in Golang, But to be honest, given the nature of Terraform ( largely declarative meaning it enables ideas of composition and not sophisticated logic) it means the writing of the tests isn’t going to demand anything clever like how to achieve polymorphic behavior through Go’s type structures.
While Yevgeniy focussed on testing by invoking an application on the infrastructure deployed something we’ve described though our Platform Test logic (more here). You may wish to test things further by interrogating infrastructure components. For example, do I have the right number of nodes in a dynamic group or are container or server logs going into the cloud monitoring services.
Performing such checks is very easy with OCI as it provides a Golang SDK making it very easy to write tests that can call the OCI APIs and interrogate the setup. Better still when considering whether the Terraform configuration will behave correctly to support dynamic/auto-scaling can be done easily without modifying the Terraform configurations as part of the Terratest logic can include Go API calls to temporarily modify scaling triggers or invoking code that can stimulate OCI dynamic features.
Testing App Configuration
There is an interesting question to be considered. There is a point of separation between when to use Terraform (or Pulumi and others for that matter) and tools better suited to application deployment and configuration like Ansible and Chef. Therefore should we separate the testing of these details? Maybe I am too purist but seeing local and remote execs in Terraform as these actions are very opaque and can be used to conceal things or unwittingly depend on the way Terraform handles its dependency graph.
Of course, Ansible has its test framework ansible_test and has the means to measure test coverage. So one possibility is to treat Ansible as a separate module, independently test it, and then integrate its use in the wider picture of deploying infrastructure.
I’ve been a fan of Railroad syntax diagrams for a long time. I’ve always found them an easy way to understand the syntactical options and the reserved/keywords in an efficient manner.
Example of Railroad Syntax diagram
I have been digging around in the documentation to find a keyword in the OCI Policies syntax that the common cases don’t use. After a bit of rooting around, I found what I needed. But a Railroad representation would have helped me get the expression correct effortlessly and without so much effort.
Once I solved my problem, I decided to see if I could find something that could easily create the railroad diagrams and encountered a fantastic bit of code on GitHub from Tab Atkins Jr. It’s a neat bit of JavaScript, which can even be run from their GitHub pages – go here. Tab has taken the time to document the tool well, so working out the syntax to define the diagram is straightforward (not that you need to read it much as the tool is well written).
The following diagrams show the syntax for writing OCI Policies in a single image and with the full syntax broken into 2 images to make it a little easier to read on the screen. But also address the fact often you don’t need the Where clause.
If the diagrams need to be updated the source to use with the tools is in my GitHub repository. But a really cool feature of the utility is that the information to populate the editor view is included in the URL (does make for a long URL) but it means this link will take you directly to the view & editor if you want to tinker with the definition. So the links are:
's Blog")


You must be logged in to post a comment.