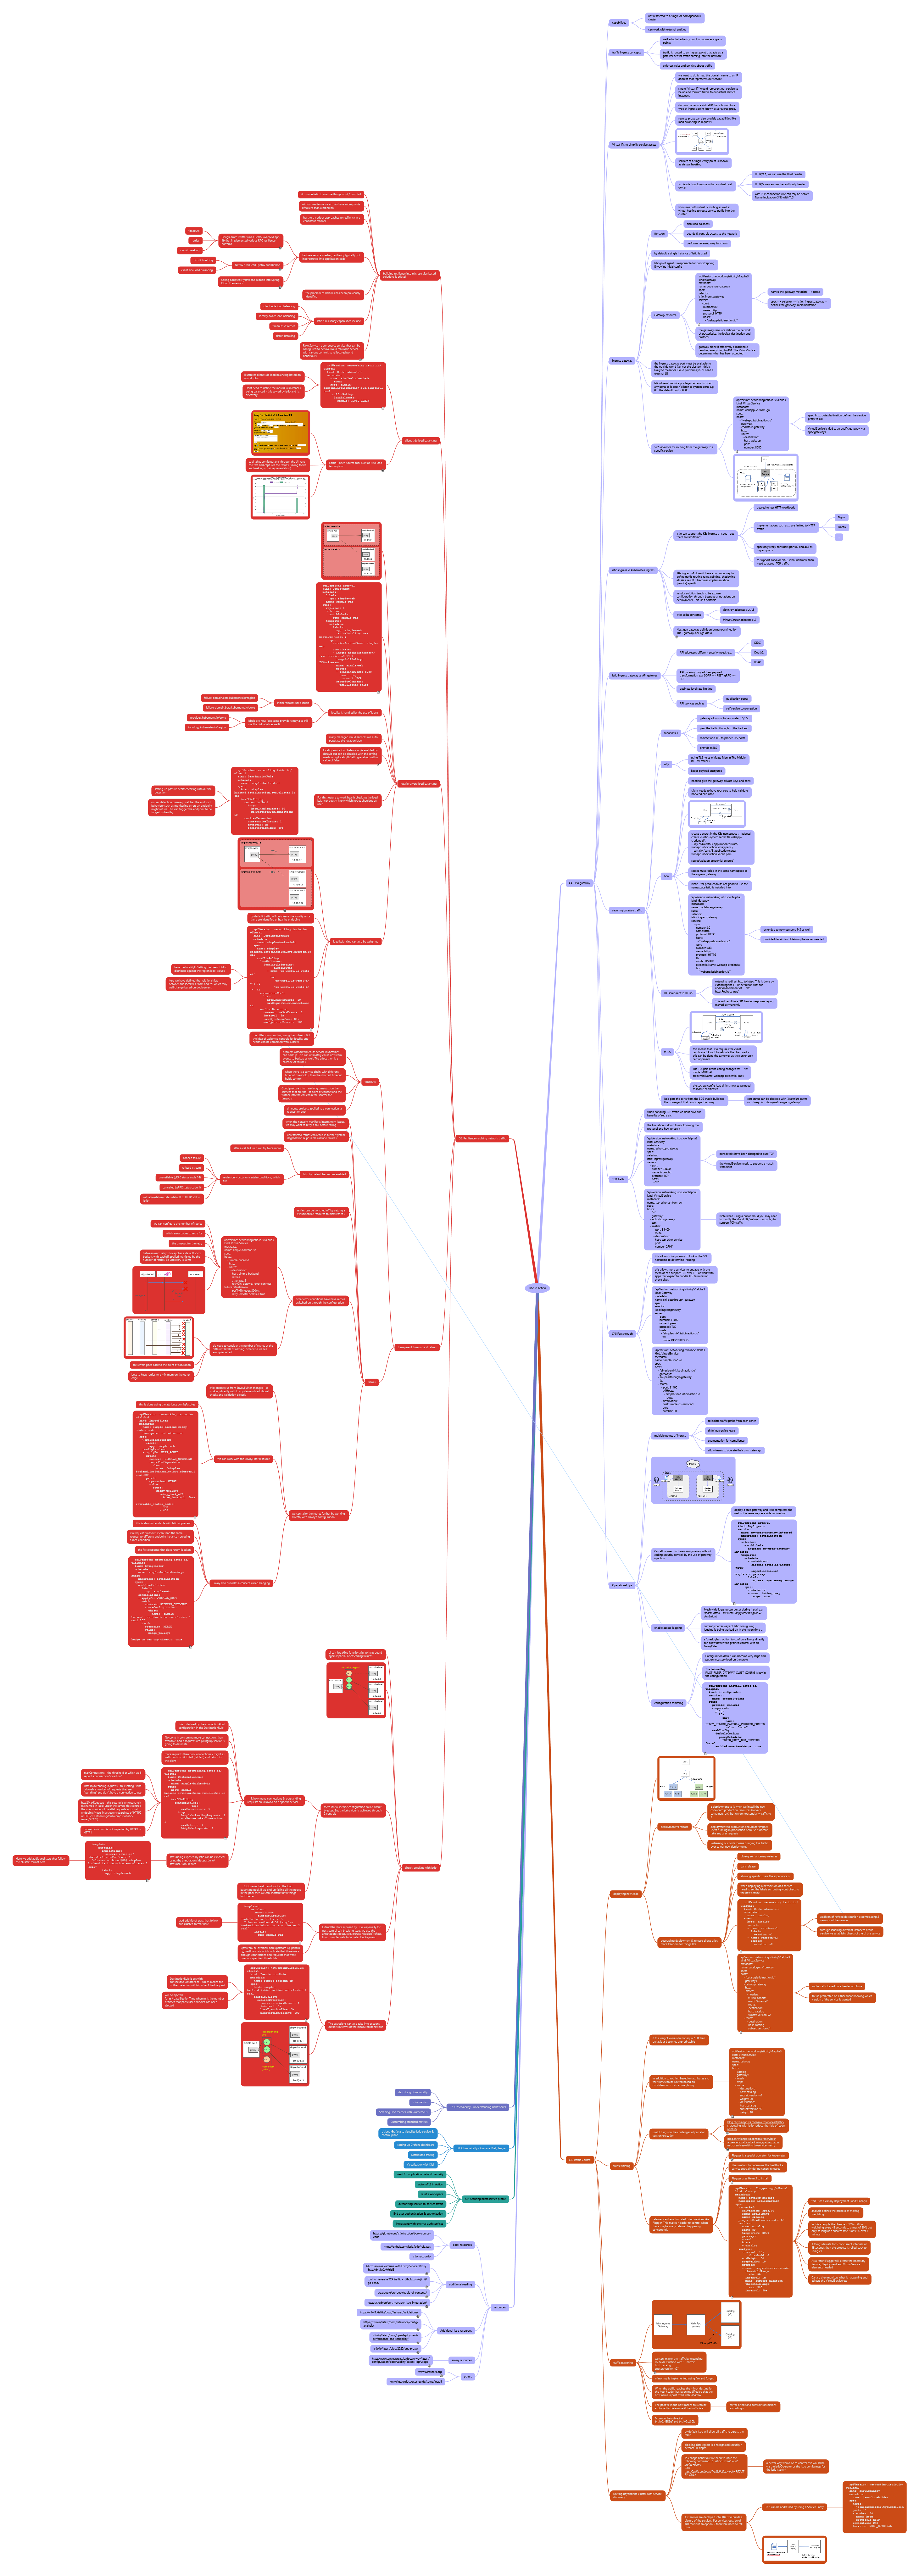
I wrote about how much I like the lens app K8s dashboard capability without needing to deploy K8s dashboard. Sadly recently, there has been some divergence from K8sLens being a pure open source to a licensed tool with an upstream open-source version called Open Lens (article here). It has fallen to individual contributors to maintain the open-lens binary (here) and made it available via Chocolatey and Brew. The downside is that one of the nice features of K8sLens has been removed – the ability to look at container logs. If you read the Git repo issue on this matter – you’ll see that a lot of people are not very happy about this.
If you read through all the commentary on the ticket, you’ll eventually find the following part of the post that describes how the feature can be reintroduced.
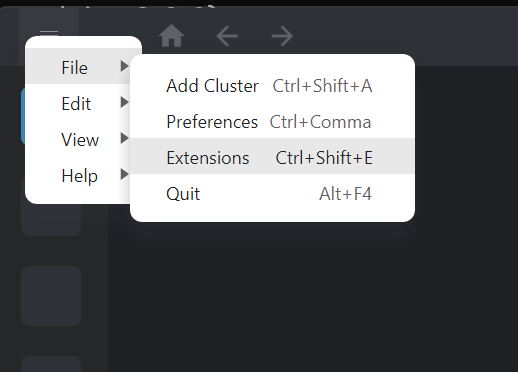
In short, if you use the extensions feature and provide the URL of the extension as @alebcay/openlens-node-pod-menu then the option will be reintroduced. The access to the extension is here:
I’m not sure why, but I did find the installation a little unstable, and needed to reinstall the plugin, restart OpenLens and reenable the plugin. But once we got past that, as you can see below the plugin delivered on its promise.
The problem with the licensing is that it doesn’t distinguish between me as an individual and using Lens for my own personal use vs. using Lens for commercial activities. The condition sets out:
ELIGIBILITY:You or your company have less than $10M in annual revenue or funding.
Given this wording, I can’t use the licensed version, even if I was working on an open-source project and in a personal capacity, as the company I’m employed by has more than $10 million in revenue. For me, the issue is $200 per year is a lot for something I only need to use intermittently. While I get k8slens includes additional features such as Lens Security which performs vulnerability management, and Lens Teamwork, along with support, are features and services that are oriented to commercial use – these are features I don’t actually want or need. Lens Kubernetes sounds like an interesting proposition (a built-in distribution of K8s), but when many others already provide this freely – from Docker Desktop to Kind it seems rather limited in value.
We did try installing Komodor, given its claims for an always free edition. But on my Windows 11 Pro (developer early access) installation, it failed to install, as you can see:
Let’s be honest we’re not all command line warriors when it comes to Kubernetes. I can get around Kubectl but the time it takes to key in a CLI command you can get the same information in a couple of clicks of the UI. For me, Kubectl is for automating my tasks, for example pushing a local build into a image repository, initiating a refresh deployment and ensuring old container instances are flushed out.
Lens view
K8s Dashboard
The only problem is that the K8s dashboard requires a lot of config work to secure its deployment, and do you want to be deploying such tools in a production environment? A colleague suggested I look at Lens. A tool that offers both Personal (free) and Team licensed versions and both versions deploy to Windows, Linux, and Mac natively so installation doesn’t require any messing around.
I have to say I have been very impressed with Lens. Everything useful about the K8s dashboard is here, but without needing to deploy anything to your cluster as lens runs as a local thick app. Just like the K8s dashboard you need the privileges to talk to the K8s APIs. But the Visualization is all local and the way the data is retrieved means the UI is very reactive.
Lens supports extensions, although to date I’ve not tried any of the extensions personally – you can see a list of extensions here. I will be trying out a couple Of extensions in due course. For example:
Network Policy Viewer
Certificate Info (via K8s secrets)
Lens goes further by the fact you can connect to multiple clusters from a single viewer instance. So no need for multiple deployments of the dashboard or creating an additional management cluster.
I only have one minor grumble today with the implementation. When using a console facility to access a container it is not possible to paste into the console any text/script or copy out any of the log contents. The latter can make generating things like JIRA tickets a bit annoying. So far I’ve worked around it by creating screenshots.
A container registry is as essential as a Kubernetes service as you want to manage the deployable resources. That registry could be the public Docker repository or something else. In most people’s cases, the registry needs to be private as you don’t want to expose your product assets to potential external tampering. As a result, we need a service such as Oracle’s container registry OCIR.
The re of this blog is going to walk through how to push a container you’ve built into OCIR and a gotcha that can trip up users if you make assumptions about how the registry works.
Build container
Let’s assume you’re building your microservices locally or retrieving vetting 3rd party services for use. In both cases, you want to manually push your assets into OCIR manually rather than have an automated build pipeline do it for you.
This creates a container locally, and we can see the container listed using the command:
docker images
Setup of OCIR
We need an OCIR to target so the easiest thing is to manually create an OCIR instance in one of the regions, for the sake of this illustration we’ll use Ashburn (short code is IAD). To help with the visibility we can put the registry in a separate compartment as a child of the root. Let’s assume we’re going to call the registry GraphQL. So before creating your OCIR set up the compartment as necessary.
fragment of the compartment hierarchy
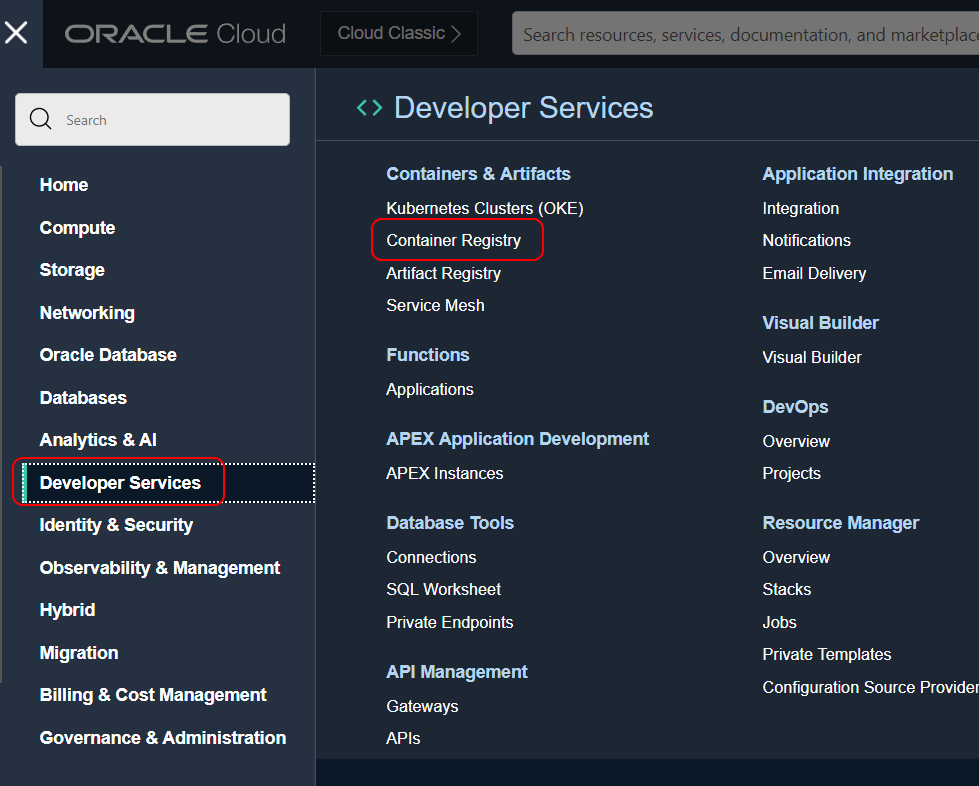
In the screenshot, you can see I’ve created a registry, which is very quick and easy in the UI (in the menu it’s in the Developer Services section).
The Oracle meu to navigate to the OCIR servicethe UI to create a OCIR
Finally, we click on the button to create the specific OCIR.
Deployment…
Having created the image, and with a repo ready we can start the steps of pushing the container to OCIR.
The next step is to tag the created image. This has to be done carefully as the tag needs to reflect where the image is going using the formula <region name>/<tenancy name/<registry name>:<version>. All the registries will be addressed by <region short code>.ocir.io In our case, it would be iad.ocir.io.
docker tag graph-svr:latest iad.ocir.io/ociobenablement/graphql-svr:v0.1-dev
As you may have realized the tag being applied effectively tells OCI which instance of OCIR to place the container in. Getting this wrong can be the core of the gotcha previously mentioned and we’ll elaborate upon it shortly.
To sign in you’ll need an auth token as that is passed as the password. For simplicity, I’ve passed the token in the docker command, which Docker will warn you of as being insecure, and suggest it is passed in as part of a prompt. Note my token will have been changed by the time this is published. The username is built on the structure of <cloud tenancy name>/identitycloudservice/<username>. The identitycloudservice piece only needs to be included for your authentication is managed through IDCS, as is the case here. The final bit is the URI for the appropriate regional OCIR address, as we’ve used previously.
With hopefully a successful authentication response we can push the container. It is worth noting that the Docker authenticated connection will timeout which is why we’ve put everything in place before connecting. The push command is very simple, it is the tag name assigned to the artifact including the version number.
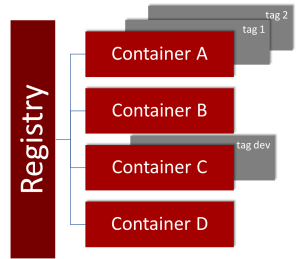
When we deal with repositories from Git to SVN or Apache Archiva to Nexus we work with a repository that holds multiple different assets with multiple versions of those assets. as a result, when we identify an asset uniquely we would expect to name things based on server/location, repository, asset name, and version. However, here each repository is designed for one type of asset but multiple versions. In reality, a Docker repository works in the same manner (but the extended path impact is different).
This means it becomes easy to accidentally define a tag with an extra element. Depending upon your OCI tenancy privileges if you get the path wrong, OCI creates a new root compartment container repository with a name that is a composite of the name elements after the tenancy and puts your artifact in that repository, not the one you expected.
We can address this in several ways, first and probably the best option is to automate the process of loading assets into OCIR, once the process is correct, it will remain correct. Another is to adopt a principle of never holding repositories at the root of a tenancy, which means you can then explicitly remove the permissions to create repositories in that compartment (you’ll need to explicitly grant the permissions elsewhere in the compartment hierarchy because of policy inheritance. This will result in the process of pushing a container to fail because of privileges if the tag is wrong.
Visual representation of structure differences
Repository Structure
Registry Structure
Condensed to a simple script
These steps can be condensed to a simple platform neutral script as follows:
This script would need modifying for each container being built, but you could easily make it parameterized or configuration drive.
A Note on Registry Standards
Oracle’s Container Registry has adopted the Open Registries standard for OCIR. Open Registries come under the Linux Foundation‘s governance. This standard has been adopted by all the major hyperscalers (Google, AWS, Azure, etc). All the technical spec information for the standard is published through GitHub rather than the main website.
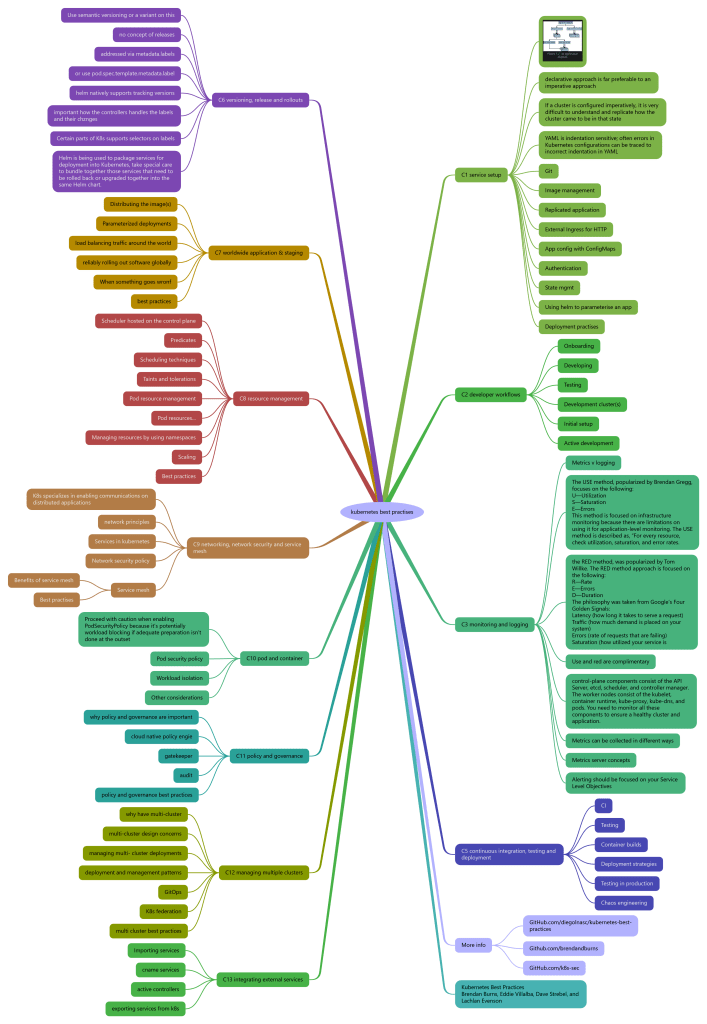
Christian Posta and Rinor Maloku’s book with Manning, Istio In Action has just been published. I’ve previously said it’s a good book, and that’s not surprising given Christian’s role at solo.io. When the final chapters became available I started to go through it in more detail and built a mind map (As with the recent review of Kubernetes best practices). The map can be seen below.
As you can see the map is very substantial reflecting on the depth and value of the book. For those who look at the maps, may notice there are a couple of chapters not fully mapped. I will update the map to fill those gaps in, but given they focus on monitoring and observability, I was less concerned about those areas given my own writing. The book’s exercises are very much built around using Docker Desktop making it very easy to spin up the examples and exercises. If you want to know about Istio Service Mesh on K8s then I’d recommend it.
Reading through the book, I’ve learned details that I was not entirely aware of, for example the integration of non K8s workloads into the mesh. The tuning of Istio to keep it highly performant with a lot of workloads.
I’ve had some time to catch up on books I’d like to read, including Kubernetes Best Practises in the last few weeks. While I think I have a fair handle on Kubernetes, the development of my understanding has been a bit ad-hoc as I’ve dug into different areas as I’ve needed to know more. This meant reading a Dummies/Introduction to entry style guide would, to an extent, likely prove to be a frustrating read. Given this, I went for the best practises book because if I don’t understand the practises, then there are gaps in my understanding still, and I can look at more foundation resources.
As it goes, this book was perfect. It quickly covered the basics of the different aspects of Kubernetes helping to give context to the more advanced aspects, and the best practices become almost a formulated summary in each section. The depth of coverage and detail is certainly very comprehensive, explaining the background of CNI (Container Network Interface) to network-level security within Kubernetes.
The book touched upon Service Meshes such as Istio and Linkerd2 but didn’t go into great depth, but again this is probably down to the fact that Service Mesh ideas are still maturing, and you have initiatives like SMI (Service Mesh Interface still in the CNCF’s sandbox).
In terms of best practices, that really stood out for me:
Use of Taints and Tolerations for refined control of pod deployment (Allowing affinity to be controlled to optimise resilience, or direct types of pod deployment to nodes with specialist capabilities such as GPU).
There are a lot more differences and options then you might realize in terms of ingress controller capabilities, so take time to identify what you may need from an ingress controller.
Don’t forget pods can be scaled vertically with the VPA (Vertical Pod Autoscaler)as well as horizontally through the HPA.
While using a managed persistence service will make statement storage a lot easier, stateful sets will give you a very portable solution.
As with a lot of technical books I read. As I go through the book I build up a mind map of what I think are the key points. Doing so leaves me with a resource I can use as a quick reference, but creating the mind map helps reinforce the learning. So here is the mind map …
We’ve got the peer review comments back on the completed 1st draft back of the book. So I’d like to take this opportunity to thanks those who have been involved as peer reviewers, particularly those involved in the previous review cycles. I hope the reviewers found it satisfying to see between iterations that their suggestions and feedback have been taken on board and where we can.
The feed back is really exciting to read. Some tweaks and refinements to do to address the suggestions made.
The work on the Kubernetes and Docker elements and the chapter which has become available on MEAP has helped round that aspect off. But importantly, the final chapters help address the wider challenges of logging, and some of the feedback positively reflects this.
To paraphrase the comments, we’ve addressed the issues of logging which don’t get the attention that they deserve. Which for me is a success.
The book has had a title change as Manning found that links the book was clashing with other solutions using the term ‘Unified Logging’. With the name change it helps bring the book inline with the Manning naming with their In action series. This means the book website is now https://www.manning.com/books/logging-in-action.
With the name change we’ve agreed that there should an additional chapter added. As I’d written the book with a view that everything we cover applies to both modern solutions such as Microservices coming from the CNCF camp but equally relevant to more traditional IT landscapes. Within the book we have explianed how things are positioned and can be used in Kubernetes, but it was agreed with our editorial team that not tackling the configuration of Fluentd with Kubernetes and Docker was to an extent ignoring a key community that will be using Fluentd. So the new chapter will be introduced to address this aspect.
In terms of progress we’re into the 1’s – 1 Chapter to start (the new one), 1 Chapter back from the Technical Editor (Logging Best Practises) – some edits to be done, 1 Chapter now with the editor (How To Create Custom Plugins), 1 Chapter being finished (Logging Frameworks) and finally 1 peer review cycle to go.
Given the lovely review comments that have been quoted on the book’s page. I can only recommend if you have an interest in logging and monitoring then check it out through Manning Early Access Programme (MEAP).
This is my blog post as part of the Oracle Ground Breakers Appreciation Day (more about this with oracle-base) isn’t about a specific product or feature but an approach or possibly two approaches that exist with many of the PaaS services available from Oracle.
One of the key things that many of Oracle’s products such as Integration Cloud,API Platform and the foundation of Functions (Fn) and Containers is the recognition that many organisations are not so fortunate to be cloud-born, or even working with a cloud-native model for IT. For those organisations who would rather have across location unifying approach, Oracle cloud is not a closed capability like AWS, whilst products like Integration Cloud are at their best on Oracle Cloud Infrastructure, they can be executed in your data centre, or even another cloud.
Whilst the teams I work with experiment and build our service offerings ‘on Oracle’, when we engage with customers to help them with their specific problem spaces, we are more often than not operating in a multi-cloud or on-premises hybrid model.
This hybrid story is helped with a renewed vigour for open source both contributing to but also leading the development of open source. In addition to providing free tiers to some of their stack such as Functions, IaaS and Database (here). Many do forget the Oracle JVM is free as long as you keep up to date, you have got a small footprint Oracle database for free (XE), MySQL is part of the Oracle family. Then many of the modern development technologies are true to the core open-source, Blockchain, Container Engine meaning that the solutions on these layers are portable, can be run on-prem. Yes, Oracle adds value by wrapping these cores with tooling and features that make easier rather than diverging with proprietary Ingress controllers for example.
The irony is that organisations that tend to be associated with a low cost or being faithful to open source goals actually can end up locking you in and appear to be moving away from the original open-source ideals. Consider RedHat, the champion for a lot of open source-based enablement have removed Kubernetes from the official RedHat downloads for their Linux in-favour of a single node license of OpenShift, to get Kubernetes of RHEL you have to go outside of the normal binary source channels (other challenges are documented here).
As a middleware (to use a fading term) or technical architect, I preferred not to get too involved in the detailed OS layer considerations when it can be helped (my Infrastructure Architect colleagues will always know more about NICs, port bonding, kernel versions etc etc than I ever will) and why I prefer to work with PaaS over IaaS.
But there is an undeniable trend where having a greater understanding of the OS is necessary, this is because we’re seeing PaaS expanding to cover code abstracted solutions such as Oracle’s Integration Cloud, Mulesoft, Dell’s Boomi etc. down to every things as code in the form of Terraform, Kubernetes, Docker and of course microservices.
So what does this have to do with OpenShift? Well to apply those heady aspirations we’ve had with middleware of “I can build my solution and run it on my platform anywhere” means in the world of microservices I need to find a common denominator on which I can be portable. This comes in the form of Kubernetes and Docker and we’ll probably see service meshs in due course (Istio, Linkerd etc). Docker obviously brings the need to understand the OS albeit not at the level of bonding network connections, but still a good level of OS knowledge to do things properly. Over the last couple of years there has been a fair bit of work to achieve this with the inertia of Cloud Native Computing Foundation (CNCF), Open Container Initiative (OCI).
So I have an objective to get myself certified as an Oracle Technical Architect. Although the training is only open to Oracle and Partners, the exam is open to all. As you may have guessed from my blog posts I use a lot of Oracle technology. However the Technical Architect examination is based largely on Oracle’s IT Strategies library, and usually referred to as ITSO. Before non-Oracle users switch off, the ITSO is actually built around presenting solid good solution agnostic practises, and only once that is laid out does the material overlay Oracle products. So at least 75% percent of the material applies regardless of the vendor (yes cynics will say the practises will naturally lead you to products – but hey someone has to be bad guy). This actually makes it a worthwhile accreditation – as far as any accreditation can go (no I’ve not done a detailed comparison against Open Group’s Certified Architect – very expensive or the BCS accreditation – bound to BCS membership). TOGAF gives your framework, processes, means to communicate, and the ITSO does well at explaining the technical considerations and could be mapped onto the TOGAFTechnical Reference Model (TRM) and Standards Information Base (SIB).
The point, I wanted to get across was in the ITSO is an element on Management and Monitoring (E16583-03 if you want the document reference on the Oracle Technology Network). It makes a lot of really good points about monitoring challenges such as bottom up approach where people monitor the parts of the full capability that they’re responsible for, rather than developing monitoring from a business perspective. The rationale for adopting the business based approach is explained (this is not to say you don’t go into the technical measures & monitors of looking at your infrastructure, databases, services etc. But from the business approach you will capture the information to understand reporting from a user perspective which is how you’ll here about issues. Through your detailed monitoring decomposition to get the right specific data points you can then look at correlation of monitoring data for root cause analysis, but also see and .
What the I think the document misses, or at least underemphasises is the ever increasing importance of the monitoring and logging of what is happening as systems and environments become ever more elastic and self managing, and have as IBM call it autonomics. or self healing, self scaling characteristics. So consider trying to diagnose a problem when a user complains of intermittent performance issues, but you have Kubernetes or another tool scaling up your environment for a period and then back down. Only through measuring from a business context will you able to understand when the user might perceive performance as an issue. Then with excellent logging and audit data as to what components are doing at all levels – so services maybe behaving perfectly but your scaling mechanisms are scaling back too soon.
This leads to another consideration, for those organisations that absolutely committed to idea of self healing and proving in resilience production, as the famous Netflix Chaos Monkey does. You need to be able to correlate the monkey’s activities to what is happening in your environment. Has the monkey uncovered an issue that manifests in a manner you hadn’t expected and as a result your user see intermittent issues.
This all leads me to a rather good presentation from Jimmi Dyson at RedHat who showed the simple value of ensuring you can get semantic meaning from logging. As that means you and slice and dice the information to get understanding of what is happening and lead to root cause. In Oracle land Oracle Enterprise Manage (OEM) is ensuring the semantic understanding when it come to known products.
I’ve meandered a bit, so key points consider ITSO or any other vendor equivalent for sources of good practise. Monitor and measure from a business perspective, but still ensure your collecting detailed semantically meaningful metrics.
You must be logged in to post a comment.