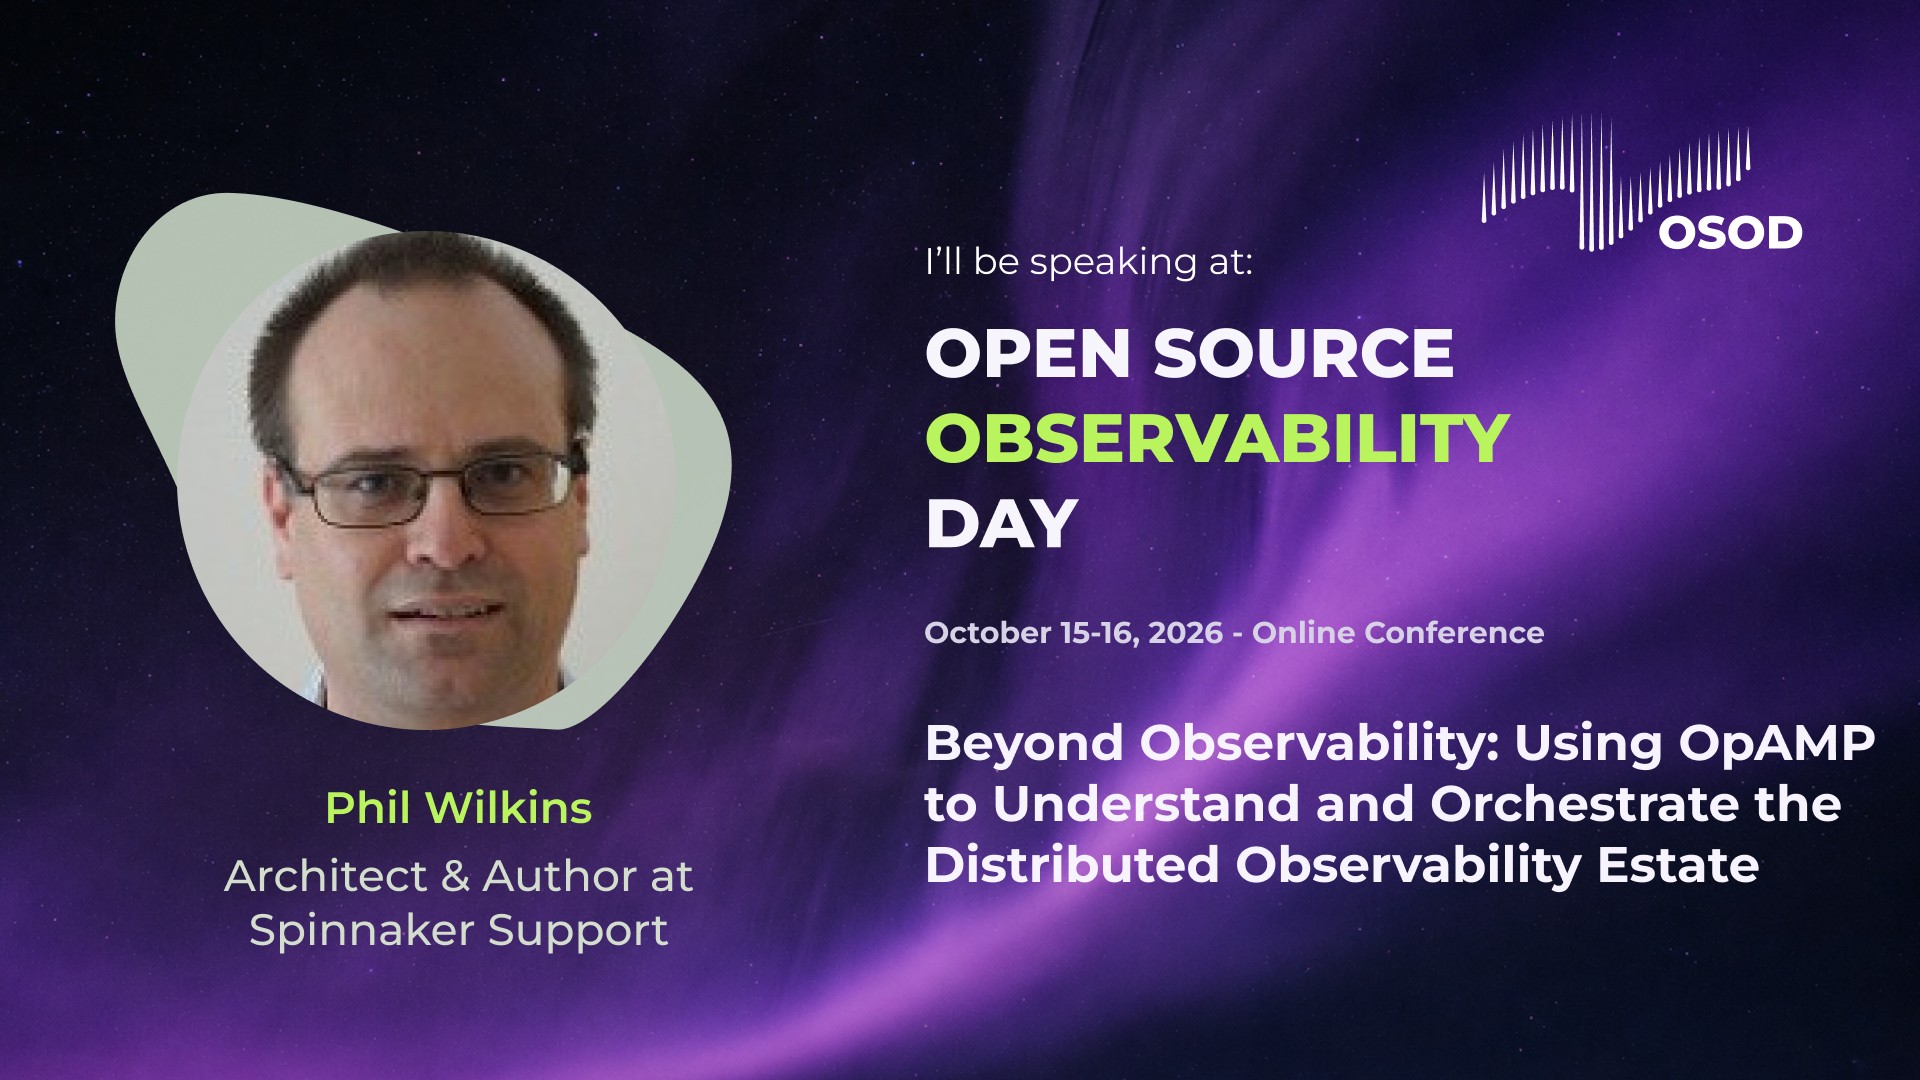
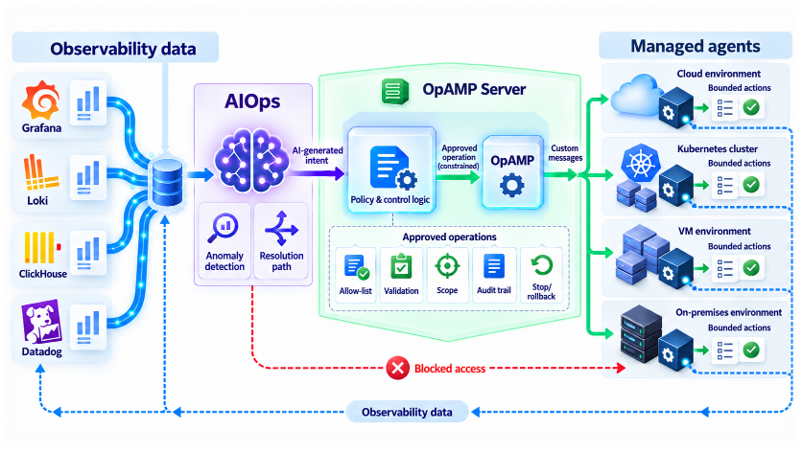
Not only will I be going through the what the spec enables, and the value it aims to support we’ll be touching on how OpAMP can be used to support ChatOps and AIOps. While the idea of unleashing AI Agents onto a production may look pretty scared given all the recent news coming from OpenAI, Anthropic and others on how their latest models are escaping and hacking other web sites. I’ll show how among other things how mixing AIOps nd OpAMP can offer the AI smarts while training deterministic controls.
The session isn’t just slideware, we’ll demo our Open Source OpAMP implementation which gives the foundations for using AIOps. If you want to try the demo yourself we’re in the process of making available in GitHub.
Just a quick post: CNCF Ambassador Dotan Horvits posted a blog on the CNCF website discussing the use of OpAMP and referencing our OpAMP project. Check it out at Operating OpenTelemetry at scale with OpAMP. Ignoring the work we’ve been doing, it’s an interesting read.
With the announcement of Fluent Bit v4 at Kubecon Europe, we thought it worthwhile to take a look at what it means, aside from celebrating 10 years of Fluent Bit.
Firstly, normally using Semantic Versioning would suggest likely breaking (or incompatible changes to use SemVer wording) changes. The good news is that, like all the previous version changes for Fluent Bit the numbering change only reflects the arrival of major new features.
This is good news for me as the author of Logs and Telemetry with Fluent Bit, as it means the book remains entirely relevant. The book obviously won’t address the latest features, but we’ll try to cover those here as supplemental content.
Let’s reflect upon the new features, their benefits, and their implications.
More flexible support for TLS (v1.3, choosing ciphers to enable)
New language for custom plugins in the form of Zig
Security Improvements
While security for many is not something that will get most developers excited about, there are things here that will make a CSO (Chief Security Officer) smile. Any developer who knows implementing security behaviors because it is a good thing, rather than because you have been told to do it, makes a CSO happy, puts them in a good place, to be given some more lianency when there is a need to do something that would get the CSO hot under the collar. Given this, we can now win those points with CSOs by using new Fluent Bit configurations that control TLS versions (1.1 – 1.3) and ciphers to support in use.
But even more fundamental than that are the improvements around basic credentials management. Historically, credentials and tokens had to be explicit in a configuration file or referenced back to an environment variable. Now, such values can come from a file, and as a result, there is no explicitness in the configuration. File security can manage access and visibility of such details. This will also make credentials rotation a lot easier to implement.
Processor Improvements
The processor improvements are probably the most exciting changes. Processors allow us to introduce additional activities within the pipeline as part of a process such as an input, rather than requiring additional buffer fetch and return which we see in standard plugin operations.
Of course, the downside is that if the processor introduces a lot of effort, we can create unexpected problems, such as back pressure, for example, as a result of a processor working hard on an input.
The other factor that extending processors bring is that they are not supported in classic format, meaning that to exploit such formats, you do need to define your configuration using YAML. The only thing I’m not a fan of, is that the configuration for these features does make me think I’m having to read algorithms expressed with Backus Naur form (BNF).
Trace Sampling
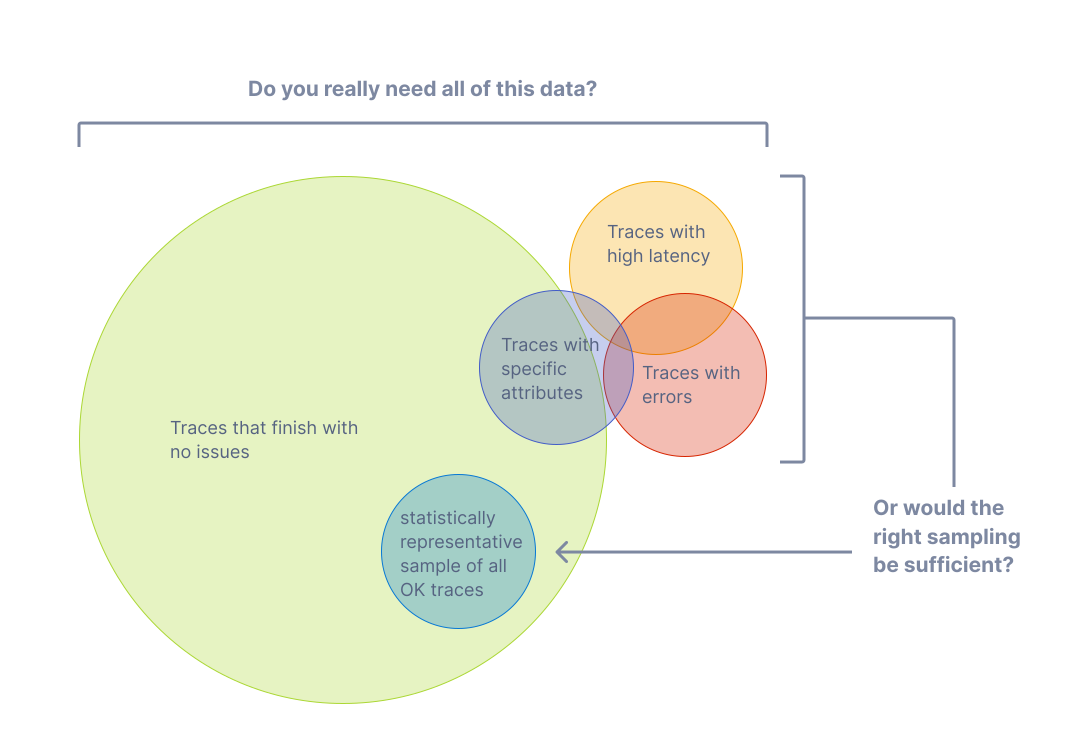
Firstly, the processors supporting OpenTelemetry Tracing can now sample. This is probably Fluent Bit’s only weakness in the Open Telemetry domain until now. Sampling is essential here as traces can become significant as you track application executions through many spans. When combined with each new transaction creating a new trace, traces can become voluminous. To control this explosion on telemetry data, we want to sample traces, collecting a percentage of typical traces (performance, latency, no errors, etc) and the outliers, where tracing will show us where a process is suffering, e.g., an end-to-end process is slowing because of a bottleneck. We can dictate how the sampling is applied based on values of existing attributes, the trace status, status codes, latencies, the number of spans, etc.
Conditionality in Processors
Conditionality makes it easier to respond to aspects of logs. For example, only when the logging payload has several attributes with specific values do we want to filter the event out for more attention. For example, an application reporting that it is starting up, and logs are classified as representing an error – then we may want to add a tag to the event so it can be easily filtered and routed to the escalation process.
Plugins with Zig
The enablement of Zig for plugin development (input, output and filters) is strictly an experimental feature. The contributors are confident they have covered all the typical use cases. But the innate flexibility supporting a language always represents potential edge cases never considered and may require some additional work to address.
Let’s be honest: Zig isn’t a well-known language. So, let’s start by looking briefly at it and why the community has adopted it for custom plugin development as an alternative to the existing options with Lua and WASM.
So Zig has a number of characteristics that align with the Fluent Bit ethos better than Lua and WASM, specifically:
It is a compiled rather than interpreted language, meaning that we reduce the runtime overheads of an interpreter or JIT compiler such as Lua and the proxy layer of WASM. This aligns to be very fast/minimal compute overhead to do its job, – ideal for IoT and minimising the cost of side-care container deployments.
The footprint for the Zig executable is very, very small—smaller than even a C-generated binary! As with the previous point, this lends itself to common Fluent Bit deployments.
The language definition is formally defined, compact, and freely available. This means you should be able to take a tool chain from anyone, and it is easy for specialist chip vendors to provide compilers.
Based on those who have tried, cross-compiling is far easier to deal with than working with GCC, MSVC, etc. Making it a lot easier to develop with the benefits we want from Go. Unlike Go – to connect to the C binary of Fluent Bit doesn’t require the use of a translation layer.
One of Zig’s characteristics that differs from C is its stronger typing and its approach of, rather than prescribing how edge cases are handled, e.g., null pointers, working to prevent you from entering those conditions.
Zig has been around for a few years (the first pre-release was in 2017, and the first non-pre-release was in August 2023). This is long enough for the supporting tooling to be pretty well fleshed out with package management, important building blocks such as the HTTP server, etc.
While asking a large enterprise with more conservative approaches to development (particularly when IT is seen as an overhead, and source of risk rather than a differentiator/revenue generator) to consider adopting Zig could be challenging compared to adopting, say Go. The different potential values here, make for some interesting potential.
Not Only, but Also
While we have made some significant advancements, each Fluent Bit release brings a variety of improvements in its plugins. For example, working with it with eBPF, HTTP output supports more compression techniques, such as Snappy and ZSTD, and Exit having a configurable delay.
The Plus version of library dependencies is being updated to exploit new capabilities or ensure Fluent Bit isn’t using libraries with vulnerabilities.
The API specs created using Open API Specification (OAS) and ASyncAPI specification aren’t just for public API consumption. In today’s world of modular component services that make up a business solution, we’re more than likely to have APIs of one sort or another. These need documenting, perhaps not as robustly as those public-facing ones, but the material needs to be easily accessible.
Spotify’s contribution to the CNCF—Backstage is a great tool for sharing development content, particularly when your document and code repository is at least git-based if not GitHub (you move away from this or don’t easily have permissions to configure application authentication, you can still work with Backstage, but your workload will grow a lot). There is no doubt that Backstage is a very powerful, information-rich product. But that does come at the cost of needing lots of configuration, the generation of metadata descriptors additional to the APIs to be cataloged, etc. All of these can be a little heavy if you’re using Backstage as a low-cost API documentation portal that might fill the gaps that your corporate wiki/doc management (Confluence/SharePoint) solution can’t support (it is one of the very, very few open-source options that can support both OAS and AsyncAPI reader friendly API rendering tools).
We could, of course, adopt the approach of there are free VS Code plugins that can render the friendly views of APIs, so just perform a git pull (or copy the API specs from a central location) to give the nice visualization. This is fine, but the obligation is now on the developer to ensure they have the latest version of the API spec and that they are using VSCode – while it is very dominant as an IDE – not everyone uses it, particularly if you’re working with low code tooling.
There is a fast and inelegant solution to this if you’re not in need of nice features such as attribute-based search and sorting, etc. Both the Open API Specification and the Async API communities have built command line-based renderers that will read your API specification (even if the schema is spread across multiple files) and generate HTML (an index.html file), CCS, and JavaScript renderings that you see in many tools (hyperlinked, folding, with code and payload examples of the API).
So, we need to grab the YAML/JSON specifications and run them through the tool to get the presentation formatting. You do need to get the specs, but we can easily script that with a bit of shell script that retrieves/finds the relevant files from a repository and then runs the CLI utility on the files.
We want to bring the static content to life across the network for developers. So, on a little server, we can host this logic, plus an instance of Apache, IIS, or Nginx if you’re comfortable with one of the industrial superpower web servers. Or use a spin-off project from the Chrome Server called the Simple Web Server. This tool is incredibly simple and provides you with a UI that allows you to configure quickly and easily and then start a web server that can dish up static content. I would hesitate to suggest such an approach for production use cases, but it’s not to be sniffed at for internal solutions, safely behind firewalls, network security, etc.
As all the functionality is dependent on Node, we need both Niode.js and NPM (Node Package Manager). Installing the Node Version Manager (NVM) is the easiest way to do that for Linux, and Mac with the command:
curl -o- https://raw.githubusercontent.com/nvm-sh/nvm/v0.39.7/install.sh | bash

Windows has a separately produced binary called NVM for Windows (which will eventually be superseded by Runtime), which has an installer that can be downloaded from the GitHub releases part of the repo.
Once nvm is installed (and ideally in the OS’ PATH environment variable) we can complete the process with the command:
nvm install lts
Which will see the latest Long Term Support (LTS) version installed.
As the output generated is index.html with subfolders for the stylesheet and Javascript needed, we recommend using the name of the API Spec file (without the postfix, e.g., .yaml) as the folder name.
AsyncAPI
Just Like the Open API command line, we need to install the Async version using the command line:
npm install -g @asyncapi/cli
The equivalent command to generate the HTML is pretty similar, but, note over time, the template-referenced version will evolve (i.e. @2.3.5 to be a newer version)
As you can see, we need to tease out the API files from the source folder, which may contain other resources, even if such resources are schemas that get included in the API (as our APIs grow in scope, we’ll want to break the definitions up to keep things manageable. but also re-use common schema definitions.
The easiest way to do this is to have a text file providing the path and name of the API definition. Each type of API has its own file – removing the need to first work out which type of API needs to be run.
This also means we can read all the API list files to determine then if any API spec pages need to be removed.
Final Thoughts
One of the things we saw when adopting this approach is that the generating process did highlight an issue in the API YAML that the VS Code plugin for Open API didn’t flag, which was the accidental duplication of the operationId when defining an API (an error when creating related API definitions using a bit of cut, paste, and edit).
A static documentation generator is also available for GraphQL (https://2fd.github.io/graphdoc/); although we have not tested it, the available examples, while making the schema navigable, it isn’t as elegant in presenting the details as our Async and Open APIs,
It’s a busy time with books at the moment. I am excited, and pleased to hear that Fernando Harris‘ first book project has been published. It can be found on amazon.com and amazon.co.uk among sites.
Having been fortunate enough to be a reviewer of the book, I can say that what makes this book different from others that examine cloud-native architecture is its holistic approach to the challenge. Successful adoption of cloud-native approaches isn’t just technical (although this is an important element that the book addresses); it also considers organizational, processes, and people dimensions. Without these dimensions, the best technology in the world will only be successful as a result of chance rather than by intent.
As a result, this book guides and connects content to the Kubernetes technical content (technical how-to books we typically see from publishers like Manning and O’Reilly) and the more organizational leadership books that you might expect from IT Revolution (Gene Kim et al.).
A read I’d recommend to any architect or technical lead who wants to understand the different aspects of achieving cloud-native adoption rather than just the mastery of an individual technology.
One of the benefits of using cloud providers is the potential to scale solutions to meet demand by scaling out with additional compute nodes without concern for physical capacity limits (cost considerations are smaller, but still apply). Dynamic scaling is typically driven by monitoring defined groups of nodes for CPU use and when demand hits a threshold an additional node is spun up. Kubernetes can create some more nuanced scaling configurations but this is tends to be used for microservice style solutions.
This is well and fine, but if we need to finesse the configuration to ensure multiple container instances (such as microservices) can be allowed on a single node without compromising the deployment of containers across nodes of a cluster to provide resilience things can get a lot more challenging. We also want to manage the number of active containers – we don’t want to have unnecessary volumes of containers effectively idling. So how do we manage this?
In addition to this, what if we’re using services that demand tens of seconds or even minutes to be spun up to a point of readiness – such as instantiating database servers, adding new nodes to data caches such as Coherence which will need time to clone data, and adjust the demand balancing algorithms? Likewise, for more traditional application servers. Some service calls will impact upstream configuration changes, such as altering load-balancing configurations. Cloud-native Load Balancers typically can understand node groups, but what if your configuration is more nuanced? If you’re running services such as ActiveMQ you need to update all the impacted nodes in a cluster to be aware of the new node. Bottomline is some solutions or solution parts need lead time to handle increased demand?
This points to more advanced, nuanced metrics than simply current CPU load. And possibly the scaling algorithm needs to be aware of lead times of the different types of functionality involved. So how can we advance a more nuanced, and informed scaling logic? You could look at the inbound traffic on firewalls or load balancers. But this will require a fair bit of additional effort to apply application context. For example is the traffic just getting directed to static page content? We do need to derive some context so that the right rules are impacted. Even in simple K8s only hosted solutions a cluster may host services that aren’t related to the changes in demand and need to be scaled as a result.
A use case perspective
Let’s look at this from a hypothetical use case. We’re a music streaming service. Artists can control when their music is made available, but the industry norm is 12:01am on a Friday morning. There is always a demand spike at this time, but the size of the demand spike can vary, with some artists triggering larger spikes (this isn’t directly correlating to an artist’s popularity, some smaller groups can have very enthusiastic fans) – so dynamic scaling is needed, and reactive to demand. Reporting, analytics, and payment services see cyclical bumps around the monthly financial periods. These monthly cyclic activities can also be done during quieter operating hours. So it is clear we may wish to apply logical partitioning, but for maximum cost efficiency keep everything in the same cluster. There are correlations between different service demands. Certain data services see increased demand during the demand spikes and reporting period, but ‘The bottom line is we need to not only address dynamic scaling, but tailor the scaling to different services at different times.
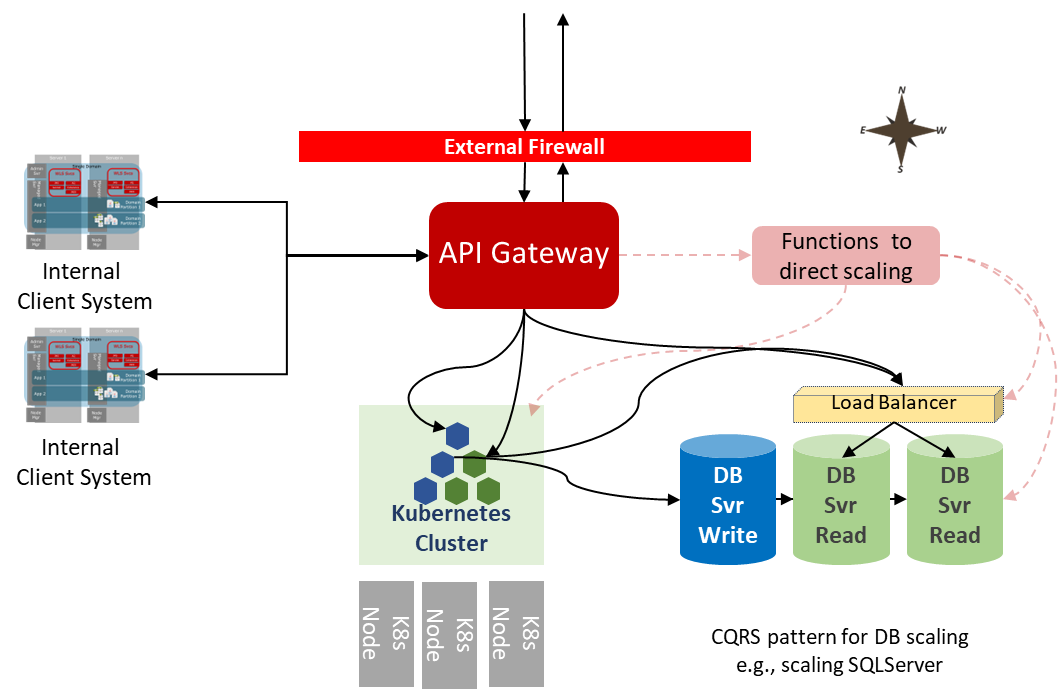
Back to our question – how do we manage the scaling? We could monitor the firewall and load balancer logs and analyze the kinds of requests being received. That would need additional processing logic to determine which services are receiving the traffic. But our API gateway is likely to have that intelligence implicitly in place as we have different API policies for the different types of endpoints. So we can monitor specific endpoints or groups of endpoints very easily – meaning we can infer the types of traffic demand and how to respond. Not only that, we may have API plans in place so we can control priority and prevent the free versions of our service from using APIs to initiate high-quality media streams. So we already have business and specific process meaning. So linking scaling controls such as KEDA (Kubernetes Event-driven Autoscaling) directly to measurements such as plans and specific APIs creates a relatively easy way to control scaling. Further, we may also use the gateways to provide a rate throttle so it’s not possible to crash our backend with an instantaneous spike. This strategy isn’t that different from an approach we’ve demonstrated for scaling message processing backends (see here and here).
Representation of how we can use the metrics from a gateway to not only support the scaling of a K8s cluster but also other cloud services
We can also use the data KEDA can see in terms of node readiness to adjust the API Gateway rate limiting dynamically as well. Either as a direct trigger from the number of active container instances or by triggering a more advanced check because we still have to address our services that need more lead time before relaxing the rate limiting.
Handling slow scaling services
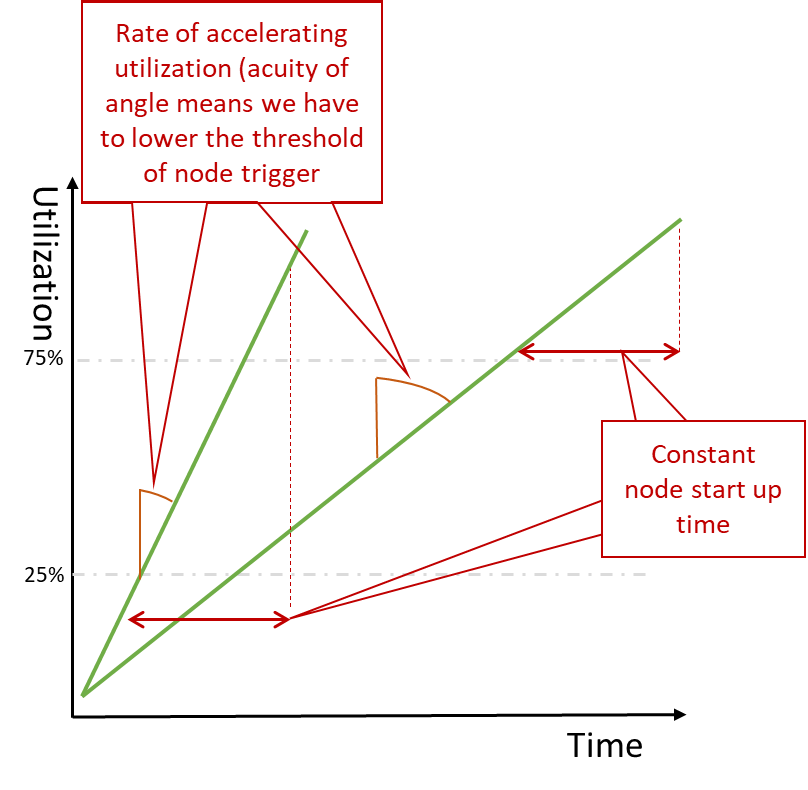
So we’ve got a way of targeting the scaling of services. But what do we do to address the slower scaling services we described? With the data dimensioned, we can do a couple of things. Firstly we can use the rate of change to determine how many nodes to add. A very sudden increase in demand and adding a node at a time will create the effect of the service performance stuttering as it scales, and all additional capacity is suddenly consumed and then scales again. Factoring in the rate of change to the workload threshold and the context of which services could generate the increased workload can be used to not only determine which databases may need scaling but also be used to adjust the threshold of workload that actually triggers the node introduction. So a sudden increase in demand on services that are known to create a lot of DB activity is then met with dropping the threshold that triggers new nodes from, say, 75% to 25% so we effectively start the nodes on a lower threshold, means the process is effectively started sooner.
With different rates of utilization growth, we can see that we need to alter the trigger threshold for launching new resources
For this to be fully effective we do need the Gateway tracking traffic both internally (East-West) and inbound (North-South). Using the gateway with East-West traffic means that we can establish an anti corruption layer.
Conclusion
Not all parts of a solution will be instantaneous in scaling – regardless of how fast the code startup cycle might be, some services have to address the need to move large chunks of data before becoming ready, e.g., in-memory databases. Some services may not have been built for the latest business demands and the ability to exploit cloud scale and dynamic scaling. Some services need time to adjust configurations.
We may also need to adjust our protection mechanisms if we’re protecting against service overloading.
Scaling capabilities that have response latency to the scaling process can be addressed by achieving earlier, more intelligent recognition of need than warning simply by CPU loads hitting a threshold. The intelligence that can be derived from implicit service context simplifies the effort in creating such intelligence and makes it easier to recognize the change. API Gateways, message queues, message streams, and shared data storage are all means that, by their nature, have implicit context.
Pushing the recognition towards the front of the process creates milliseconds or possibly seconds more warning of the demand than waiting for the impacted nodes to see compute spikes.
We’ve got the peer review comments back on the completed 1st draft back of the book. So I’d like to take this opportunity to thanks those who have been involved as peer reviewers, particularly those involved in the previous review cycles. I hope the reviewers found it satisfying to see between iterations that their suggestions and feedback have been taken on board and where we can.
The feed back is really exciting to read. Some tweaks and refinements to do to address the suggestions made.
The work on the Kubernetes and Docker elements and the chapter which has become available on MEAP has helped round that aspect off. But importantly, the final chapters help address the wider challenges of logging, and some of the feedback positively reflects this.
To paraphrase the comments, we’ve addressed the issues of logging which don’t get the attention that they deserve. Which for me is a success.
To varying degrees, most techies are aware of the security vulnerabilities identified in the OWASPTop 10 (SQL Injection, trying to homebrew Identity management etc), although I still sometimes have conversations where I feel the need to get the yellow or red card out. But the bottom line is that these risks are perhaps more appreciated because it is easier to understand external entities attacking seeking direct attacks to disrupt or access information. But there are often subtler and at least more costly to repair attacks such as internal attacks and indirect attacks such as compromising software deployment mechanisms.
This, later attack Is not a new risk, as you can see from the following links, been recognised by the security community for some time (you can find academic papers going back 10+ years looking at the security risks for Yum and RPM for example).
But software is becoming ever more pervasive, we’re more aware than ever that maintaining software to the latest releases means that known vulnerabilities are closed. As a result, we have seen a proliferation in mechanisms to recognise the need to update and deploying updates. 10 years ago, updating frameworks where typically small in number and linked to vendors who could/had to invest in making the mechanisms as a secure as possible – think Microsoft, Red Hat. However we have seen this proliferate, any browser worthy of attention has automated updating let alone the wider software tools. As development has become more polyglot every language has its central repos of framework libraries (maven central, npm, chocolatey ….). Add to this the growth in multi-cloud and emphasis on micro deployments to support microservices and the deployment landscape gets larger and ever more complex and therefore vulnerable.
The news about Oracle offering some free cloud services ‘for life’ is making an impact. But, the free services don’t end there. The pricing of some other native cloud services includes some free bands. So it’s worth keeping an eye on the fine print. I wouldn’t be surprised if we see limited capacity access in other areas.
Oracle Functions – whilst the core of this service is built on the open-source Fn Project (also largely driven by Oracle) the managed service has a free tier allowing up to 2 million invocations that can consume 400, 000 gigabytes of memory per second use (details can be seen here). Plenty enough to experiment with the concepts behind Serverless aka FaaS capabilities.
Oracle Notifications whilst focussed on the technical side of gathering key event data from OCI and its services, as the document states “sending notifications to numerous interested parties, or even synchronizing the moving parts of a distributed application” – this obviously means a service with characteristics a bit like AWS’ SNS. Like SNS it can be hooked up to email and other HTTPS services using Oracle Events which also has free use. Events is particularly interesting as it is bases the event structure on the CNCF CloudEvents spec. There is an excellent illustration of such a use case in the Oracle blogs here.
It will be interesting to see if we a similar trend with other Oracle cloud-native services. A new take on the now-defunct Application Container Cloud Service (ACCS) would be an ideal vehicle – whether there is sufficient demand for such a capability is not clear (it would in effect be an always live service like a Kubernetes solution, but the simpler, smaller footprint more like Functions in a multi-tenant environment. At the same time, it doesn’t have potential latency of a Function being activated).
So recently we have been working on ‘knowing what I don’t know’ when it comes to Open Tracing and how such tech may intersect with traditional logging and the use of FluentD.
Whilst I have a good relationship with Packt, the fact they published the book is pretty much coincidental.
Understanding tracing over traditional logging is very important when moving into the world of microservices and reactive frameworks such as Node.js where threads are picked up and put down, you don’t know where and when the next service in a solution will pick up the next related activity. When you add to this solutions are more polyglot than ever – not only in the sense of different languages that may be used but a more diverse source of middle features e.g. historically you’d probably use JMS based messaging if you’re a Java developer and MSMQ for .net. Now you may be using AWS SNS as easily as Kafka. This means the mechanisms for passing and tracing events through these services need to be more unifying than ever.




 or red card out. But the bottom line is that these risks are perhaps more appreciated because it is easier to understand external entities attacking seeking direct attacks to disrupt or access information. But there are often subtler and at least more costly to repair attacks such as internal attacks and indirect attacks such as compromising software deployment mechanisms.
 The news about Oracle offering some


You must be logged in to post a comment.