• Home
  • Site Aliases
    • www.cloud-native.info
  • About
    • Background
    • Presenting Activities
    • Internet Profile
      • LinkedIn
    • About
  • Books & Publications
    • Log Generator
    • Logs and Telemetry using Fluent Bit
      • Fluent Bit book
      • Book Resources in GitHub
      • Fluent Bit Classic to YAML Format configurations
    • Logging in Action with Fluentd, Kubernetes and More
      • Logging in Action with Fluentd – Book
      • Fluentd Book Resources
      • Fluentd & Fluent Bit Additional stuff
    • API & API Platform
      • API Useful Resources
    • Oracle Integration
      • Book Website
      • Useful Reading Sources
    • Publication Contributions
  • Resources
    • GitHub
    • Oracle Integration Site
    • Oracle Resources
    • Mindmaps Index
    • Useful Tech Resources
      • Fluentd & Fluent Bit Additional stuff
      • Recommended Tech Podcasts
      • Official Sources for Product Logos
      • Java and Graal Useful Links
      • Python Setup & related stuff
  • Music
    • Monster On Music
    • Music Listening
    • Music Reading

Phil (aka MP3Monster)'s Blog

~ from Technology to Music

Phil (aka MP3Monster)'s Blog

Category Archives: Technology

Fluent Bit with Chat Ops

12 Monday Aug 2024

Posted by mp3monster in Fluentbit, General, Technology

≈ Leave a comment

Tags

chatops, conference, Fluent, FluentBit, Open Source Monitoring Conference, osmc, osmc.de, Patrick Stephens, slack, tools

My friend Patrick Stephens and Fluent Bit committer will present at the Open Source Monitoring Conference in Germany later this year. Unfortunately, I won’t be able to make it, as my day job is closing in on its MVP product release.

The idea behind the presentation is to improve the ability to detect and respond to Observability events, as the time between detection and action is the period during which your application is experiencing harm, such as lost revenue, data corruption, and so on.

The stable configuration and code base version is in the Fluent GitHub repository; my upstream version is here. We first discussed the idea back in February and March. We applied simpler rules to determine if the log event was critical.

Advancing the idea

Now that my book is principally in the hands of the publishers (copy editing and print preparation, etc.), we can revisit this and exploit features in more recent releases to make it slicker and more effective, for example.

  • Stream processor, so a high frequency of smaller issues could trigger a notification using the stream processor.
  • We can also use the stream processor to provide a more elegant option to avoid notification storms.
  • The new processors will make it easier to interact with metrics, so any application natively producing metrics.

Other tooling

With the book’s copy editing done, we have a bit more time to turn to our other Fluent Bit project … Fluent Bit configuration converter, both classic to YAML, and implementing a Fluentd to Fluent Bit 1st stage converter. You can see this in GitHub here and here.

Share this:

  • Click to share on Facebook (Opens in new window) Facebook
  • Click to share on X (Opens in new window) X
  • Click to share on Pocket (Opens in new window) Pocket
  • Click to share on Reddit (Opens in new window) Reddit
  • Click to email a link to a friend (Opens in new window) Email
  • Click to share on WhatsApp (Opens in new window) WhatsApp
  • Click to print (Opens in new window) Print
  • Click to share on Tumblr (Opens in new window) Tumblr
  • Click to share on Mastodon (Opens in new window) Mastodon
  • Click to share on Pinterest (Opens in new window) Pinterest
  • More
  • Click to share on Bluesky (Opens in new window) Bluesky
  • Click to share on LinkedIn (Opens in new window) LinkedIn
Like Loading...

Two weeks of Fluent Bit

30 Tuesday Jul 2024

Posted by mp3monster in Fluentbit, General

≈ Leave a comment

Tags

book, configurtation, FluentBit, logging, telemetry, tool, YAML

The last couple of weeks have been pretty exciting. Firstly, we have Fluent Bit 3.1 released, which brings further feature development to Fluent Bit, making it even more capable with Fluent Bit handling of Open Telemetry (OTel).

The full details of the release are available at https://fluentbit.io/announcements/v3.1.0/

Fluent Bit classic to YAML

We’ve been progressing the utility, testing and stabilizing it, and making several releases accordingly. The utility is packaged as a Docker image, and the regression test tool also runs as a Docker image.

Moving forward, we’ll start branching to develop significant changes to keep the trunk stable, including experimenting with the possibility of extending the tool to help port Fluentd to Fluent Bit YAML configurations. The tools won’t be able to do everything, but I hope they will help address the core structural challenges and flag differences needing manual intervention.

Book

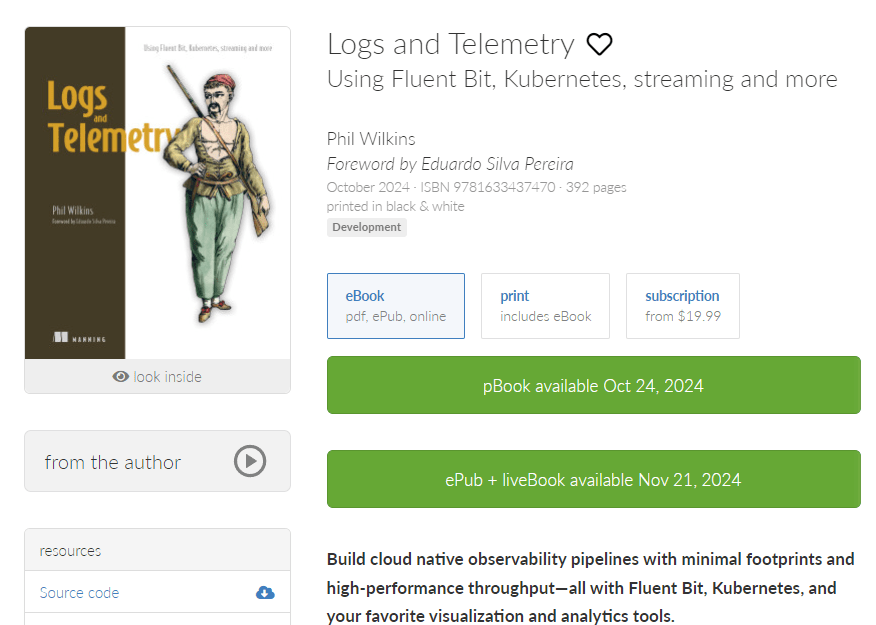
The Fluent Bit book has moved into its last phase with the start of copy editing. We have also had a shift in the name to Logs and Telemetry using Fluent Bit, Kubernetes, streaming, and more, or just Logs and Telemetry using Fluent Bit. The book fundamentally hasn’t changed. There is still a lot of Kubernetes-related content, but it helps focus on what Fluent Bit is all about rather than being just another Kubernetes book.

Logs and Telemetry using Fluent Bit
Logs and Telemetry using Fluent Bit, Kubernetes, streaming and more

Share this:

  • Click to share on Facebook (Opens in new window) Facebook
  • Click to share on X (Opens in new window) X
  • Click to share on Pocket (Opens in new window) Pocket
  • Click to share on Reddit (Opens in new window) Reddit
  • Click to email a link to a friend (Opens in new window) Email
  • Click to share on WhatsApp (Opens in new window) WhatsApp
  • Click to print (Opens in new window) Print
  • Click to share on Tumblr (Opens in new window) Tumblr
  • Click to share on Mastodon (Opens in new window) Mastodon
  • Click to share on Pinterest (Opens in new window) Pinterest
  • More
  • Click to share on Bluesky (Opens in new window) Bluesky
  • Click to share on LinkedIn (Opens in new window) LinkedIn
Like Loading...

Fluent Bit config from classic to YAML

02 Tuesday Jul 2024

Posted by mp3monster in Fluentbit, General, java, Technology

≈ 1 Comment

Tags

configuration, development, FluentBit, format, tool, YAML

Fluent Bit supports both a classic configuration file format and a YAML format. The support for YAML reflects industry direction. But if you’ve come from Fluentd to Fluent Bit or have been using Fluent Bit from the early days, you’re likely to be using the classic format. The differences can be seen here:

[SERVICE]
    flush 5
    log_level debug
[INPUT]
   name dummy
   dummy {"key" : "value"}
   tag blah
[OUTPUT]
   name stdout
   match *
#
# Classic Format
#
service:
    flush: 1
    log_level: info
pipeline:
    inputs:
        - name: dummy
          dummy: '{"key" : "value"}'
          tag: blah
    outputs:
        - name: stdout
          match: "*"
#
# YAML Format
#

Why migrate to YAML?

Beyond having a consistent file format, the driver is that some new features are not supported by the classic format. Currently, this is predominantly for Processors; it is fair to assume that any other new major features will likely follow suit.

Migrating from classic to YAML

The process for migrating from classic to YAML has two dimensions:

  • Change of formatting
    • YAML indentation and plugins as array elements
    • addressing any quirks such as wildcard (*) being quoted, etc
  • Addressing constraints such as:
    • Using include is more restrictive
    • Ordering of inputs and outputs is more restrictive – therefore match attributes need to be refined.

None of this is too difficult, but doing it by hand can be laborious and easy to make mistakes. So, we’ve just built a utility that can help with the process. At the moment, this solution is in an MVP state. But we hope to have beefed it up over the coming few weeks. What we plan to do and how to use the util are all covered in the GitHub readme.

The repository link (fluent-bit-classic-to-yaml-converter)

Update 4th July 24

A quick update to say that we now have a container configuration in the repository to make the tool very easy to use. All the details will be included in the readme, along with some additional features.

Update 7th July

We’ve progressed past the MVP state now. The detected include statements get incorporated into a proper include block but commented out.

We’ve added an option to convert the attributes to use Kubernetes idiomatic form, i.e., aValue rather than a_value.

The command line has a help option that outputs details such as the control flags.

Update 12th July

In the last couple of days, we pushed a little too quickly to GitHub and discovered we’d broken some cases. We’ve been testing the development a lot more rigorously now, and it helps that we have the regression container image working nicely. The Javadoc is also generating properly.

We have identified some edge cases that need to be sorted, but most scenarios have been correctly handled. Hopefully, we’ll have those edge scenarios fixed tomorrow, so we’ll tag a release version then.

Share this:

  • Click to share on Facebook (Opens in new window) Facebook
  • Click to share on X (Opens in new window) X
  • Click to share on Pocket (Opens in new window) Pocket
  • Click to share on Reddit (Opens in new window) Reddit
  • Click to email a link to a friend (Opens in new window) Email
  • Click to share on WhatsApp (Opens in new window) WhatsApp
  • Click to print (Opens in new window) Print
  • Click to share on Tumblr (Opens in new window) Tumblr
  • Click to share on Mastodon (Opens in new window) Mastodon
  • Click to share on Pinterest (Opens in new window) Pinterest
  • More
  • Click to share on Bluesky (Opens in new window) Bluesky
  • Click to share on LinkedIn (Opens in new window) LinkedIn
Like Loading...

Logging Frameworks that can communicate directly with Fluent Bit

13 Thursday Jun 2024

Posted by mp3monster in Fluentbit, General, Technology

≈ Leave a comment

Tags

.net, Erlang, Fluentbit, Go, Golang, java, languages, libraries, loggiong, node.js, OCAML, perl, PHP, python, Ruby, Scala

While the typical norm is for applications to write their logs to file or to stdout (console), this isn’t the most efficient way to handle logs (particularly given I/O performance for the storage devices). Many logging frameworks have addressed this by providing more direct outputs to commonly used services such as ElasticSearch and OpenSearch. This is fine, but the only downside is that there is no means for an intermediary layer to preprocess, filter, and route (potentially to multiple services). These constraints can be overcome by using an intermediary service such as Fluent Bit or Fluentd.

Many logging frameworks can work with Fluentd by supporting the HTTP or Forward protocols Fluentd supports out of the box. But as both Fluent Bit and Fluentd are interchangeable with these protocols and logging framework that supports Fluentd, by implication also supports Fluent Bit, not to mention Fluent Bit supports OpenTelemetry.

The following table identifies a range of frameworks that can support communicating directly with Fluent Bit. It is not exhaustive but does provide broad coverage. We’ll update the table as we discover new frameworks that can communicate directly.

Latest Version …

Logging Frameworks and Fluent Bit and Fluentd connectivity
LanguageFramework / LibraryProtocol(s)Commentary
JavaLog4J2HTTP AppenderSend JSON payloads over HTTP (use HTTP input plugin)
Javafluent-logger-javaForward
Pythoncore languageHTTP HandlerProvides the means to send logs over HTTP – means Fluent Bit input handler can manage
Pythonfluent-logger-python
Fluent Logger
ForwardUses the Forward protocol meaning it can gain the efficiencies from msgpack.
Maintained by the Fluent community
Node.jsfluent-logger-nodeForwardIt uses the Forward protocol, meaning it can gain efficiencies from msgpack.
Maintained by the Fluent community
Node.jsWinstonHTTP

Forward
Winston is designed as a simple and universal logging library supporting multiple transports.
Winston includes transport support for HTTP in its core. There is also a Transport implementation for native Fluent https://github.com/sakamoto-san/winston-fluent
Node.jsPino (Pino-fluent extension)Logger integrated into the Pino logging framework
Go (Golang)fluent-logger-golangForwardIt uses the Forward protocol, meaning it can gain efficiencies from msgpack.
Maintained by the Fluent community
.Net (C# VB.Net etc)NLog (NLog.Targets.Fluentd)An NLog target – works with .Net
.Net (C# VB.Net etc)Log4NetLog4Net Appender
.NetSerilog (Fluent Sink)Forward and HTTPSupports both HTTP and nativbe Fluentd/FluentBit
Rubyfluent-logger-rubyForwardIt uses the Forward protocol, meaning it can gain efficiencies from msgpack.
Maintained by the Fluent community
PHPfluent-logger-phpForwardIt uses the Forward protocol, meaning it can gain efficiencies from msgpack.
Maintained by the Fluent community
Perlfluent-logger-perlForwardIt uses the Forward protocol, meaning it can gain efficiencies from msgpack.
Maintained by the Fluent community
Scalafluent-logger-scalaForwardIt uses the Forward protocol, meaning it can gain efficiencies from msgpack.
Maintained by the Fluent community
Erlangfluent-logger-erlangForward
It uses the Forward protocol, meaning it can gain efficiencies from msgpack.
Maintained by the Fluent community
OCAMLfluent-logger-ocamlForward
It uses the Forward protocol, meaning it can gain efficiencies from msgpack.
Maintained by the Fluent community
RustRust Logging framework extension for Fluent BitRust crate for logging to Fluent Bit
DelphiQuickloggerHTTP

Share this:

  • Click to share on Facebook (Opens in new window) Facebook
  • Click to share on X (Opens in new window) X
  • Click to share on Pocket (Opens in new window) Pocket
  • Click to share on Reddit (Opens in new window) Reddit
  • Click to email a link to a friend (Opens in new window) Email
  • Click to share on WhatsApp (Opens in new window) WhatsApp
  • Click to print (Opens in new window) Print
  • Click to share on Tumblr (Opens in new window) Tumblr
  • Click to share on Mastodon (Opens in new window) Mastodon
  • Click to share on Pinterest (Opens in new window) Pinterest
  • More
  • Click to share on Bluesky (Opens in new window) Bluesky
  • Click to share on LinkedIn (Opens in new window) LinkedIn
Like Loading...

A Fast (and Dirty) Way to Publish API specs

03 Monday Jun 2024

Posted by mp3monster in APIs & microservices, General, Technology

≈ Leave a comment

Tags

API, AstyncAPI, AsyncAPI, Backstage, CLI, CNCF, Git, GitHub, npm, OAS, Open API, Simple Web Server

The API specs created using Open API Specification (OAS) and ASyncAPI specification aren’t just for public API consumption. In today’s world of modular component services that make up a business solution, we’re more than likely to have APIs of one sort or another. These need documenting, perhaps not as robustly as those public-facing ones, but the material needs to be easily accessible.

Spotify’s contribution to the CNCF—Backstage is a great tool for sharing development content, particularly when your document and code repository is at least git-based if not GitHub (you move away from this or don’t easily have permissions to configure application authentication, you can still work with Backstage, but your workload will grow a lot). There is no doubt that Backstage is a very powerful, information-rich product. But that does come at the cost of needing lots of configuration, the generation of metadata descriptors additional to the APIs to be cataloged, etc. All of these can be a little heavy if you’re using Backstage as a low-cost API documentation portal that might fill the gaps that your corporate wiki/doc management (Confluence/SharePoint) solution can’t support (it is one of the very, very few open-source options that can support both OAS and AsyncAPI reader friendly API rendering tools).

We could, of course, adopt the approach of there are free VS Code plugins that can render the friendly views of APIs, so just perform a git pull (or copy the API specs from a central location) to give the nice visualization. This is fine, but the obligation is now on the developer to ensure they have the latest version of the API spec and that they are using VSCode – while it is very dominant as an IDE – not everyone uses it, particularly if you’re working with low code tooling.

There is a fast and inelegant solution to this if you’re not in need of nice features such as attribute-based search and sorting, etc. Both the Open API Specification and the Async API communities have built command line-based renderers that will read your API specification (even if the schema is spread across multiple files) and generate HTML (an index.html file), CCS, and JavaScript renderings that you see in many tools (hyperlinked, folding, with code and payload examples of the API).

So, we need to grab the YAML/JSON specifications and run them through the tool to get the presentation formatting. You do need to get the specs, but we can easily script that with a bit of shell script that retrieves/finds the relevant files from a repository and then runs the CLI utility on the files.

We want to bring the static content to life across the network for developers. So, on a little server, we can host this logic, plus an instance of Apache, IIS, or Nginx if you’re comfortable with one of the industrial superpower web servers. Or use a spin-off project from the Chrome Server called the Simple Web Server. This tool is incredibly simple and provides you with a UI that allows you to configure quickly and easily and then start a web server that can dish up static content. I would hesitate to suggest such an approach for production use cases, but it’s not to be sniffed at for internal solutions, safely behind firewalls, network security, etc.

Steps in summary:

  • Install NPM
  • Install a Simpler Web Server – Apache, Nginx, or even Simple Web Server
  • Install the CLI tools for OpenAPI and AsyncAPI
  • Script to identify API documents and use the CLIs

Steps …

As all the functionality is dependent on Node, we need both Niode.js and NPM (Node Package Manager). Installing the Node Version Manager (NVM) is the easiest way to do that for Linux, and Mac with the command:

curl -o- https://raw.githubusercontent.com/nvm-sh/nvm/v0.39.7/install.sh | bash

Windows has a separately produced binary called NVM for Windows (which will eventually be superseded by Runtime), which has an installer that can be downloaded from the GitHub releases part of the repo.

Once nvm is installed (and ideally in the OS’ PATH environment variable) we can complete the process with the command:

nvm install lts

Which will see the latest Long Term Support (LTS) version installed.

Open API

To install Open API using NPM:

npm install @openapitools/openapi-generator-cli -g

The command that we will need to wrap in a script is:

npx @openapitools/openapi-generator-cli generate -i <your-open-api-spec.yaml> -g html2 -o <your-output-folder-for-this-api>

As the output generated is index.html with subfolders for the stylesheet and Javascript needed, we recommend using the name of the API Spec file (without the postfix, e.g., .yaml) as the folder name.

AsyncAPI

Just Like the Open API command line, we need to install the Async version using the command line:

npm install -g @asyncapi/cli

The equivalent command to generate the HTML is pretty similar, but, note over time, the template-referenced version will evolve (i.e. @2.3.5 to be a newer version)

asyncapi generate fromTemplate <your-async-api-spec.yaml> @asyncapi/html-template@2.3.5 -o ./<your-output-folder-for-this-api> --force-write

Scripting the Process

As you can see, we need to tease out the API files from the source folder, which may contain other resources, even if such resources are schemas that get included in the API (as our APIs grow in scope, we’ll want to break the definitions up to keep things manageable. but also re-use common schema definitions.

The easiest way to do this is to have a text file providing the path and name of the API definition. Each type of API has its own file – removing the need to first work out which type of API needs to be run.

This also means we can read all the API list files to determine then if any API spec pages need to be removed.

Final Thoughts

One of the things we saw when adopting this approach is that the generating process did highlight an issue in the API YAML that the VS Code plugin for Open API didn’t flag, which was the accidental duplication of the operationId when defining an API (an error when creating related API definitions using a bit of cut, paste, and edit).

A static documentation generator is also available for GraphQL (https://2fd.github.io/graphdoc/); although we have not tested it, the available examples, while making the schema navigable, it isn’t as elegant in presenting the details as our Async and Open APIs,
Share this:

  • Click to share on Facebook (Opens in new window) Facebook
  • Click to share on X (Opens in new window) X
  • Click to share on Pocket (Opens in new window) Pocket
  • Click to share on Reddit (Opens in new window) Reddit
  • Click to email a link to a friend (Opens in new window) Email
  • Click to share on WhatsApp (Opens in new window) WhatsApp
  • Click to print (Opens in new window) Print
  • Click to share on Tumblr (Opens in new window) Tumblr
  • Click to share on Mastodon (Opens in new window) Mastodon
  • Click to share on Pinterest (Opens in new window) Pinterest
  • More
  • Click to share on Bluesky (Opens in new window) Bluesky
  • Click to share on LinkedIn (Opens in new window) LinkedIn
Like Loading...

Useful Quick Reference Links when Writing API Specs

13 Monday May 2024

Posted by mp3monster in APIs & microservices, General, Technology

≈ Leave a comment

Tags

API, Async, development, OAS

Whether you’re writing Asynchronous or Open APIs unless you’re doing it pretty much constantly, it is useful to have links to the specific details, to quickly check the less commonly used keywords, or to check whether you’re not accidentally mixing OpenAPI with AsyncAPI or the differences between version 2 or version 3 of the specs. So here are the references I keep handy:

  • API Handyman’s excellent OpenAPI Map and his spec navigator for Async and OpenAPI
  • Async API Schema (v3) and v2.6
  • Open API Specification (3.1)
  • JSON Schema
  • YAML Schema
  • Common Mark (as allowed in AsyncAPI for formatting text)

There are some useful ISO Specs for common data types like dates. Ideally, if you’re working in a specific industry domain, it is worth evaluating the industry standard definitions (even if you elect to use entire standardized objects). But when you’re not in such a position, it is at least work using standard ways of representing data—it saves on documentation effort.

  • ISO Message Catalog covers a wide range from Swift to Telecos (emphasis is on financial-related standards)
  • ISO 3166 – Country Codes
  • ISO 639 – Language Codes
  • ISO 8601 Date & Time

Not a standard, but still an initiative to promote consistency back by the likes of Microsoft etc, so could provide some insights/ideas/templates for common data structures – https://schema.org/

There are, of course, a lot of technology-centered standards such as media streaming, use of HTTP, etc.

These and many more resources are in my Tech resources.

Share this:

  • Click to share on Facebook (Opens in new window) Facebook
  • Click to share on X (Opens in new window) X
  • Click to share on Pocket (Opens in new window) Pocket
  • Click to share on Reddit (Opens in new window) Reddit
  • Click to email a link to a friend (Opens in new window) Email
  • Click to share on WhatsApp (Opens in new window) WhatsApp
  • Click to print (Opens in new window) Print
  • Click to share on Tumblr (Opens in new window) Tumblr
  • Click to share on Mastodon (Opens in new window) Mastodon
  • Click to share on Pinterest (Opens in new window) Pinterest
  • More
  • Click to share on Bluesky (Opens in new window) Bluesky
  • Click to share on LinkedIn (Opens in new window) LinkedIn
Like Loading...

Fluent Bit Book – Blogged Extracts

12 Sunday May 2024

Posted by mp3monster in Books, Fluentbit, manning

≈ Leave a comment

Tags

blog, book, Calyptia, FluentBit

The Calyptia team has been publishing some extracts from Fluent Bit with Kubernetes, you can check them out at:

  • Explaining the Fluent Bit processor
  • Fluent Bit and Fluentd – a child or a successor?

Keep an eye on the Calyptia blog for more to come.

The book isn’t too far away from reaching publication, we’re a couple of weeks away from starting the final copy edit process.

Share this:

  • Click to share on Facebook (Opens in new window) Facebook
  • Click to share on X (Opens in new window) X
  • Click to share on Pocket (Opens in new window) Pocket
  • Click to share on Reddit (Opens in new window) Reddit
  • Click to email a link to a friend (Opens in new window) Email
  • Click to share on WhatsApp (Opens in new window) WhatsApp
  • Click to print (Opens in new window) Print
  • Click to share on Tumblr (Opens in new window) Tumblr
  • Click to share on Mastodon (Opens in new window) Mastodon
  • Click to share on Pinterest (Opens in new window) Pinterest
  • More
  • Click to share on Bluesky (Opens in new window) Bluesky
  • Click to share on LinkedIn (Opens in new window) LinkedIn
Like Loading...

Checking your OpenTelemetry pipeline with Telemetrygen

30 Tuesday Apr 2024

Posted by mp3monster in Fluentbit, Fluentd, General, Technology

≈ Leave a comment

Tags

Docker, docker compose, FluentBit, Go, logs, metrics, OpenTelemetry, signals, Telemetrygen, Traces

Testing OpenTelemetry configuration pipelines without resorting to instrumented applications, particularly for traces, can be a bit of a pain. Typically, you just want to validate you can get an exported/generated signal through your pipeline, which may not be the OpenTelemetry Collector (e.g., FluentBit or commercial solutions such as DataDog). This led to the creation of Tracegen, and then the larger Telementrygen.

You can use Tracegen or Telemetrygen by either downloading and running the Go app from GitHub or using the Docker file. But there are a couple of challenges:

  • On initial investigation, these utilities appear wrapped up in the larger opentelemetry-collector-contrib. While potentially useful, shaking out your OTel pipelining is somewhat overkill.
  • We can install the app locally with the following command, but then we need to set up Golang in the environment.
go install github.com/open-telemetry/opentelemetry-collector-contrib/cmd/telemetrygen@latest
  • Fortunately, there is a Docker image that just contains the tool, but to use it, we need to know what the parameters are to override the container defaults. The only irritant is that you either need to mess about with the container to get at the information (i.e., run the — help options) or install the utility (the parameters are not in the GitHub docs), so we’ve teased out all the options into the following table.

The following table’s Signal column All means it can be applied to Metrics, Traces, or Logs. Otherwise we’ve named the signal type that the parameter can be used with.

SignalParameter/FlagDescription
Trace–batchWhether to batch traces (default true)
All–ca-cert stringTrusted Certificate Authority to verify server certificate
Traces–child-spans intClient certificate file

All
–client-key stringClient private key file
All–duration durationFor how long to run the test
All-h, –help {traces|metrics|logs}help – with give you the basic help if no parameter is passed. Or the signal type help when used with the signal name e.g. telemetrygen traces --help
All–interval durationReporting interval (default 1s)
Traces–marshalWhether to marshal trace context via HTTP headers
All–mtlsWhether to require client authentication for mTLS
All–otlp-attributes map[string]stringCustom resource attributes to use. The value is expected in the format key=”value”. Note you may need to escape the quotes when using the tool from a cli. Flag may be repeated to set multiple attributes (e.g --otlp-attributes key1=\"value1\" --otlp-attributes key2=\"value2\")
All–otlp-endpoint stringDestination endpoint for exporting logs, metrics and traces
All–otlp-header map[string]stringCustom header to be passed along with each OTLP request. The value is expected in the format key=”value”. Note you may need to escape the quotes when using the tool from a cli. Flag may be repeated to set multiple headers (e.g --otlp-header key1=\"value1\" --otlp-header key2=\"value2\")
All–otlp-httpWhether to use HTTP exporter rather than a gRPC one
All–otlp-http-url-path stringWhich URL path to write to (default "/v1/traces")
All–otlp-insecureWhether to enable client transport security for the exporter’s grpc or http connection
All–rate intApproximately how many metrics per second each worker should generate. Zero means no throttling.
Traces–service stringService name to use (default "telemetrygen")
Traces–size intDesired minimum size in MB of string data for each trace generated. This can be used to test traces with large payloads, i.e. when testing the OTLP receiver endpoint max receive size.
Traces–span-duration durationThe duration of each generated span. (default 123µs)
Traces–status-code stringStatus code to use for the spans, one of (Unset, Error, Ok) or the equivalent integer (0,1,2) (default “0”)
All–telemetry-attributes map[string]stringNumber of traces to generate in each worker (ignored if the duration is provided) (default 1)
Traces–traces intNumber of traces to generate in each worker (ignored if duration is provided) (default 1)
All–workers intNumber of workers (goroutines) to run (default of 1)
Metrics–metric-type metricTypeNumber of metrics to generate in each worker (ignored if the duration is provided) (default 1)
Metrics–metrics intNumber of logs to generate in each worker (ignored if the duration is provided) (default 1)
Logs–body stringBody of the log (default “the message”)
Logs–logs intThe severity number of the log ranges from 1 to 24 (inclusive) (default 9)
Logs–severity-number int32The severity number of the log ranges from 1 to 24 (inclusive) (default 9)
Logs–severity-text stringSeverity text of the log (default “Info”)
All the configuration parameters for Telemetrygen

It is worth noting that while Tracegen has similar configuration parameters, they aren’t exactly the same in the CLI, often one dash rather than two in the name for example.

The following is a simple Docker compose file that can help you use the container to conduct local testing of your collector. In this configuration, we’re sending a trace to the host machine with HTTPS disabled.

services:
  web:
    image: ghcr.io/open-telemetry/opentelemetry-collector-contrib/telemetrygen:latest
    network_mode: host
    entrypoint:
      [
        "/telemetrygen",
        "traces",
        "--otlp-insecure",
        "--otlp-endpoint",
        "host.docker.internal:4317",
      ]

Share this:

  • Click to share on Facebook (Opens in new window) Facebook
  • Click to share on X (Opens in new window) X
  • Click to share on Pocket (Opens in new window) Pocket
  • Click to share on Reddit (Opens in new window) Reddit
  • Click to email a link to a friend (Opens in new window) Email
  • Click to share on WhatsApp (Opens in new window) WhatsApp
  • Click to print (Opens in new window) Print
  • Click to share on Tumblr (Opens in new window) Tumblr
  • Click to share on Mastodon (Opens in new window) Mastodon
  • Click to share on Pinterest (Opens in new window) Pinterest
  • More
  • Click to share on Bluesky (Opens in new window) Bluesky
  • Click to share on LinkedIn (Opens in new window) LinkedIn
Like Loading...

Observing the Observer (Fluent Bit monitoring)

25 Thursday Apr 2024

Posted by mp3monster in Fluentbit, General, Technology

≈ Leave a comment

Tags

development, FluentBit, Grafana, Jaeger, logs, metrics, OpenSearch, Prometheus, Traces

In the Fluent Bit book I touch upon the point that we should be observing the observer. After all, if we don’t monitor our observability stack, then we’ll be operating blind and may never know until things go catastrophically wrong, and we’re getting complaints that production business solutions are down. One of the peer review comments was it would be really good to have a visual representation in the book. While I’d love to incorporate such diagrams, for them to be readable, they do use up a lot of space on the printed page, and very long chapters can also put some readers off. So, given the point wasn’t a key theme, we simply couldn’t incorporate the diagram.

But the suggestion is a good one. So we’ve created the visual representation here.

Annotated diagram showing how Fluent Bit could be used to monitor an open-source observation stack.

The diagram shows how we can monitor our observation tech stack so we don’t become ‘blind’ without knowing about it. The Outflow from the right of the diagram would send a signal to a notification service, which could be as simple as email or as user-friendly as Slack. We’ve indicated which kinds of metrics, logs, and traces could offer the most value from our observation tech stack.

If we’re running everything within a Kubernetes cluster, it would be easy to say we don’t need such a sophisticated setup as we can use Kubernetes liveness probes if the containers are well configured. While it is true if one of our services starts to fail, a liveness check should pick it up and recycle the container. But such probes only worry about the HTTP response code, not the cause. If we don’t monitor and capture more information we’ll never understand the problem. At worst we could end up seeing Kubernetes starting and then killing our containers in a vicious cycle and struggling to resolve the cause. So collecting the logs and metrics remains just as important.

How to Publish Fluent Bit Metrics and Logs

To publish Fluent Bit’s metrics to Prometheus, we need to configure the fluentbit-metrics input plugin (it does sound odd as an input, but there are reasons that become clearer in the book). We then route the output that supports using Fluent Bit as a Prometheus node exporter or makes use of the remote write API.

The log output for Fluent Bit can be configured via the command line or in the SERVICE blog (using the attributes log_file and log_level in the configuration file. Today this is setting the log threshold and identifying the log file. We can then, of course, configure a tail input plugin against the file if we want to send the logs to OpenSearch. We can also set plugin-specific logging thresholds as overrides to the Fluent Bit wide setting in the SERVICE block of configuration.

Configuring the other monitoring tools

  • Grafana‘s configuration will allow it to publish Prometheus scrapable metrics and Traces that are OTLP compliant can be found documented here.
  • Prometheus provides metrics on itself (details here) and logging controls as part of its command line and generates logfmt or JSON logs, details here.
  • OpenSearch‘s logs can be accessed as documented here. The Logs are created with Log4j2, which means out of the box, it will be easy to parse them. Configuring the output of slow query reports does need to be switched on. OpenSearch also illustrates a pre OpenTelemetry/OpenMetrics approach to sharing internal metrics by writing them as logs. However, there are ways to convert such log events to OTLP Metrics with Fluent Bit.
  • Jaeger provides metrics endpoints that are Prometheus-compatible, along with JSON-based logs, and are documented here. There is some support for tracing.

Share this:

  • Click to share on Facebook (Opens in new window) Facebook
  • Click to share on X (Opens in new window) X
  • Click to share on Pocket (Opens in new window) Pocket
  • Click to share on Reddit (Opens in new window) Reddit
  • Click to email a link to a friend (Opens in new window) Email
  • Click to share on WhatsApp (Opens in new window) WhatsApp
  • Click to print (Opens in new window) Print
  • Click to share on Tumblr (Opens in new window) Tumblr
  • Click to share on Mastodon (Opens in new window) Mastodon
  • Click to share on Pinterest (Opens in new window) Pinterest
  • More
  • Click to share on Bluesky (Opens in new window) Bluesky
  • Click to share on LinkedIn (Opens in new window) LinkedIn
Like Loading...

InfoQ Article on Fluent Bit with MultiCloud

23 Tuesday Apr 2024

Posted by mp3monster in Cloud, Fluentbit, Technology

≈ Leave a comment

Tags

article, FluentBit, InfoQ, multicloud

I’m excited to say that we’ve had an article on Fluent Bit and multi-cloud published on InfoQ. Check it out at https://www.infoq.com/articles/multi-cloud-observability-fluent-bit/ . This is another first for me.

As you may have guessed from the title, the article is about how Fluent Bit can support multi-cloud use cases. As part of the introduction, I walked through some of the challenges that aren’t so obvious when operating with a multi-cloud scenario. The following diagram illustrates that.

The book is now in its final peer review process with updates also being sent to the Early Access Program as well (MEAP).

Fluent Bit book cover

Share this:

  • Click to share on Facebook (Opens in new window) Facebook
  • Click to share on X (Opens in new window) X
  • Click to share on Pocket (Opens in new window) Pocket
  • Click to share on Reddit (Opens in new window) Reddit
  • Click to email a link to a friend (Opens in new window) Email
  • Click to share on WhatsApp (Opens in new window) WhatsApp
  • Click to print (Opens in new window) Print
  • Click to share on Tumblr (Opens in new window) Tumblr
  • Click to share on Mastodon (Opens in new window) Mastodon
  • Click to share on Pinterest (Opens in new window) Pinterest
  • More
  • Click to share on Bluesky (Opens in new window) Bluesky
  • Click to share on LinkedIn (Opens in new window) LinkedIn
Like Loading...
← Older posts
Newer posts →

    I work for Oracle, all opinions here are my own & do not necessarily reflect the views of Oracle

    • About
      • Internet Profile
      • Music Buying
      • Presenting Activities
    • Books & Publications
      • Logging in Action with Fluentd, Kubernetes and More
      • Logs and Telemetry using Fluent Bit
      • Oracle Integration
      • API & API Platform
        • API Useful Resources
        • Useful Reading Sources
    • Mindmaps Index
    • Monster On Music
      • Music Listening
      • Music Reading
    • Oracle Resources
    • Useful Tech Resources
      • Fluentd & Fluent Bit Additional stuff
        • Logging Frameworks and Fluent Bit and Fluentd connectivity
        • REGEX for BIC and IBAN processing
      • Java and Graal Useful Links
      • Official Sources for Product Logos
      • Python Setup & related tips
      • Recommended Tech Podcasts

    Oracle Ace Director Alumni

    TOGAF 9

    Logs and Telemetry using Fluent Bit


    Logging in Action — Fluentd

    Logging in Action with Fluentd


    Oracle Cloud Integration Book


    API Platform Book


    Oracle Dev Meetup London

    Blog Categories

    • App Ideas
    • Books
      • Book Reviews
      • manning
      • Oracle Press
      • Packt
    • Enterprise architecture
    • General
      • economy
      • ExternalWebPublications
      • LinkedIn
      • Website
    • Music
      • Music Resources
      • Music Reviews
    • Photography
    • Podcasts
    • Technology
      • AI
      • APIs & microservices
      • chatbots
      • Cloud
      • Cloud Native
      • Dev Meetup
      • development
        • languages
          • java
          • node.js
      • drone
      • Fluentbit
      • Fluentd
      • logsimulator
      • mindmap
      • OMESA
      • Oracle
        • API Platform CS
          • tools
        • Helidon
        • ITSO & OEAF
        • Java Cloud
        • NodeJS Cloud
        • OIC – ICS
        • Oracle Cloud Native
        • OUG
      • railroad diagrams
      • TOGAF
    • xxRetired
    • AI
    • API Platform CS
    • APIs & microservices
    • App Ideas
    • Book Reviews
    • Books
    • chatbots
    • Cloud
    • Cloud Native
    • Dev Meetup
    • development
    • drone
    • economy
    • Enterprise architecture
    • ExternalWebPublications
    • Fluentbit
    • Fluentd
    • General
    • Helidon
    • ITSO & OEAF
    • java
    • Java Cloud
    • languages
    • LinkedIn
    • logsimulator
    • manning
    • mindmap
    • Music
    • Music Resources
    • Music Reviews
    • node.js
    • NodeJS Cloud
    • OIC – ICS
    • OMESA
    • Oracle
    • Oracle Cloud Native
    • Oracle Press
    • OUG
    • Packt
    • Photography
    • Podcasts
    • railroad diagrams
    • Technology
    • TOGAF
    • tools
    • Website
    • xxRetired

    Enter your email address to subscribe to this blog and receive notifications of new posts by email.

    Join 2,555 other subscribers

    RSS

    RSS Feed RSS - Posts

    RSS Feed RSS - Comments

    January 2026
    M T W T F S S
     1234
    567891011
    12131415161718
    19202122232425
    262728293031  
    « Nov    

    Twitter

    Tweets by mp3monster

    History

    Speaker Recognition

    Open Source Summit Speaker

    Flickr Pics

    Gogo Penguin at the BarbicanGogo Penguin at the BarbicanGogo Penguin at the BarbicanGogo Penguin at the Barbican
    More Photos

    Social

    • View @mp3monster’s profile on Twitter
    • View philwilkins’s profile on LinkedIn
    • View mp3monster’s profile on GitHub
    • View mp3monster’s profile on Flickr
    • View mp3muncher’s profile on WordPress.org
    • View philmp3monster’s profile on Twitch
    Follow Phil (aka MP3Monster)'s Blog on WordPress.com

    Blog at WordPress.com.

    • Subscribe Subscribed
      • Phil (aka MP3Monster)'s Blog
      • Join 233 other subscribers
      • Already have a WordPress.com account? Log in now.
      • Phil (aka MP3Monster)'s Blog
      • Subscribe Subscribed
      • Sign up
      • Log in
      • Report this content
      • View site in Reader
      • Manage subscriptions
      • Collapse this bar
     

    Loading Comments...
     

    You must be logged in to post a comment.

      Privacy & Cookies: This site uses cookies. By continuing to use this website, you agree to their use.
      To find out more, including how to control cookies, see here: Our Cookie Policy
      %d