With KubeCon Europe happening this week, it felt like a good moment to break cover on this pet project.
If you are working with Fluent Bit at any scale, one question keeps coming up: how do we consistently control and observe all those edge agents, especially outside a Kubernetes-only world?
This is exactly the problem the OpAMP specification is trying to solve. At its core, OpAMP defines a standard contract between a central server and distributed agents/supervisors, so status, health, commands, and config-related interactions follow one protocol instead of ad-hoc integration per tool.
That is where this project sits. We’re implementing the OpAMP specification to support Fluent Bit (and later Fluentd).
In this implementation, we have:
a provider (the OpAMP server), and
a consumer acting as a supervisor to manage Fluent Bit deployments.
Right now, we are focused on Fluent Bit first. That is deliberate: it keeps scope practical while we validate the framework. The same framework is being shaped so it can evolve to support Fluentd as well.
The provider/server is the control plane endpoint. It tracks clients, accepts status, queues commands, and returns instructions using OpAMP payloads over HTTP or WebSocket.
The consumer/supervisor handles the local execution and reporting. It launches Fluent Bit, polls local health/status endpoints, sends heartbeat and metadata to the provider, and handles inbound commands (including custom ones). The server and supervisor can be deployed independently, which is important for real-world rollout patterns.
Because they follow the OpAMP protocol model, clients and servers can be interchanged with other OpAMP-compliant implementations (although we’ve not yet tested this aspect of the development).
Together, they give us a manageable, spec-aligned path to coordinating distributed Fluent Bit nodes without hard-coding one-off control logic into every environment.
Deployment options and scripts
There are a few practical ways to get started quickly:
Deploy just the server/provider using scripts/run_opamp_server.sh (or scripts/run_opamp_server.cmd on Windows).
Deploy just the client/supervisor using scripts/run_supervisor.sh (or scripts/run_supervisor.cmd on Windows).
Run both components either together in a single environment or independently across different hosts.
The scripts will set up a virtual environment and retrieve the necessary dependencies.
If you want an initial MCP client setup as part of your workflow, there are helper scripts for that too:
mcp/configure-codex-fastmcp.sh and mcp/configure-codex-fastmcp.ps1
mcp/configure-claude-desktop-fastmcp.sh and mcp/configure-claude-desktop-fastmcp.ps1
Server screenshots
Here is a first server view we can include in the post:
The Server Console with a single Agent
The UI is still evolving, but this gives a concrete picture of the provider side control plane we are discussing.
What the OpAMP server (provider) does
The provider is responsible for the shared view of fleet state and intent.
Today it provides:
OpAMP transport endpoints (/v1/opamp) over HTTP and WebSocket.
API and UI endpoints to inspect clients and queue actions.
In-memory command queueing per client.
Emission of standard command payloads (for example, restart).
Emission of custom message payloads for custom capabilities.
Discovery and publication of custom capabilities supported by the server side command framework.
Operationally, this means we can queue intent once at the server and let the next client poll/connection cycle deliver that action in protocol-native form.
What the supervisor (consumer) does for Fluent Bit
The supervisor is the practical glue between OpAMP and Fluent Bit:
Starts Fluent Bit as a local child process.
Parses Fluent Bit config details needed for status polling.
Polls Fluent Bit local endpoints on a heartbeat loop.
Builds and sends AgentToServer messages (identity, capabilities, health/status context).
Receives ServerToAgent responses and dispatches commands.
Handles custom capabilities and custom messages through a handler registry.
So for Fluent Bit specifically, the supervisor gives us a way to participate in OpAMP now, even before native in-agent OpAMP support is universal.
And to be explicit: this is the current target. Fluentd support is a planned evolution of this same model, not a separate rewrite.
Where ChatOps fits
ChatOps is where this gets interesting for day-2 operations.
In this implementation, ChatOps commands are carried as OpAMP custom messages (custom capability org.mp3monster.opamp_provider.chatopcommand). The provider queues the custom command, and the supervisor’s ChatOps handler executes it by calling a local HTTP endpoint on the configured chat_ops_port.
That gives us a cleaner control path:
Chat/user intent can go to the central server/API.
The server routes to the right node through OpAMP.
The supervisor performs the local action and can return failure context when local execution fails.
This is a stronger pattern than directly letting chat tooling call every node individually, and it opens the door to better auditability and policy controls around who can trigger what.
Reality check: we are still testing
This is important: we are still actively testing functionality.
Current status is intentionally mixed:
Core identity, sequencing, capabilities, disconnect handling, and heartbeat/status pathways are in place.
Some protocol fields are partial, todo, or long-term backlog.
Custom capabilities/message pathways are implemented as a practical extension point and are still being hardened with test coverage and real-world runs.
So treat this as a working framework with proven pieces, not a finished all-capabilities implementation.
What is coming next (based on docs/features.md)
Near-term priorities include:
stricter header/channel validation,
heartbeat validation hardening,
payload validation against declared capabilities,
server-side duplicate websocket connection control behaviour.
Broader roadmap themes include:
authentication/security model for APIs and UI,
persistence in the provider,
richer UI controls for node/global polling and multi-node config push,
certificate and signing workflows,
packaging improvements.
And yes, a key strategic direction is evolving the framework abstraction so it can support Fluentd in due course, not only Fluent Bit. Some feature areas (like package/status richness) make even more sense in that broader collector ecosystem.
Why this matters
OpAMP gives us a standard envelope for control-plane interactions; the server/supervisor split gives us pragmatic deployment flexibility; and ChatOps provides a human-friendly control surface.
Put together, this becomes a useful pattern for managing telemetry agents in real environments where fleets are mixed, rollout velocity matters, and “just redeploy everything” is not always an option.
If you are evaluating this right now, the right mindset is: useful today, promising for tomorrow, and still under active verification as we close feature gaps.
Using a collaboration or chat platform like Slack could ease and even accelerate the response to operational issues (as systems process more data and faster).
Conversational collaborative platforms are pervasive, usable across many devices, while still being able to enforce security. Taking away the need to log in to laptops, signing in to portals before you can even start considering what the problem is.
The quicker we can understand and resolve things, the better, and the less potential damage that may need to be addressed. Using collaboration platforms does this through collaborative work, and the fact that we can see content quickly and easily because of the push model of tools like Slack.
Any Observability agent tool that can detect issues as data is moved to a backend aggregation and analytics tool gives you a head start. This is something Fluent Bit can do easily.
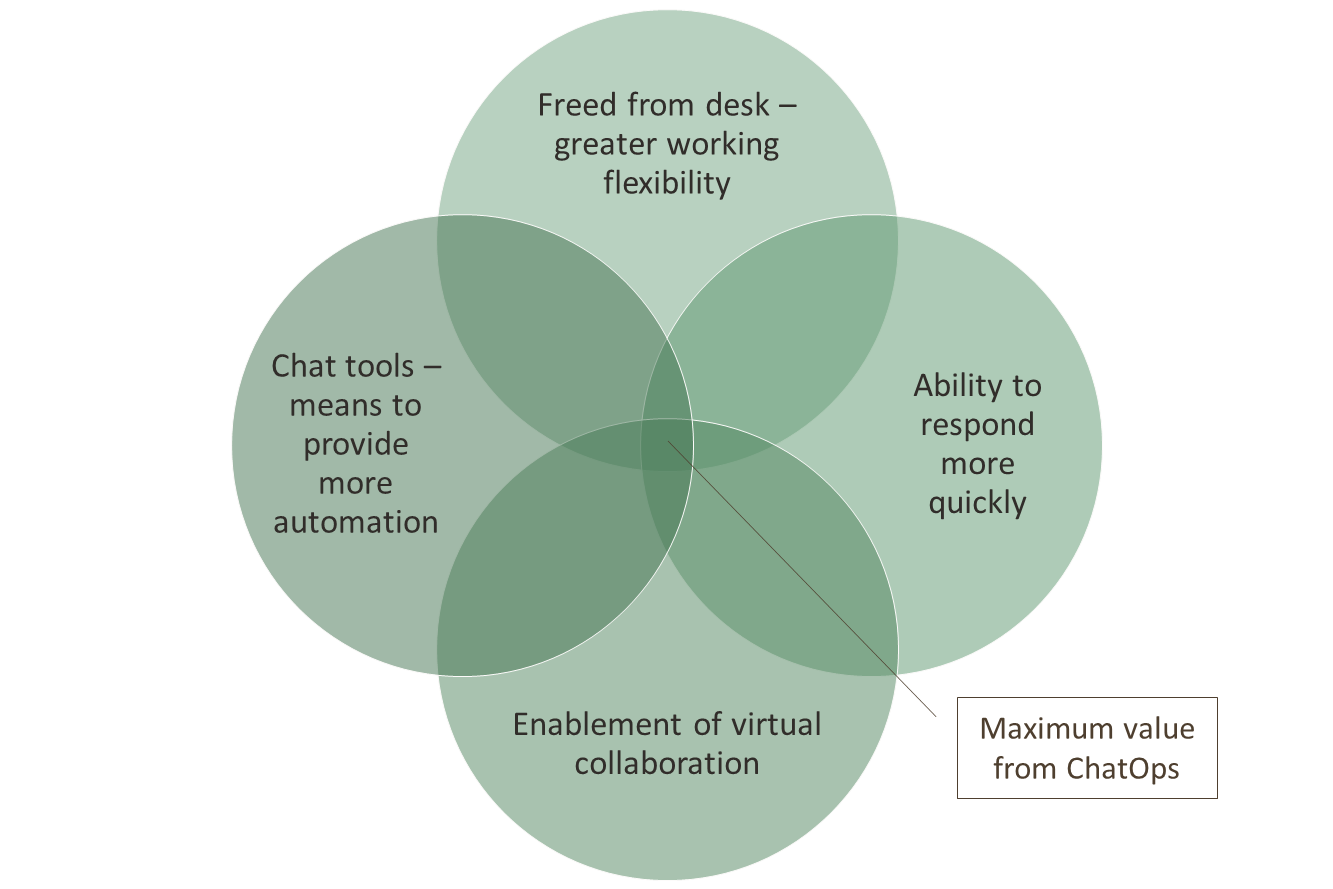
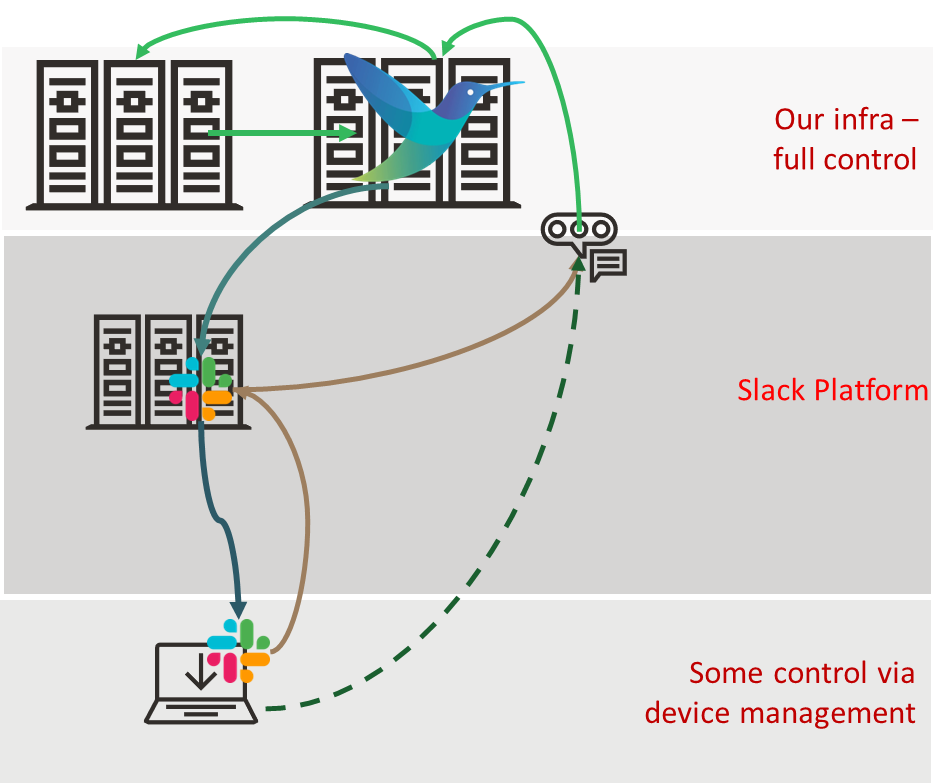
We illustrated it this way:
The ChatOps deployment looked like:
How do we advance this?
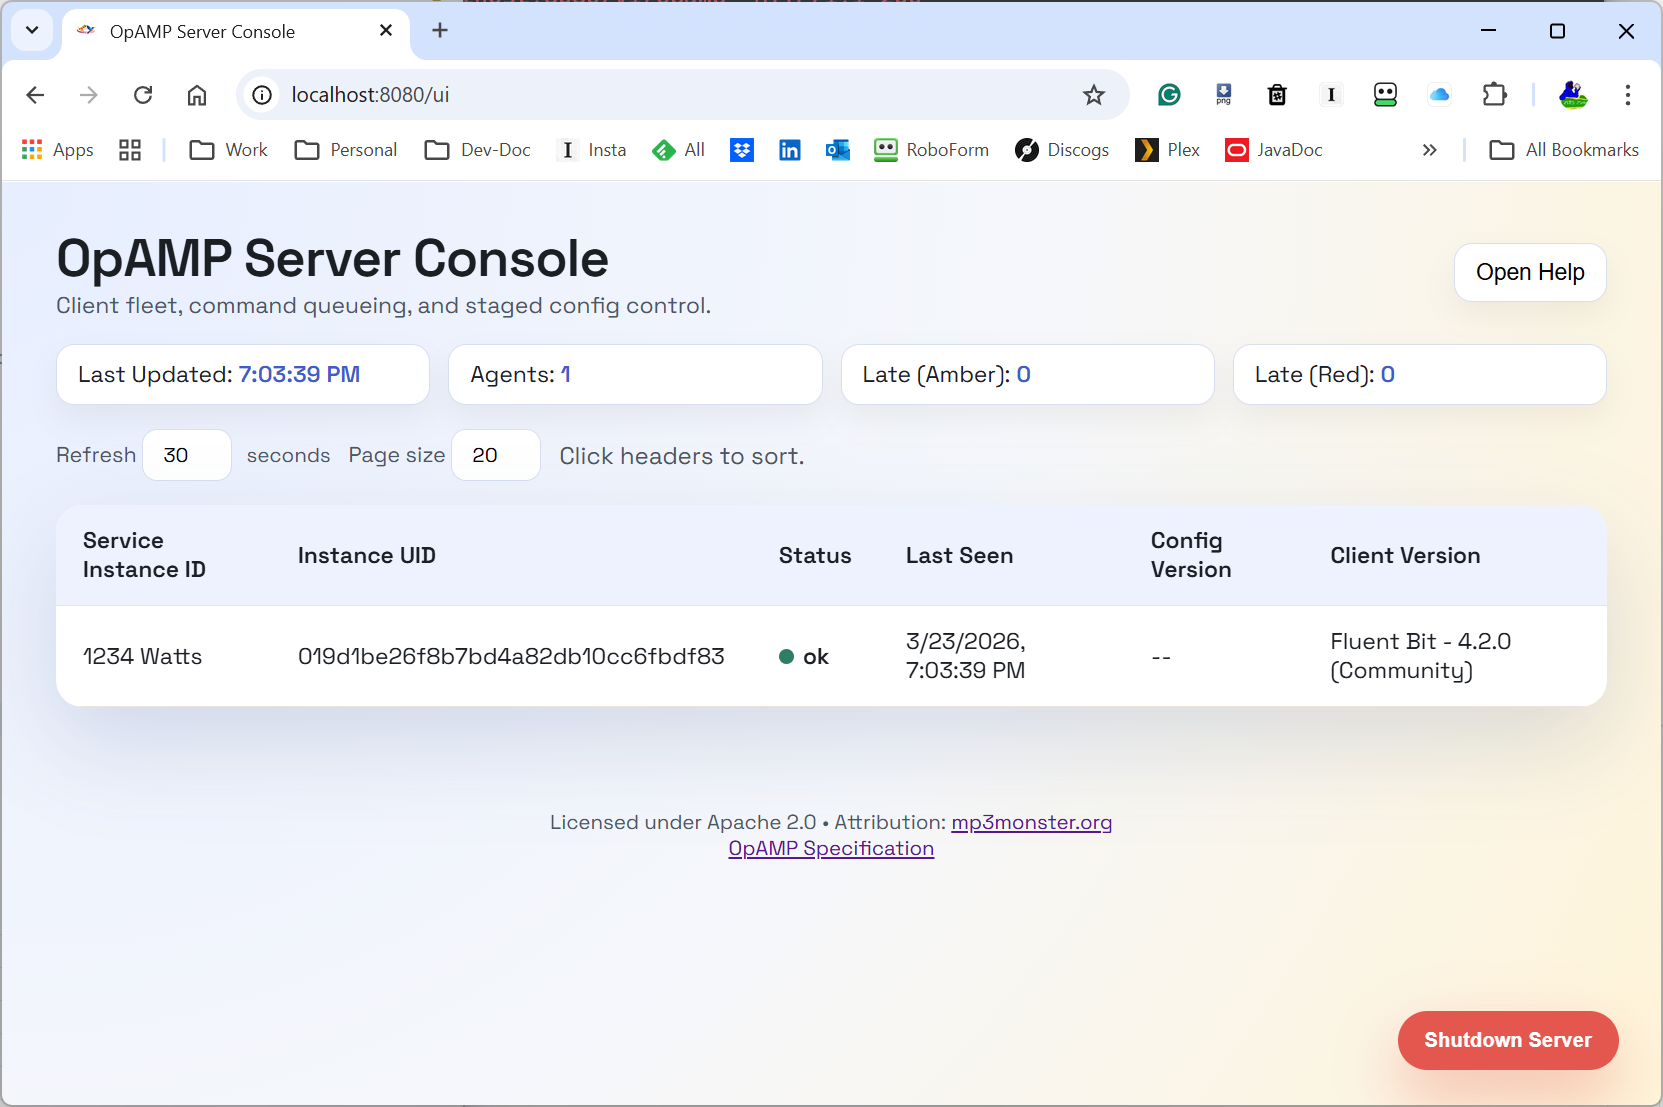
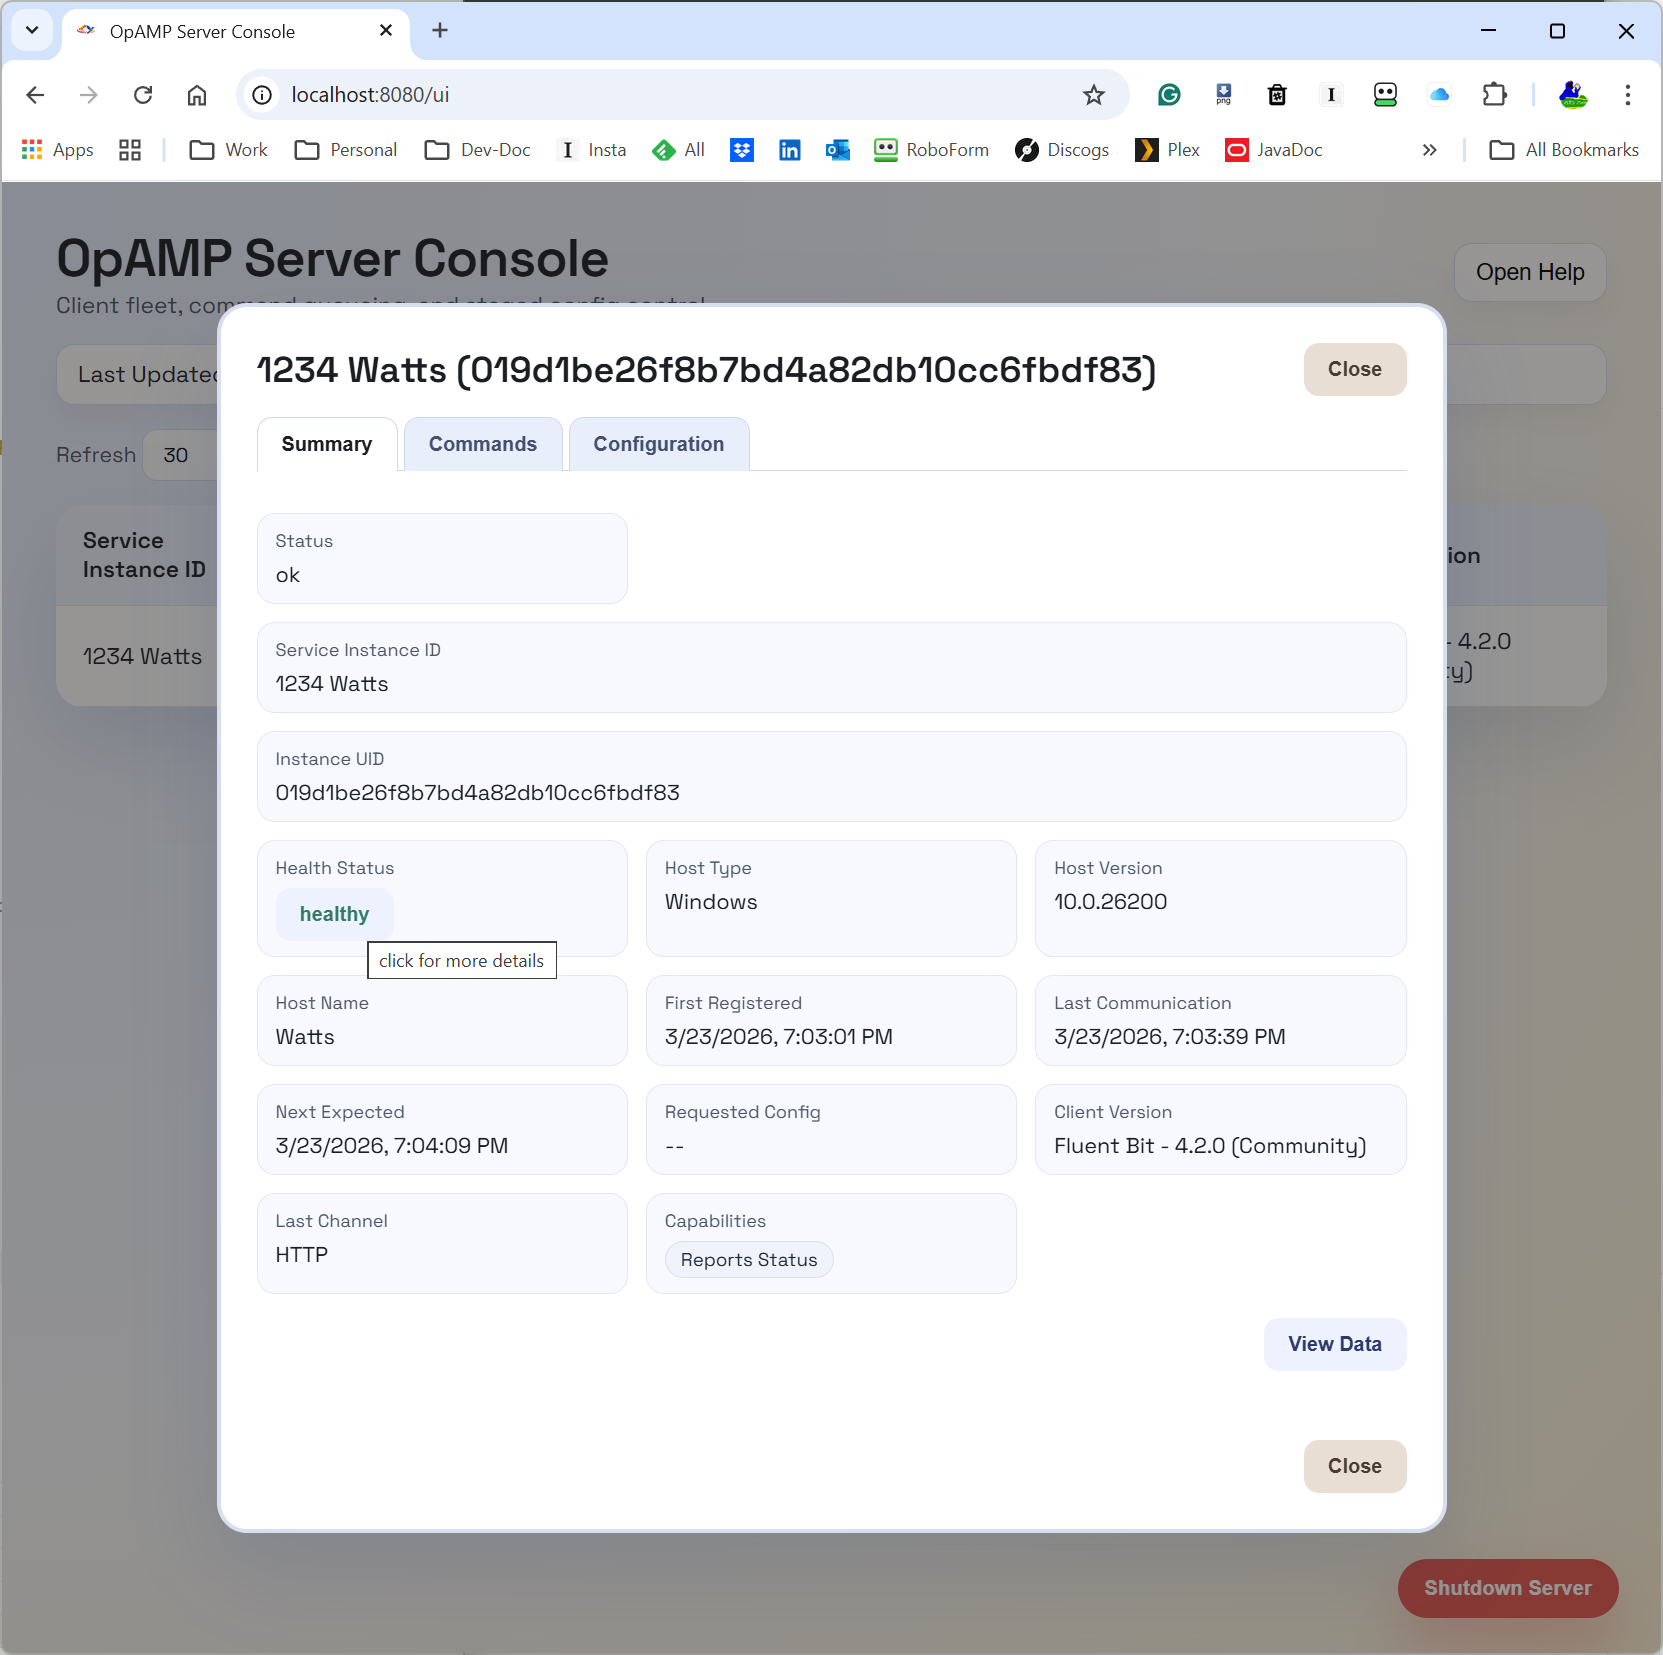
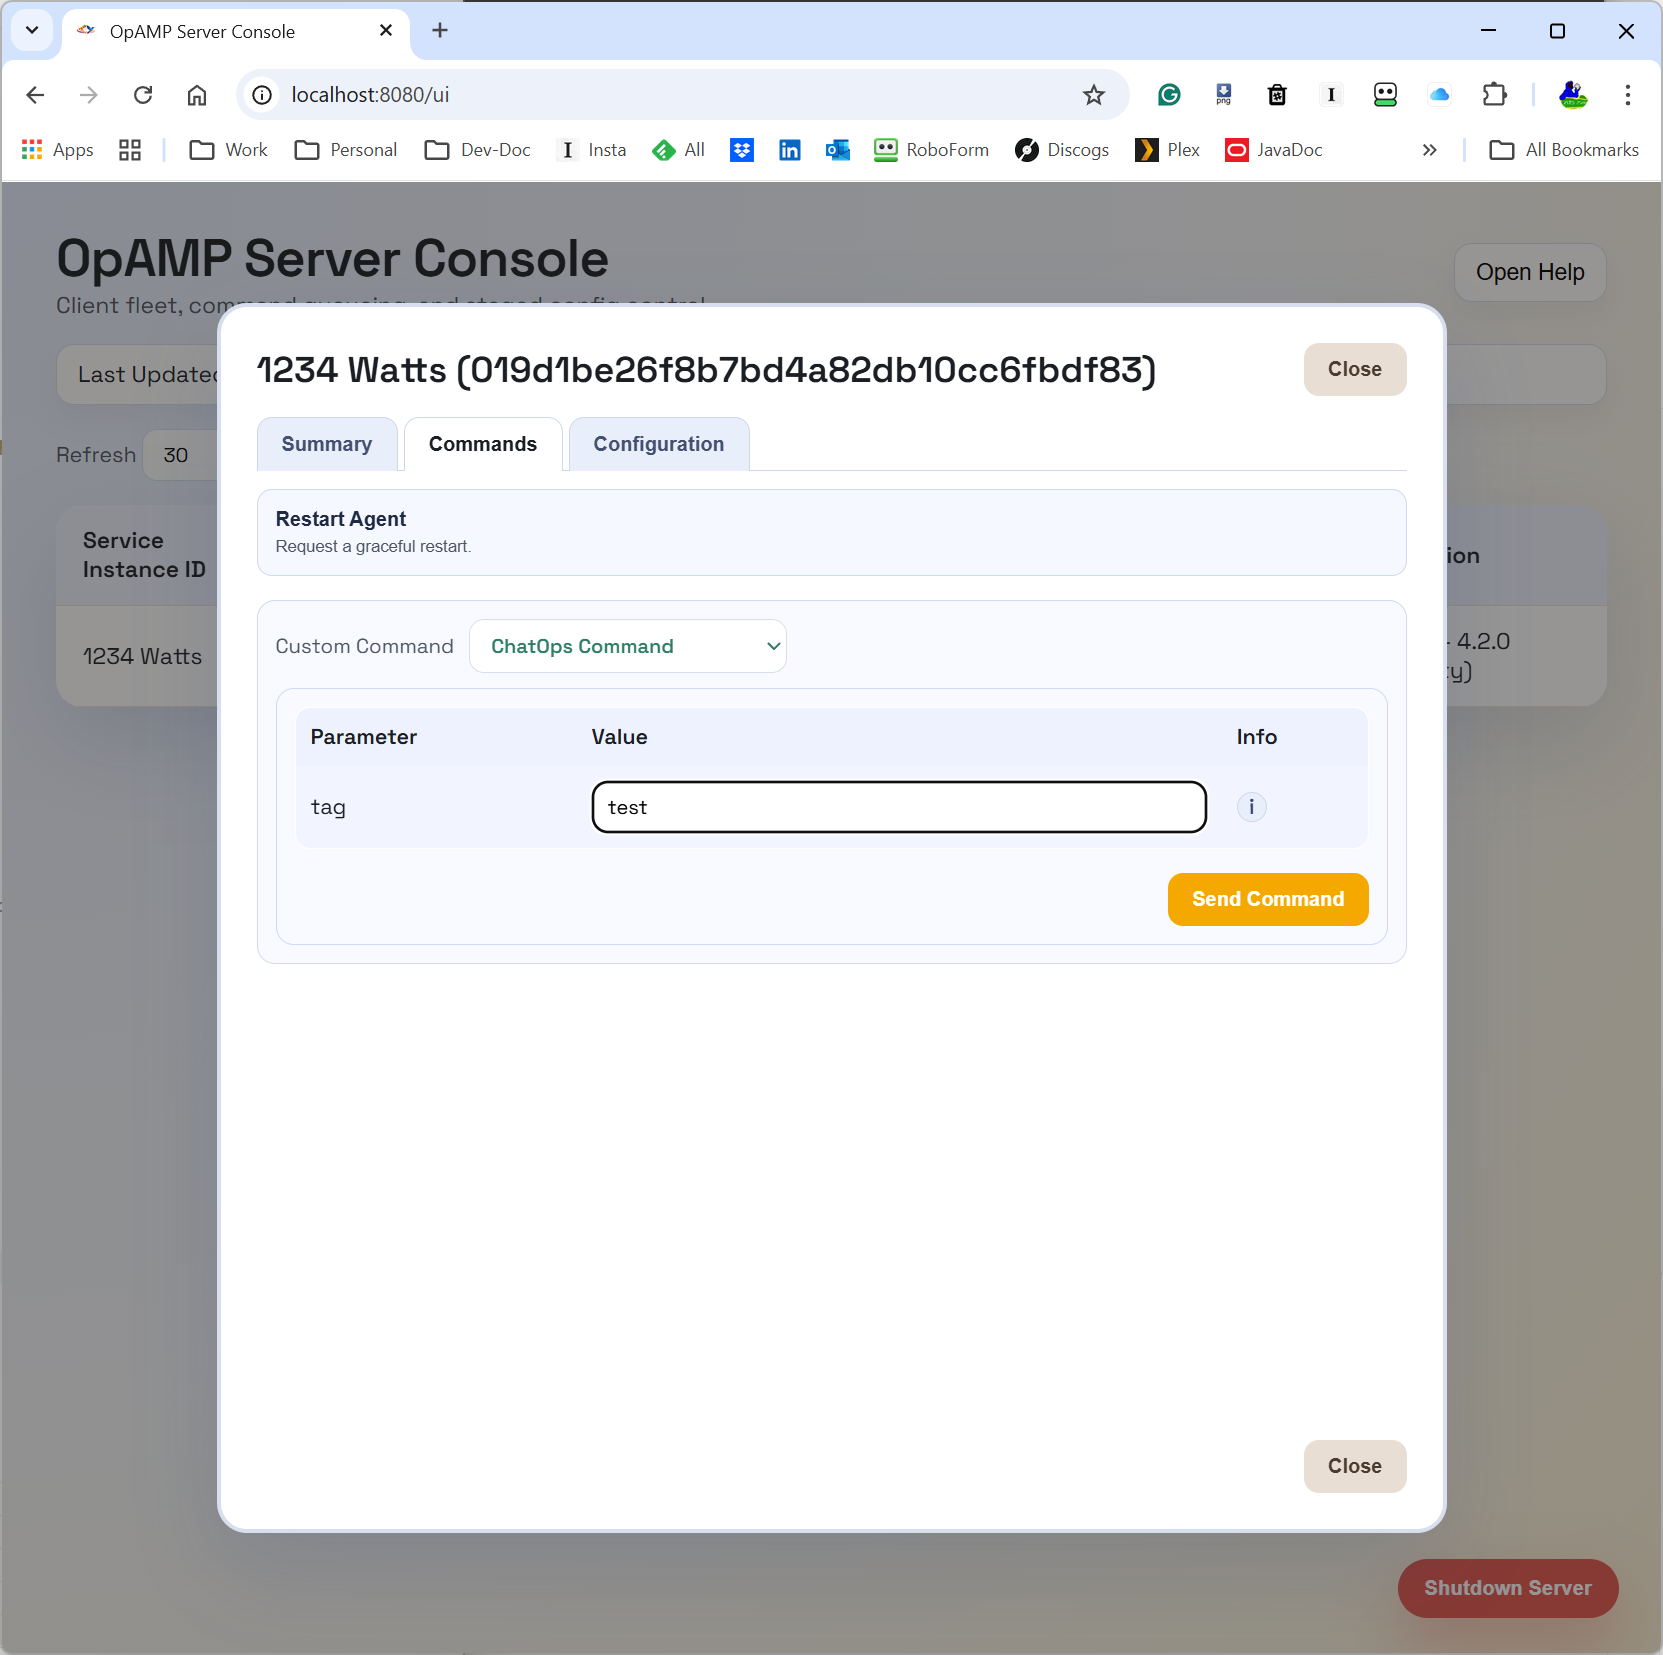
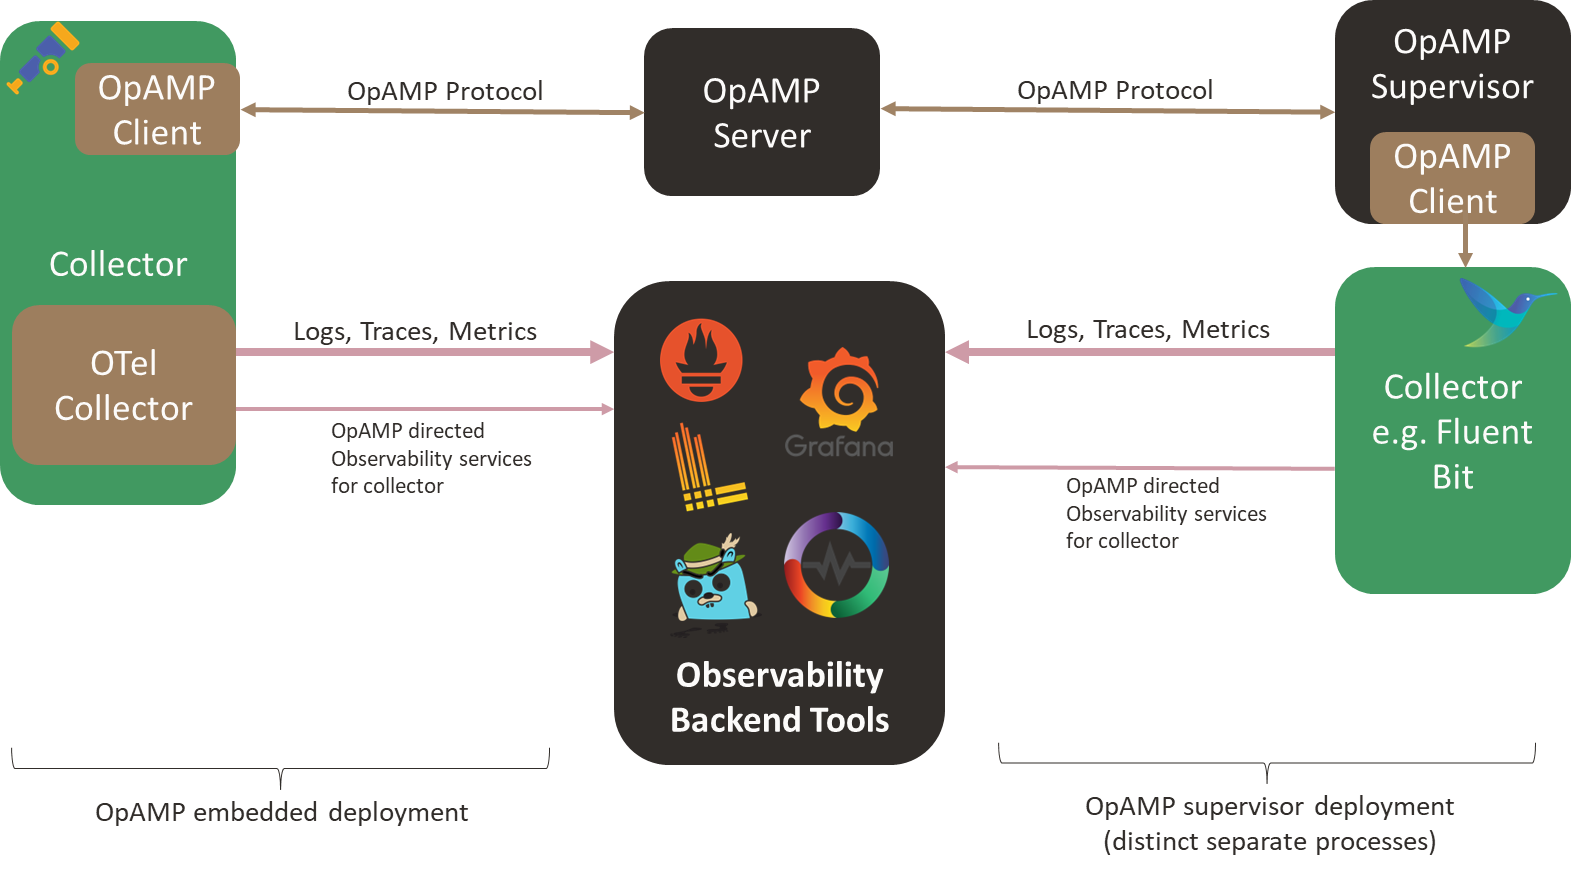
The demo was very light-touch to illustrate an idea, but we’ve since heard people pursuing the concept. So the question becomes: what has happened in the observability space that could make it easier to industrialize (e.g., scale, resilience, security, manageability)? One of the key advances being driven by the OpenTelemetry working groups within the CNCF is OpAMP. OpAMP provides a protocol for standardizing the management and control of agents and collectors such as Fluent Bit. I won’t go into the details of OpAMP here, as we covered that in a separate blog (here). But what it means is that we can either tap into the OpAMP protocol more directly as it provides a means to deliver custom commands to agents, or better still simplify by extending the management service so that we can talk to that, and it is responsible to sending on the command to the relevant agents and talk back to us if its knowledge about agent capabilities tells us its not possible.
This improves security (our bot only needs to talk to a single point in our infrastructure). Our agents, like Fluent Bit, can have a trust relationship with a central point. Effectively, we have introduced a better multifaceted trust layer into the answer. Not only that, as the OpAMP server has visibility into more of the agent deployment, we can also leverage its information and ask it to deploy our custom Fluent Bit configurations that help us observe and execute remediation processes.
Let’s look deeper
While industrialization is good, it occurs to me that there is more to collaboration and conversational (or chat) interfaces than we first envisaged.
Collaboration, to a large extent, is not about bringing multiple ideas to the table and choosing the best one; it is actually about knowledge mining. Our ideas and insights are built from individual knowledge banks, or as we might put it, experience. Conversational interfaces also allow us to see what has gone before (in effect, harvesting information to improve our knowledge). So perhaps we should be asking, within the context of a platform that allows us to easily access, share, and interpret knowledge for a specific context (i.e., our current problem), what can we do?
Knowledge is unstructured or semistructured information, and information is a semistructured composition of context and data. So how do we find and leverage information if not knowledge, particularly at 2am when we’re the only person on call? The answer is to facilitate enhanced information retrieval, which could be more Slack bots that we can use to provide structured commands to retrieve relevant data from our metrics tooling, traces, etc. Organizations that follow more ITIL-guided processes will most likely have runbooks, a knowledge base with error-code information, and previous incident logs documenting resolutions. All of which can bring together a wealth of information. Doing this in a collaborative conversational tool like Slack and MS Teams will save time and effort, as you will not have to sign in to different portals to track down the details.
But we can go better, with the rise of LLMs (large language models, Gen AI if you prefer), combined with techniques such as RAG (Retrieval Augmented Generation), MCP (Model Context Protocol), and further accelerate things as we no longer have to make our Slack bot requests use what structured commands. We use natural language, we can easily paste parts of the information we’re given as part of the request – all of which means that while a single LLM may take longer to execute a single request, it is more likely to surface the details faster because we’re not having to worry about getting the notation for the bot request correct, we’re not going to have to repeat requests to narrow data immediately. With agentic techniques, you can have the LLM pull data from multiple systems in a single go.
All of which is very achievable; many vendors (and open-source teams) have been seeking a competitive edge and exposing their APIs through MCP tools. There is the possibility that some of this is ‘AI washing’, but the frameworks to support MCP development are well progressed, so you can always refine or create your own MCP server. Here are just a few examples:
In addition to these, which align with widely used open-source solutions, there are MCP servers for vendor-specific offerings, such as Honeycomb and Chronosphere.
The use of MCP raises an interesting possibility – as it becomes very possible to have a universal MCP client, which can be easily interfaced into any conversational tool – after all, we just need to send the text that is addressed to the client, i.e., the adaptor to Slack, MS Teams, etc. is pretty simple. This means we can start to consider things like the same tooling, supporting tools like Claude Desktop, and its mobile equivalent.
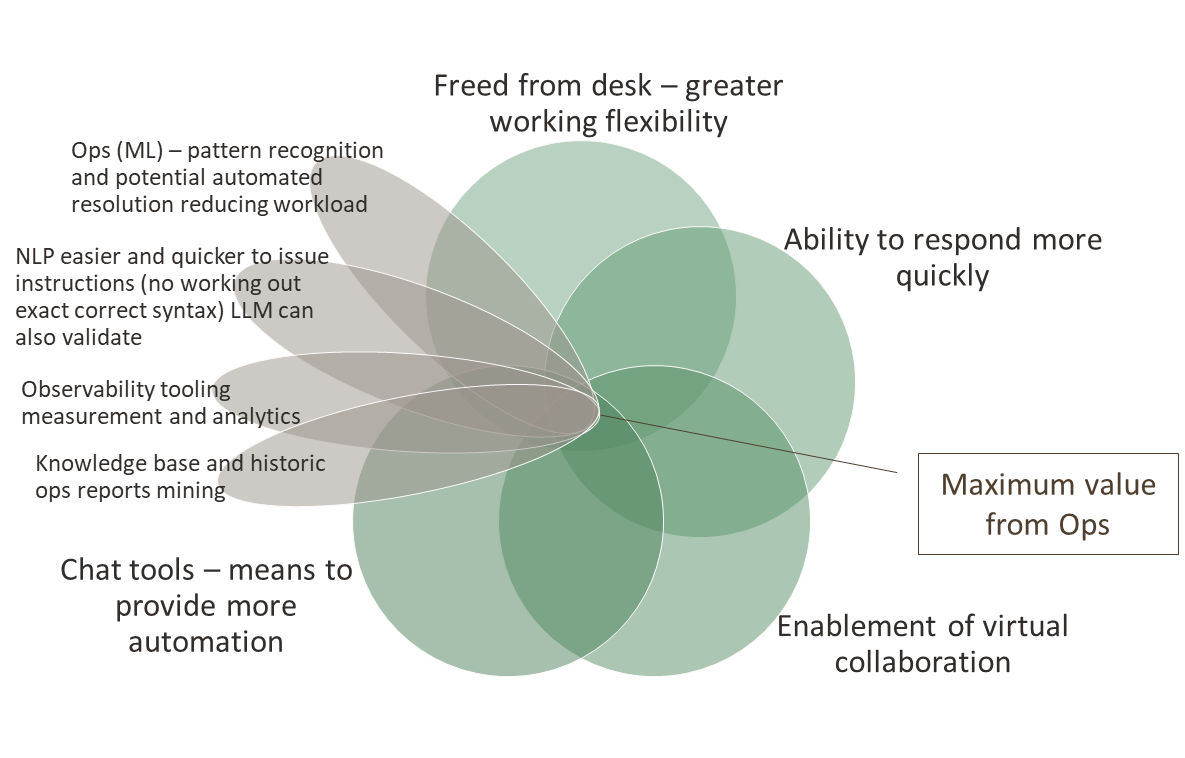
If we bring AI into the equation, consider ML and small models as well, we can start looking at exploiting pattern recognition in the occurrences of issues. This would mean the value diagram becomes more like:
We should also keep in mind the development of the new OpAMP spec from the CNCF OpenTelemetry project that provides a mechanism to centrally track and interact with all our agents, such as Fluent Bit (not to mention Fluentd, OTel Collectors, and others).
Bringing all of this together isn’t a small task, and what of these ideas already exist? Are there building blocks we can lean on to show that the ideas expressed here are achievable? This brought us to IncidentFox.ai (GitHub link – IncidentFox). IncidentFox already exploits MCP servers from several products, such as Grafana, and supports a knowledge base geared towards intelligent searching that can also tap into common sources of operational knowledge, such as Confluence.
But IncidentFox has taken the use of LLMs further with its agentic approach, recommending actions, and once it has access to source code, LLMs can be used to start looking for root causes. To do this, IncidentFox has harnessed the improvements in Gen AI reasoning and the selection and use of the MCP-enabled tools we mentioned, which enable the extraction of data and information from mainstream observability tools.
IncidentFox isn’t the only organization heading in this direction (Resolve.ai, Randoli, and Kloudfuse are building AI SRE tools, but with a fully proprietary business model), but it is supporting an open-source core. All of these solutions come under the banner of AI SRE. Interestingly, a new LLM benchmark has emerged called SRESkillsBench, in addition to the models such as Bird and Spider, which specifically evaluate LLMs against SRE tasks. This kind of information certainly is going to create some interesting debates – do you use the best LLM for specific tasks, or the LLM the vendor has worked with and optimized their prompting to get the best from it?
A lot of these tools focus on detection and diagnostics, and steer you to the relevant runbooks, there seems to be less said about how runbooks can be translated into remediation actions that can be executed. The ability to translate runbooks into executable steps will require either tooling via MCP or custom models with suitable embedded functions. Whichever approach is adopted, having a well-understood control plane, such as Kubernetes, will make it easier. But not everything is native K8s. Lots of organizations still use just virtualization, or even bare metal. We also see this with cloud vendors that offer bare-metal services due to the need for maximum compute horsepower. To address these scenarios from a centralized control, either needs to allow remote access (ssh tunnels) to all the nodes, or a means to work with a distributed tooling mechanism, which is what we had with our original chatops idea and the possibilities offered through OpAMP.
Of course, introducing LLMs opens up another set of challenges in the observability space, which OpenLLMetry (driven by TraceLoop) and LangFuse are working to address. But that’s for another blog.
What does this mean to our ChatOps proof of concept?
Sticking with an open-source/standards-based approach means there is a clear direction of enabling AI Agents to be part of the OTLP (Open Telemetry Protocol) pipeline and leverage the MCP tooling of backend observability platforms. IncidentFox doesn’t yet provide an inline OTLP capability (although some of the proprietary options have gone this way), but that is less of a concern, as Fluent Bit provides a lot of capability to help identify issues (such as timeseries/frequency measurement, error identification, etc.), which can be combined with IncidentFox’ means to instruct it to initiate an incident. We could do this with direct API calls, but what would be more interesting and flexible is that, when our Fluent Bit process notifies the Ops team in Slack of an issue, it also ensures that the IncidentFox Slack agent picks up the message, allowing it to start its own analysis. In effect, a collaboration platform can be as impactful as an integration platform.
Furthermore, now that we have early warning of an issue via Fluent Bit, we can interact with IncidentFox through its tooling to start interrogating the diverse range of tools well before the new problem’s details have been fully ingested into the backend tooling and been detected as an issue. So we can now get a jump start by prompting IncidentFox, which can mine for information and recommendations. This is where, at 2am, we can still work collaboratively, albeit with a collaborator that is not another person but an LLM.
As I’ve mentioned, the challenge is making the runbook executable in environments that don’t provide a strong control plane, such as K8s. Here, we can further develop our ChatOps concept. By providing a set of MCP tools for Fluent Bit (IncidentFox supports providing your own tools), the runbook can describe remediation steps, and the use of the LLM ensures the Fluent Bit tool is invoked appropriately.
This would still mean that the central point of Incident Fox would need to talk with each Fluent Bit deployment, better than just opening up SSH directly. But we could be smarter. OpAMP provides a central coordination point, and through its Supervisor or embedded logic in an observability client, the protocol’s support for custom commands could be exploited. So we expose the way we interact with Fluent Bit via the custom command mechanism, and we have a robust, controlled mechanism. Furthermore, the concept could be extended to exploit the aggregated knowledge of agents and their configuration (or pushing out new configurations to solve operational problems as OpAMP has been designed to enable), we can automate the determination of whether the remediation action needs to be executed across operational nodes.
Let’s walk through a hypothetical (but plausible) scenario. We have manually deployed systems across a load-balanced set of servers in a pre-production environment used for load testing, each with TLS certificates. As it is a pre-production environment, we use self-signed certificates. We are starting to see errors because the certificates have expired, and someone forgot to recycle them. Fluent Bit has been forwarding the various error log messages to Loki, but the high frequency of the errors causes it to send details to Slack for the Ops team. This, in turn, nudges IncidentFox to act, determines the root issue, and finds remediation in a runbook that points to running a script on the host to provide a fresh self-signed certificate. As we have a Fluent Bit ops pipeline that can trigger that script, and it is deemed low risk, we allow IncidentFox to execute the runbook unsupervised. To execute the run book, it uses the OpAMP server to send the custom command to Fluent Bit. But the runbook says other nodes should be checked. As a result, IncidentFox works with the OpAMP server via its MCP tooling to identify which other Fluent Bit deployments are monitoring other nodes and to direct the custom command to those nodes as well.
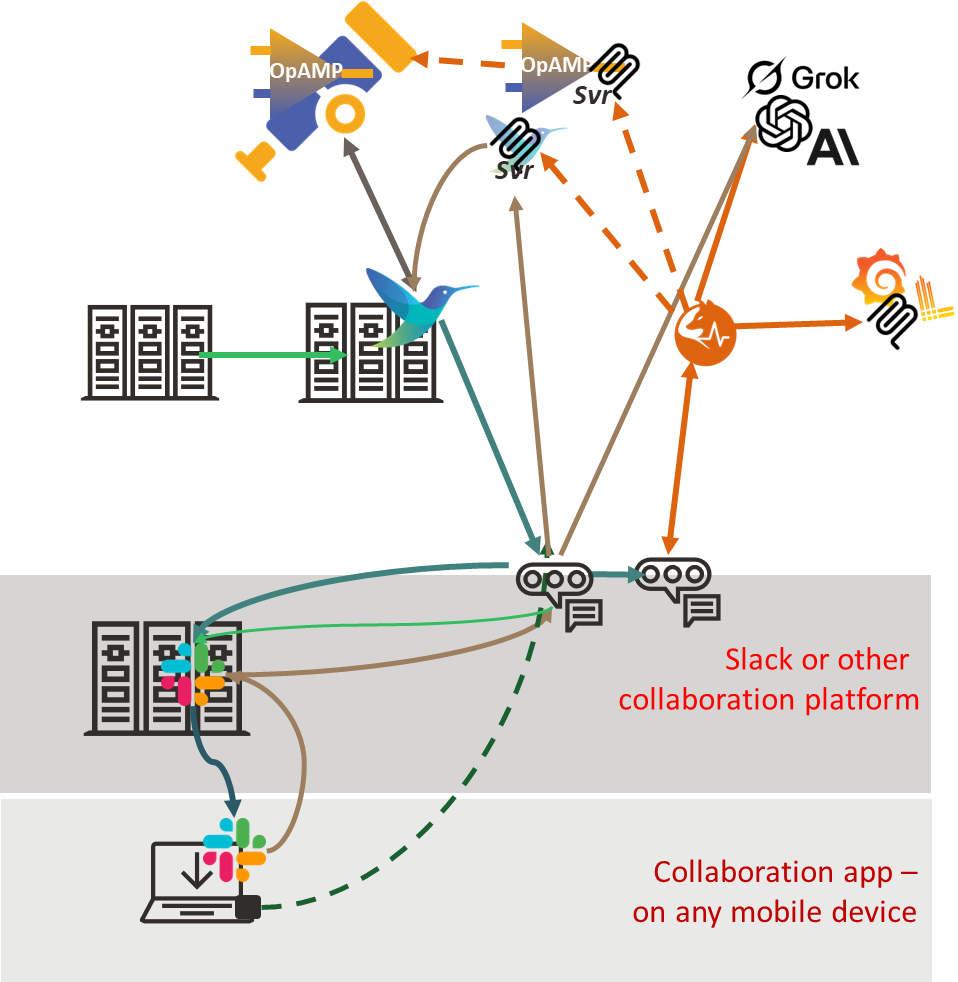
To achieve this, we need an architecture along the following lines, in addition to IncidentFox and the associated MCP tools, we would need to have the OpAMP server, either the OpAMP client embeddable into Fluent Bit or an OpAMP supervisor that understands how to pass custom commands, something it perhaps could do by using another MCP interface to Fluent Bit directly.
Conclusion
As you can see, there has been significant advancement in how LLMs and MCP tooling can be used to enable operational support activities. To turn this into a reality, the core Fluent Bit committers need to ideally press on with supporting OpAMP. A standardized MCP tooling arrangement for an open-source OpAMP server will also make a significant advancement. Although we could get things working directly with MCP using Fluent Bit.
IncidentFox being able to function as an OpAMP server itself would really enable it shift the narrative, particularly if it provided a means to plug into a supervisor to handle custom actions.
Root cause analysis – understanding deployment changes
Looking at all of this, one dimension of operational issues is the ability to correlate an issue with environmental changes. That means understanding not only software versions, but also the live configuration. Again, not too difficult when your control plane is K8s. But trickier outside of that ecosystem. You need to identify when the change was defined and when it was applied. Is it time for some functionality that understands when details such as file stamps for configurations or certain binary files change? Perhaps a proxy service that can spot API calls to configuration endpoints and file system changes to configuration files? Then have that information logged centrally so that problems can be correlated to a system configuration or deployment problem.
Updates
Since writing this, we came across Mezmo, which, like Resolve.ai, is developing a proprietary solution but is looking to make an open-source offering. As part of that journey, they have sponsored an O’Reilly Report on Context Engineering for Observability.
Fluent Bit and OpenTelemetry’s Collector (as well as many other observability tools) are designed to use a distributed/agent model for deployment. This model can pose challenges, including ensuring that all agents are operating healthily and correctly configured. This is particularly true outside of a Kubernetes ecosystem. But even within a Kubernetes ecosystem, more than basic insights are required (for example, is it running flat out or over-resourced). Fluent Bit exposes its own metrics and logs so that you can either configure Fluent Bit to forward the metrics and logs to an endpoint (or allow Prometheus to scrape the metrics).
As we’re usually using Fluent Bit to collect data and route it to tools like Prometheus, Grafana, etc., or perhaps a more commercial product. So it makes sense that Fluent Bit is also sharing its own status and health.
When it comes managing the configuration of Fluent Bit, we have lots of options for Kubernetes deployments (from forcing pod replacement, to sharing configurations via persistent volume claims, and Fluent Bit reloading configs), but given that Observability needs to operate on simple virtualized and bare metal scenarios, and not everything can be treated as dynamically replaceable more general strategies such as GITOps and potentially using Istio (yes, there really good use cases for Istio outside of Kubernetes) are available. But there is also more advanced tooling, such as Puppet, Chef, and Ansible.
The challenge is non of these tools provides out-of-the-box capabilities to fully exploit the control surface that OTel Collectors and Fluent Bit offer. So the OpenTelemetry community has elected to develop a new standard called OpAMP, which fits snuggly into the OTel ecosystem.
OpAMP defines an agent/client and server model in which the central server provides control, measurement, etc., to all Collectors. The agent/client side can be deployed in two ways: wired directly into a collector or via a separate supervisor tool. Integrating the client-side directly into the client is great, as it avoids introducing a new local process. The heart of OpAMP is the message exchange, which we’ll look at more in a moment.
Today, Fluent Bit would need to use the Supervisor model without modification (although GitHub shows a feature request to support the protocol, we haven’t heard whether or when it will be implemented). But it is early days, and some aspects of the protocol are still classified as ‘development’. That said, it is worth looking more closely at OpAMP as it offers some interesting opportunities, particularly around how we could easily evolve ideas such as chatOps.
While I’m not a fan of having a peer process for Fluent Bit, on the basis that we now have two distinct processes to support observability, we could experiment with the supervisor spawning Fluent Bit as a child process, which would let the supervisor easily spot Fluent Bit failing. At the sametime the supervisor can communicate with Fluent Bit using the localhost loopback adapter and the usual APIs.
Understanding the OpAMP Protocol and what it offers
Lets start with what the OpAMP protocol offers, firstly very little of it is mandatory (this is both good and bad – it means we can build compatibility in a more incremental manner, if certain behaviours are provided elsewhere, then the agent doesn’t have to offer a capability it is also tolerant of what an agent or collector can and can’t do):
Heatbeat and announce the agent’s existence to the server, along with what the agent is capable of/allowed to do regarding OpAMP features.
Status information, including:
environmental information
configuration being run
modules being used
Perform updates to resources, including:
Agent configuration
TLS certificate rotation
Credentials management
module or even an entire agent installation
issuing of custom commands.
directing the agent’s own telemetry to specific services/endpoints.
The heart of this protocol is the contract between the client (agent/collector) and the server, defined using Protobuf3. This means you can easily create the code skeleton to handle the payload objects, which will be transmitted in binary form (giving network traffic efficiency and the price of not being humanly readable or dynamically processable, insofar as you need to know the Protobuf definition to extract any meaning).
In addition to the Protobuf definitions, there are rules for handling messages, specifying when a message or response is required, message sequence numbering, and the default heartbeat frequency. But there aren’t any complex exchanges involved.
The binary payloads are exchanged over Sockets (allowing full-duplex exchanges where the server can send requests at any time) or over HTTP (providing half-duplex, aka polling/client check-in, at which point the server can respond with an instruction) – a strategy that is becoming increasingly common today.
The benefits we see
Regardless of whether you’re in a Kubernetes environment, the ability to ask agents/collectors to quickly tweak their configuration is attractive. If you start suspecting a service or application is not behaving as expected, if Fluent Bit is filtering your logs or sampling traces, you can quickly push a config change out to allow more through, providing further insight into what is going on – you don’t need to wait for a Kubernetes scheduler to roll through with replacing pods.
With the rise of AI, having a central point of contact makes it easier to wrap a central server as an MCP tool and have a natural language command interface. Along with the possibility that you can potentially send custom commands to the agent (or supervisor) to initiate a task. This was part of the functionality we effectively implemented in our original chatops showcase. The problem was that in the original solution, we deployed a small Slack bot that directed HTTP calls to Fluent Bit. With the OpAMP framework, we can direct the request to the server, which will route the command to the correct Fluent Bit node through a more trustworthy channel.
Implementation
The OpAMP protocol is likely to be widely adopted by commercial service providers (Bindplane,OneUpTime, for example), as it allows them to start working with additional agents/collectors that are already deployed (for example, a supervisor could be used to manage a Fluentd fleet, where there isnt the appetite to refactor all the configuration to Fluent Bit or an OTel Collector). Furthermore, it has the potential to simplify by standardizing functionality.
In terms of resource richness in the OpenTelemetry GitHub repo, I suspect (and hope) there will be more to come (a UI and richer details on how a base server can be extended, for example). At the time of writing, within the OpenTelemetry GitHub repository, we can see:
Go implementation of the protocol: the server accepts and responds to messages, and the client includes some test functionality to populate messages.
A supervisor implementation that, through configuration, can be pointed at an agent to observe, and the configuration so that the supervisor is uniquely identifiable to the server. This is also implemented in Go.
Many of the most potent features being added to Fluent Bit are only available in the newer YAML format. At the same time Fluent Bit is celebrating its 10th anniversary, so we can be sure that are some established deployments that are being maintained with the classic format.
The transition between the two Fluent Bit formats can be a bit fiddly. We built a tool as described in my Fluent Bit config from classic to YAML post using Java over a year ago. While it addressed many of the needs, I wasn’t entirely happy with the solution, for several reasons:
Written in Java, which, as a language, is the one I’m most at home with, as an implementation, it does increase the workload for using and implementing – needing a container, etc., ideally. Not unreasonable, but as a small tool project, we’re not working with a nice enterprise build pipeline, so from a code tweak to test is just fiddlier. I’m sure any Java devs reading this will be shouting, ” Setting up Maven, Jenkins, JUnit isn’t difficult – and they’re right, but it’s a time-consuming distraction from working on the real problem.
While it works, the code didn’t feel as clean as it could or should.
Over the last couple of years, we’ve become more comfortable with Python, and messing around with LLMs and code generation has helped accelerate our development skills. Python offers a potentially better solution: many environments that use Fluentd or Fluent Bit are Linux-based and include Python by default, so you can use the tool without messing with containers if you don’t want to. For a tool intended to support development and maintenance of configurations rather than in production being able to use or modify/extend the code easily is attractive.
We’ve started afresh and built a new implementation that is more extensible and maintainable. The new Python implementation is under the same Apache 2 license, but in a different repo so that existing use and forks of the Java implementation aren’t disrupted.
We can wrap Python with all the production-class build processes, but it’s not necessary to get a tool up and running or to enable people to tinker as needed. So we have focused on that. Over time, we’ll play with Poetry or other packaging mechanisms to make it even easier.
Fluent Bit’s processors were introduced in version 3. But we have seen the capability continue to advance, with the introduction of the ability to conditionally execute processors. Until the ability to define conditionality directly with the processor, the control has had to be fudged around (putting processors further downstream and controlling it with filters and routing, etc).
In the Logs and Telemetry book, we go through the basic Processor capabilities and constraints, such as:
Configuration file constraints
Performance differences compared to using filter plugins
So we’re not going to revisit those points here.
We can chain processors to run in a sequence by directly defining the processors in the order in which they need to be executed. You can see the chaining in the example below.
Scenario
In the following configuration, we have created several input plugins using both the Dummy plugin and the HTTP plugin. Using the HTTP plugin makes it easy for us to control execution speed and change test data values, which helps us see different filter behaviours. To make life easy we’ve provided several payloads, and a simple caller.[bat|sh] script which takes a single parameter [1, 2, 3, …] which identifies the payload file to send.
All of these resources are available in the Book’s GitHub repository as part of the extras folder, which can be found here. This saves us from embedding everything into this blog.
Filters as Processors and Chaining
Filters can be used as processors as well as the dedicated processor types such as SQL asnd content modifier. The Filters just need to be referenced using the name attribute e.g. name: regex would use the REGEX filter.
Processor Conditions
If you’re familiar with Kubernetes selectors syntax, then the definition conditions for a processor will feel familiar. The condition is made up of a condition (#–A–) and the condition will contain one or more rules (#–B–). The rule defines an expression which will yield a Boolean outcome by identifying:
An element of the payload (for example, a field/element in the log structure, or a metric, etc).
The value to evaluate the field against
The evaluation operator, which can be one of the typical operators e.g eq (equals), (see below for the full list).
Since the rules are a list, you can include as many as needed. The condition, in addition to the rule , has its own operator (#–C–), which tells the condition how to combine the results of each of the rules together. As we need a Boolean value, we can only use a logical and or a logical or. When we have a single rule then the operation is tested with itself.
In the following example, we have two inputs with processors to help demonstrate the different behavior. In the dummy source, we can see how a nested element can be accessed (i.e. $<element name>[‘<child element name>‘]), performing a string comparison. Here we’re using a normal filter plugin as a processor.
With our HTTP source, we’re demonstrating that we can have two processors with their own conditions. The first processor is interesting, as it illustrates an exception to the convention; we can express conditionality within the Lua code (#–D–), but it ignores the condition construct. It is obviously debatable as to the value of a condition for the Lua processor, but it is worth considering, as there is an overhead when calling the LuaJIT if the condition can be quickly resolved internally.
To run the demonstration, we’ve provided several test payloads and a simple script that will call the Fluent Bit HTTP input plugin with the correct file. We just need to pass the number associated with the log file e.g. <Log>1<.json> is caller.[bat|sh] 1, and so on. The script is a variation of:
set fn=log%1%.json
echo %fn
curl -X POST --location 127.0.0.1:9881 --header Content-Type:application/json --data @%fn%
With KubeCon North America just wrapped up, the team behind Fluent Bit has announced a new major release -version 4.2. According to the release notes, there are some interesting new features for routing strategies in Fluent Bit. We also have a Dead Letter Queue (DLQ) mechanism to handle some operational edge scenarios. As with all releases, there are continued improvements in the form of optimizations and feature additions to exploit the capabilities of the connected technology. The final aspect is ensuring that any dependencies are up to date to exploit any improvements and ensure that there are no unnecessary vulnerabilities.
At the time of writing, the Fluent Bit document website is currently only showing 4.1, but I think at least some of the 4.2 details have been included. So we’re working out what exactly is or isn’t part of 4.2.
Dead Letter Queue
Ideally, we should never need to use the DLQ feature as it is very much focused on ensuring that in the event of errors processing the chunks of events in the buffer, the chunks are not lost, so the logs, metrics, and traces can be recovered. The sort of scenarios that could trigger the use of the DLQ are, for example:
The buffer is being held in storage, and the storage is corrupted for some reason (from a mount failure, to failing to write a full chunk because storage has been exhausted).
A (custom) plugin has a memory pointer error that corrupts chunks in the buffer. I mention customer plugins, anecdotally, they will not have been exercised as much as the standard plugins; therefore, a higher probability of an unexpected scenario occurring.
The control of the DLQ is achieved through the configuration of several service configuration attributes …
storage.keep.rejected – this enables the DLQ behavior and needs to be set to On (by default, it is Off).
storage.path – is used to define where the storage of streams and chunks is handled. This is not specific to the DLQ. But by default a DLQ is created as a folder called rejected as a child of this location.
storage.rejected.path allows us to define an alternate subfolder for the DLQ to use based on storage.path.
Trying to induce behavior that needs this feature to trigger is not going to be trivial, for example if we dynamically set a tag, and there is no corresponding match this won’t get trapped in the DLQ. Although arguably this is just as good a scenario for using the DLQ (if you receive events with tags that you don’t wish to retain, it would be best to be matched to a null output plugin, so it is obvious from the configuration that dropping events is a deliberate action).
Other 4.2 (and 4.x) features
As we work out exactly what and how the new features work we’ll add additional posts. For example, we have a well-developed post to illustrate 4.x features for conditional control of processors (with demo configurations etc).
Kube Con Content
While there isn’t a huge amount of technical content from sessions at Kube Con available yet, particularly in the Telemetry and Fluent space, one blog article resulting from the conference did catch my eye: New Stack covering OpenAI’s use of Fluent Bit. The figures involved are staggering, such as the 10 petabytes of logs being handled daily.
18th Nov Update
More content showing up – will update the list below as we encounter more:
With vibe coding (an expression now part of the Collins Dictionary) and tools like Cline, which are penetrating the development process, I thought it would be worthwhile to see how much can be done with an LLM for building configurations. Since our preference for a free LLM has been with Grok (xAI) for development tasks, we’ve used that. We found that beyond the simplest of tasks, we needed to use the Expert level to get reliable results.
This hasn’t been a scientific study, as you might find in natural language-to-SQL research, such as the Bird, Archer, and Spider benchmarks. But I have explained below what I’ve tried and the results. Given that LLMs are non-deterministic, we tried the same question from different browser sessions to see how consistent the results were.
Ask the LLM to list all the plugins it knows about
To start simply, it is worth seeing how many plugins the LLM might recognize. To evaluate this, we asked the LLM to answer the question:
list ALL fluent bit input plugins and a total count
Grok did a pretty good job of saying it counted around 40. But the results did show some variation: on one occasion, it identified some plugins as special cases, noting the influence of compilation flags; on another attempt, no references were made to this. In the first attempts, it missed the less commonly discussed plugins such as eBPF. Grok has the option to ask it to ‘Think Harder’ (which switches to Exper mode) when we applied this, it managed to get the correct count, but in another session, it also dramatically missed the mark, reporting only 28 plugins.
Ask the LLM about all the attributes for a Plugin
To see if the LLM could identify all the attributes of a plugin, we used the prompt:
list all the known configuration attributes for the Fluent Bit Tail plugin
Again, here we saw some variability, with the different sessions providing between 30 and 38 attributes (again better results when in Expert mode). In all cases, the main attributes have been identified, but what is interesting is that there were variations in how they have been presented, some in all lowercase, others with leading capitalization.
Ask the LLM to create a regular expression
Regular expressions are a key way of teasing out values that may appear in semi-structured or unstructured logs. To determine if the LLM could do this, we used the following prompt:
Create a regular expression that Fluent Bit could execute that will determine if the word fox appears in a single sentence, such as 'the quick brown fox jumped over the fence'
The result provided offered variations on the expression \bfox\b (sometimes allowing for the possibility that Fox might be capitalized). In each of the cases where we went back to the LLM and added to the prompt that Note that the expression should be case sensitive – It was consistently correct.
The obvious takeaway here is that to avoid any errors, we do need to be very explicit.
Ask the LLM to create a simple filter and output
Given that we can see the LLM understands the most commonly used Fluent Bit plugins, let’s provide a simple scenario with a source log that will have some rotation, and see how it processes it. The prompt provided is:
create a classic configuration for fluent bit that will read an input from a file called myApp which has a post fix with the date. The input needs to take into account that the file extension will change at midnight. Any log entries that show an error and reference an IP need to be filtered to go to a CSV file with columns in the order tag, IP, log, timestamp
The handling of this question differed significantly across sessions: one response implemented filtering and output structuring via a Lua function, while another maximized the use of multiple filters. None of the solutions recognized that the output could reference standard Fluent Bit attributes for the tag and timestamp.
What was interesting was that the LLM also picked up on the possibility of externalizing the parser expressions, such as finding the IP. Interestingly, Fluent Bit includes a predefined set of filters, including an IPv4 filter.
Ask the LLM to use a stream processor
Stream Processors are a less commonly used feature of Fluent Bit, so it would be interesting to see how well the LLM can handle such use cases.
create a Fluent Bit YAML configuration which takes an NGINX log file input and uses a SQL stream processor to count the number of calls identified and the average time between these calls as coming from IP addresses starting 10. every minute. The NGINX logs need to be forwarded to a fluent bit node on the server named ops.myCorp.com and the output of the stream processing needs to go to a local log file called counter.txt and written to a Prometheus end point called ops_prometheus.myCorp.com
The result of this prompt comes in two parts. A main configuration:
The configuration for the second node provided is:
service:
log_level: info
pipeline:
inputs:
- name: tail
path: /path/to/nginx/access.log # Adjust to your NGINX access log path
tag: nginx
db: /var/log/fluent-bit-tail.db # For position tracking
outputs:
- name: forward
match: nginx
host: ops.myCorp.com
port: 24224
As you can see, while the configuration is well-formed, the LLM has confused the input and output requirements. This is because we have not been explicit enough about the input. The thing to note is that if we tweak the prompt to be more explicit and resubmit it, we get the same mistake, but submitting the same revised prompt produces the correct source. We can only assume that this is down to the conversational memory yielding a result that takes precedence over anything older. For transparency, here is the revised prompt with the change underlined.
create a Fluent Bit YAML configuration which takes an NGINX log file as an input. The NGINX input uses a SQL stream processor to count the number of calls identified and the average time between these calls as coming from IP addresses starting 10. every minute. The input NGINX logs need to be output by forwarding them to a fluent bit node on the server named ops.myCorp.com and the output of the stream processing needs to go to a local log file called counter.txt and written to a Prometheus end point called ops_prometheus.myCorp.com
The other point of note in the generated configuration provided is that there doesn’t appear to be a step that matches the nginx tag, but results in events with the tag ip10.stats. This is a far more subtle problem to spot.
What proved interesting is that, with a simpler calculation for the stream, the LLM in an initial session ignored the directive to use the stream processor and instead used the logs_to_metrics filter, which is a simpler, more maintainable approach.
Creating Visualizations of Configurations
One of the nice things about using an LLM is that, given a configuration, it can create a visual representation (directly) or in formats such as Graphviz, Mermaid, or D2. This makes it easier to follow diagrams immediately. Here is an example based on a corrected Fluent Bit configuration:
The above diagram was created by the LLM as a mermaid file as follows
graph TD
A[NGINX Log File
/var/log/nginx/access.log] -->|"Tail Input & Parse (NGINX regex)"| B[Fluent Bit Pipeline
Tag: nginx.logs]
B -->|Forward Output| C[Remote Fluent Bit Node
ops.myCorp.com:24224]
B -->|"SQL Stream Processor
Filter IPs starting '10.'
Aggregate every 60s: count & avg_time"| D[Aggregated Results
Tag: agg.results]
D -->|"File Output
Append template lines"| E[Local File
/var/log/counter.txt]
D -->|"Prometheus Remote Write Output
With custom label"| F[Prometheus Endpoint
ops_prometheus.myCorp.com:443]
Lua and other advanced operations
When it comes to other advanced features, the LLM appears to handle this well, but given that there is plenty of content available on the use of Lua, the LLM could have been trained on. The only possible source of error would be the passing of attributes in and out of the Lua script, which it handled correctly.
We experimented with handling open telemetry traces, which were handled without any apparent issues. Although advanced options like compression control weren’t included (and neither were they requested).
We didn’t see any hallucinations when it came to plugin attributes. When we tried to ‘bait’ the LLM into hallucinating an attribute by asking it to use an attribute that doesn’t exist, it responded by adding the attribute along with a configuration comment that the value was not a valid Fluent Bit attribute.
General observations
One thing that struck me about this is that describing what is wanted with sufficient detail for the LLM requires a higher level of focus (albeit for a shorter period) than manually creating the configuration. The upside is that we are, in effect, generating part of a detailed design document. Today, I’d go so far as to suggest including the prompt(s) used in the configuration header(s) to help people understand what is needed from the configuration.
When the LLM generates the configuration, there will be no escaping the need to understand what the plugins do and the options they offer to determine whether the LLM has got it right. If the LLM gets it wrong, we would recommend starting a fresh session.
This does raise a bit of an interesting challenge. If you need to have a fair handle on how Fluent Bit works and common ways plugins work, then actually writing your own configuration files may be better anyway, as that approach will provide more reinforcement to learning. We, of course, can use the LLM to help ‘peer review’ our configurations in the sense of checking syntax, and generating visual representations can help confirm the configuration is as we expect.
This may be a personal thing, as I find myself working with Fluent Bit in small bursts rather than continually. As a result, I remember what I can do with a plugin, but I often forget the exact names of the less commonly used attributes to effect the desired behavior. Looking up, and keying in the attribute names can take time. One thing that we have tried was to include in the prompt statements, such as:
In the configuration include all the attributes even if they are only populated with their default or example values. Add a comment for each attribute to show its surpose and whether it is mandatory or not.
What you get then is all the possible options, with the correct names (something that is easy for the LLM, as it is essentially asking it to reformat the documentation for you). Then it becomes a case of removing the attributes that aren’t needed line by line—a lot quicker and easier than manually adding them.
LLM generated plugin with all attributes described (slightly modified output to make the point clearer).
[INPUT]
Name tail
# Purpose: Specifies the input plugin to use. Mandatory: yes
buffer_chunk_size 32k
# Purpose: Set the initial buffer size to read file data. The value must be according to the Unit Size specification. Mandatory: no
buffer_max_size 32k
# Purpose: Set the limit of the buffer size per monitored file. If reading a file exceeds this limit, the file is removed from the monitored file list. The value must be according to the Unit Size specification. Mandatory: no
path /var/log/blah.txt
# Purpose: Pattern specifying a specific log file or multiple ones through the use of common wildcards. Allows multiple patterns separated by commas. Mandatory: yes
path_key filename
# Purpose: If enabled, it appends the name of the monitored file as part of the record. The value assigned becomes the key in the map. Mandatory: no
exclude_path *.gz,*.zip
# Purpose: Set one or multiple shell patterns separated by commas to exclude files matching certain criteria, e.g., *.gz,*.zip. Mandatory: no
offset_key offset
# Purpose: If enabled, Fluent Bit appends the offset of the current monitored file as part of the record. The value assigned becomes the key in the map. Mandatory: no
read_from_head false
# Purpose: For new discovered files on start (without a database offset/position), read the content from the head of the file, not tail. Mandatory: no
refresh_interval 60
# Purpose: The interval of refreshing the list of watched files in seconds. Mandatory: no
rotate_wait 5
# Purpose: Specify the number of extra time in seconds to monitor a file once it is rotated in case some pending data is flushed. Mandatory: no
ignore_older 1d
# Purpose: Ignores files older than ignore_older. Supports m, h, d (minutes, hours, days) syntax. Mandatory: no
ignore_active_older_files false
# Purpose: Ignore files that are older than the value set in ignore_older even if the file is being ingested. Mandatory: no
skip_long_lines off
# Purpose: When a monitored file reaches its buffer capacity due to a very long line (buffer_max_size), the default behavior is to stop monitoring that file. skip_long_lines alters that behavior and instructs Fluent Bit to skip long lines and continue processing other lines that fit into the buffer size. Mandatory: no
skip_empty_lines off
# Purpose: Skips empty lines in the log file from any further processing or output. Mandatory: no
db /fluent-bit/tail/blah.db
# Purpose: Specify the database file to keep track of monitored files and offsets. Recommended to be unique per plugin. Mandatory: no
db.sync normal
# Purpose: Set a default synchronization (I/O) method. Affects how the internal SQLite engine synchronizes to disk. Values: extra, full, normal, off. Mandatory: no
db.locking false
# Purpose: Specify that the database will be accessed only by Fluent Bit. Enabling this increases performance but restricts external tools from querying the content. Mandatory: no
db.journal_mode wal
# Purpose: Sets the journal mode for databases (wal). Enabling wal provides higher performance. Not compatible with shared network file systems. Mandatory: no
db.compare_filename false
# Purpose: Determines whether to review both inode and filename when retrieving stored file information from the database. true verifies both; false checks only the inode. Mandatory: no
mem_buf_limit 10MB
# Purpose: Set a memory limit that the Tail plugin can use when appending data to the engine. If the limit is reached, it will be paused. When the data is flushed, it resumes. Mandatory: no
exit_on_eof false
# Purpose: When reading a file, exit as soon as it reaches the end of the file. Used for bulk load and tests. Mandatory: no
parser none
# Purpose: Specify the name of a parser to interpret the entry as a structured message. Mandatory: no
key log
# Purpose: When a message is unstructured (no parser applied), it's appended as a string under the key name log. This option lets you define an alternative name for that key. Mandatory: no
inotify_watcher true
# Purpose: Set to false to use file stat watcher instead of inotify. Mandatory: no
tag blah.logs
# Purpose: Set a tag with regexextract fields that will be placed on lines read. Supports tag expansion: if the tag includes an asterisk (*), that asterisk will be replaced with the absolute path of the monitored file, with slashes replaced by dots. Mandatory: no
tag_regex (?<pod_name>[a-z0-9](?:[-a-z0-9]*[a-z0-9])?(?:\\.[a-z0-9]([-a-z0-9]*[a-z0-9])?)*)_(?<namespace_name>[^_]+)_(?<container_name>.+)-(?<container_id>[a-z0-9]{64})\.log$
# Purpose: Set a regular expression to extract fields from the filename. Mandatory: no
static_batch_size 50M
# Purpose: Set the maximum number of bytes to process per iteration for the monitored static files (files that already exist upon Fluent Bit start). Mandatory: no
file_cache_advise on
# Purpose: Set the posix_fadvise in POSIX_FADV_DONTNEED mode. This reduces the usage of the kernel file cache. This option is ignored if not running on Linux. Mandatory: no
threaded false
# Purpose: Indicates whether to run this input in its own thread. Mandatory: no
Unicode.Encoding none
# Purpose: Set the Unicode character encoding of the file data. Requests two-byte aligned chunk and buffer sizes. Supported values: UTF-16LE, UTF-16BE, and auto. Mandatory: no
Generic.Encoding none
# Purpose: Set the non-Unicode encoding of the file data. Supported values: ShiftJIS, UHC, GBK, GB18030, Big5, Win866, Win874, Win1250, Win1251, Win1252, Win1254, Win1255, Win1256. Mandatory: no
multiline.parser docker,cri
# Purpose: Specify one or multiple Multiline Parser definitions to apply to the content. When using a new multiline.parser definition, you must disable the old configuration from your tail section (e.g., parser, parser_firstline, parser_N, multiline, multiline_flush, docker_mode). Mandatory: no
multiline off
# Purpose: If enabled, the plugin will try to discover multiline messages and use the proper parsers to compose the outgoing messages. When this option is enabled, the parser option isn't used. Mandatory: no
multiline_flush 4
# Purpose: Wait period time in seconds to process queued multiline messages. Mandatory: no
parser_firstline none
# Purpose: Name of the parser that matches the beginning of a multiline message. The regular expression defined in the parser must include a group name (named capture), and the value of the last match group must be a string. Mandatory: no
parser_1 example_parser
# Purpose: Optional. Extra parser to interpret and structure multiline entries. This option can be used to define multiple parsers. For example, parser_1 ab1, parser_2 ab2, parser_N abN. Mandatory: no
docker_mode off
# Purpose: If enabled, the plugin will recombine split Docker log lines before passing them to any parser. This mode can't be used at the same time as Multiline. Mandatory: no
docker_mode_flush 4
# Purpose: Wait period time in seconds to flush queued unfinished split lines. Mandatory: no
docker_mode_parser none
# Purpose: Specify an optional parser for the first line of the Docker multiline mode. The parser name must be registered in the parsers.conf file. Mandatory: no
[OUTPUT]
Name stdout
Match *
Format json_lines
[OUTPUT] Name stdout Match * Format json_lines
I would also suggest it is worth trying the same prompt is separate conversations/sessions to see how much variability in approach to using Fluent Bit is thrown up. If the different sessions yield very similar solutions, then great. If the approaches adopted are different, then it is worth evaluating the options, but also considering what in your prompt might need clarifying (and therefore the problem being addressed).
Generating a diagram to show the configuration is also a handy way to validate whether the flow of events through it will be as expected.
The critical thing to remember is that the LLM won’t guarantee that what it provides is good practice. The LLM is generating a configuration based on what it has seen, which can be both good and bad. Not to mention applying good practice demands that we understand why a particular practice is good, and when it is to our benefit. It is so easy to forget that LLMs are primarily exceptional probability engines with feedback loops, and their reasoning is largely probabilities, feedback loops, and some deterministic tooling.
Fluent Bit version 4’s first major release dropped a couple of weeks ago (September 24, 2025). The release’s feature list isn’t as large as 4.0.4 (see my blog here). It would therefore be easy to interpret the change as less profound. But that isn’t the case. There are some new features, which we’ll come to shortly, but there are some significant improvements under the hood.
Under the hood
Fluent Bit v4.1 has introduced significant enhancements to its processing capabilities, particularly in the handling of JSON. This is really important as handling JSON is central to Fluent Bit. As many systems are handling JSON, there is at the lowest levels, continuous work happening in different libraries to make it as fast as possible. Fluent Bit has amended its processing to use a mechanism based on a yyjson, without going into the deep technical details. If you examine the benchmarking of yyjson and other comparable libraries, you’ll see that its throughput is astonishing. So accelerating processing by even a couple of percentage points can have a profound performance enhancement.
The next improvement in this area is the use of SIMD (Single Instruction, Multiple Data). This is all about how our code can exploit microprocessor architecture to achieve faster processing. As logs often need characters like new line, quotes, and other special characters encoding, and logs often carry these characters (and we tend to overlook this – consider a stack trace, where each step of the stack chain is provided on a new line, or embedding a stringified XML or JSON block in the log, which will hve multiple uses of quotes etc. As a result, any optimization of string encoding will quickly yield performance benefits. As SIMD takes advantage of CPU characteristics, not every build will have the feature. You can check to see if SIMD is being used by checking the output during startup, like tthis:
This build for Windows x86-64 as shown in the 3rd info statement doesn’t have SIMD enabled.
Other backend improvements have been made with TLS handling. The ability to collect GPU metrics with AMD hardware (significant as GPUs are becoming ever more critical not only in large AI arrays, but also for AI at the edge).
So, how do we as app developers benefit?
If Fluent Bit’s performance improves, we benefit from reduced risk of backpressure-related issues. We can either complete more work with the same compute (assuming we’re at maximum demand all the time), or we can reduce our footprint – saving money either as capital expenditure (capex) or operational expenditure (opex) (not something that most developers are typically seeking until systems are operating at hyperscale). Alternatively, we can further utilize Fluent Bit to make our operational life easier, for example, by reducing sampling slightly, implementing additional filtering/payload load logic, and streaming to detect scenarios as they occur rather than bulk processing on a downstream platform.
Functional Features
In terms of functionality, which as a developer we’re very interested in as it can make our day job easier, we have a few features.
AWS
In terms of features, there are a number of enhancements to support AWS services. This isn’t unusual; as the AWS team appears to have a very active and team of contributors for their plugins. Here the improvement is for supporting Parquet files in S3.
Supervisory Process
As our systems go ever faster, and become more complex, particularly when distributed it becomes harder to observe and intervene if a process appears to fail or worse becomes unresponsive. As a result, we need tools to have some ‘self awareness’. Fluen bit introduces the idea of an optional supervisor process. This is a small, relatively simple process that spawns the core of Fluent Bit and has the means to check the process and act as necessary. To enable the supervisor , we can add to the command line –supervisor. This feature is not available on all platforms, and the logic should report back to you during startup if you can’t use the feature. Unfortunately, the build I’m trying doesn’t appear to have the supervisor correctly wired in (it returns an error message saying it doesn’t recognize the command-line parameter).
If you want to see in detail what the supervisor is doing – you can find its core in /src/flb_supervisor.c with the supervisor_supervise_loop function, specifically.
Conclusion
With the number of differently built and configured systems, we’ll see a 4.1.x releases as these edge case gremlins are found and resolved.
As The New Stack regularly posts new extracts, we’re updating this page; accordingly, the date below reflects the last update.
With the publication of Logging Best Practices (for background to this, go here), more articles have been published through The New Stack, extending the original list we blogged about here.
So, there is a new book title published with me as the author (Logging Best Practices) published by Manning, and yes, the core content has been written by me. But was I involved with the book? Sadly, not. So what has happened?
Background
To introduce the book, I need to share some background. A tech author’s relationship with their publisher can be a little odd and potentially challenging (the editors are looking at the commerciality – what will ensure people will consider your book, as well as readability; as an author, you’re looking at what you think is important from a technical practitioner).
It is becoming increasingly common for software vendors to sponsor books. Book sponsorship involves the sponsor’s name on the cover and the option to give away ebook copies of the book for a period of time, typically during the development phase, and for 6-12 months afterwards.
This, of course, comes with a price tag for the sponsor and guarantees the publisher an immediate return. Of course, there is a gamble for the publisher as you’re risking possible sales revenue against an upfront guaranteed fee. However, for a title that isn’t guaranteed to be a best seller, as it focuses on a more specialized area, a sponsor is effectively taking the majority investment risk from the publisher (yes, the publisher still has some risk, but it is a lot smaller).
When I started on the Fluent Bit book (Logs and Telemetry), I introduced friends at Calyptia to Manning, and they struck a deal. Subsequently, Calyptia was acquired by Chronosphere (Chronosphere acquires Calyptia), so they inherited the sponsorship. An agreement I had no issue with, as I’ve written before, I write as it is a means to share what I know with the broader community. It meant my advance would be immediately settled (the advance, which comes pretty late in the process, is a payment that the publisher recovers by keeping the author’s share of a book sale).
The new book…
How does this relate to the new book? Well, the sponsorship of Logs and Telemetry is coming to an end. As a result, it appears that the commercial marketing relationship between Chronosphere and Manning has reached an agreement. Unfortunately, in this case, the agreement over publishing content wasn’t shared with the author or me, or the commissioning editor at Manning I have worked with. So we had no input on the content, who would contribute a foreword (usually someone the author knows).
Manning is allowed to do this; it is the most extreme application of the agreement with me as an author. But that isn’t the issue. The disappointing aspect is the lack of communication – discovering a new title while looking at the Chronosphere website (and then on Manning’s own website) and having to contact the commissioning editor to clarify the situation isn’t ideal.
Reading between the lines (and possibly coming to 2 + 2 = 5), Chronosphere’s new log management product launch, and presumably being interested in sponsoring content that ties in. My first book with Manning (Logging in Action), which focused on Fluentd, includes chapters on logging best practices and using logging frameworks. As a result, a decision was made to combine chapters from both books to create the new title.
Had we been in the loop during the discussion, we could have looked at tweaking the content to make it more cohesive and perhaps incorporated some new content – a missed opportunity.
If you already have the Logging in Action and Logs and Telemetry titles, then you already have all the material in Logging Best Practices. While the book is on the Manning site, if you follow the link or search for it, you’ll see it isn’t available. Today, the only way to get a copy is to go to Chronosphere and give them your details. Of course, suppose you only have one of the books. In that case, I’d recommend considering buying the other one (yes, I’ll get a small single-digit percentage of the money you spend), but more importantly, you’ll have details relating to the entire Fluent ecosystem, and plenty of insights that will help even if you’re currently only focused on one of the Fluent tools.
Going forward
While I’m disappointed by how this played out, it doesn’t mean I won’t work with Manning again. But we’ll probably approach things a little differently. At the end of the day, the relationship with Manning extends beyond commercial marketing.
Manning has a tremendous group of authors, and aside from writing, the relationship allows me to see new titles in development.
Working with the development team is an enriching experience.
It is a brand with a recognized quality.
The social/online marketing team(s) are great to interact with – not just to help with my book, but with opportunities to help other authors.
As to another book, if there was an ask or need for an update on the original books, we’d certainly consider it. If we identify an area that warrants a book and I possess the necessary knowledge to write it, then maybe. However, I tend to focus on more specialized domains, so the books won’t be best-selling titles. It is this sort of content that is most at risk of being disrupted by AI, and things like vibe coding will have the most significant impact, making it the riskiest area for publishers. Oh, and this has to be worked around the day job and family.
You must be logged in to post a comment.