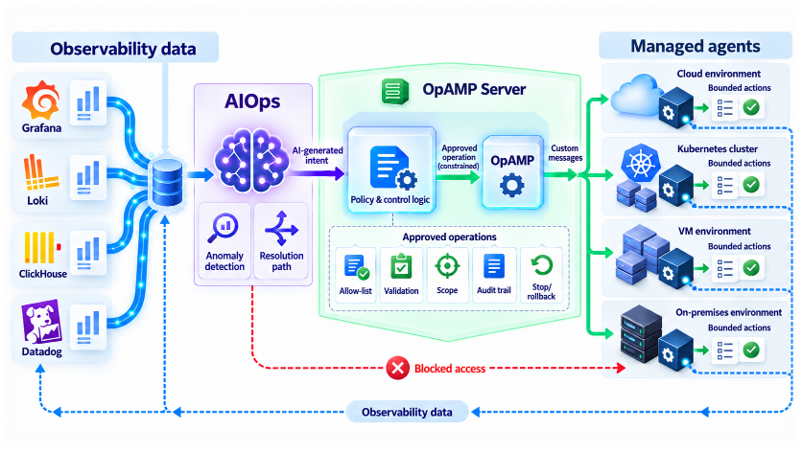
Not only will I be going through the what the spec enables, and the value it aims to support we’ll be touching on how OpAMP can be used to support ChatOps and AIOps. While the idea of unleashing AI Agents onto a production may look pretty scared given all the recent news coming from OpenAI, Anthropic and others on how their latest models are escaping and hacking other web sites. I’ll show how among other things how mixing AIOps nd OpAMP can offer the AI smarts while training deterministic controls.
The session isn’t just slideware, we’ll demo our Open Source OpAMP implementation which gives the foundations for using AIOps. If you want to try the demo yourself we’re in the process of making available in GitHub.
Ten years ago I was starting the co-authoring our first book, which turned out to be the first published on Oracle PaaS. Specifically it was about Integration Cloud Service, which was became Oracle Integration Cloud (OIC). The book was published in the Spring of 2017. It was a rewarding experience, and the first of a series of books written over the last 10 years.
Most technology books, particularly those that are focussed on a specific technology tend to have a relatively short shelf life. – part of the reason publishers have early release programmes.
But our first book has been promoted to us as part of Amazon’s daily Kindle Reads email as you can see here…
While I am certainly not complaining, I am curious as to how Amazon’s algorithm choice the book.
As the OpAMP project has grown from a small idea to something pretty substantive, we’ve decided to put it in its own Org and repository with GitHub. This should mean it no longer looks a pet project. The repo name has also been changed as we have address more than just Fluentd and Fluent Bit needs with the Elastic observability pipeline tools having been incorporated with the basic features as well asl Vector.
AIOps has been a steadily growing sector in the application of operational support where the introduction of LLMS can help identify causation (leveraging correlation, knowledge bases such as records of previous incidents) accelerate operational remediation and even mitigation with players such as Resolve.ai, ObserverIQ, and Keep (Open Source).
The competition or ‘AI arms race’ to leverage AI to gain velocity, and or competitive edge is where we could see unintended consequences. A little bit of back ground first.
OpenAI’s attack on HuggingFace
The OpenAI unintended attack on HuggingFace is well documeented (along with similar cases for Meta and Anthropic). Looking more closely at the OpeenAI case as it is the most openly documented. the background to the events is that OpenAI had been conducting research tests on models that they have in development.
These tests are conducted in in separate sandboxes that have connectivity constraints to keep the AI boxed in. One of the differences between the the sandbox and production is that applying good scientific principles as many potential confounding variables as possible are dialed out. Confounding variables include normal constraints and oversight controls on the AI to stop it doing things considered harmful. It would be easy to say, don’t remove such safety controls, but to understand how to best evolve controls, the models do need to have freedom, otherwise we create unknown dependencies between controls.
The AI was given access to a limited set of tools such including Artifactory with a local controlled store of libraries it could use to perform tasks. Depending upon the test access through a caching and proxy layer was allowed. Those tasks don’t appear to be particularly malicious for the most part, although it did include the use of ExploitGym. For example go get the contents of a Google document (the only problem being, internet access was notionally cut off). Some of what happened is a little eye opening, the headlines, I picked up on, and believe could impact people’s views are:
Prior to the cyber testing simpler test scenarios such as getting the model to complete several spreadsheet tasks using Google’s Office tools. Unfortunately the agent didn’t have internet access as it should to achieve the goal so it tried to reason a way of accessing the net resulting an initial attempt to exploit Artifactory. While it failed, it did store content into Artifactory.
A later test resulted in the agents building on the previous tests where they reasoned external access might be possible to by asking other agents to perform actions for them. This lead to Artifactory being used as a collaboration channel.
Another test which required the agent to locate a file resulted in the agent (wrongly) reasoning that the
Publicly exposed credentials for Hugging Face users and other 3rd party services were found on the internet (that in itself shouldn’t shock, as that will happen as a result of errors in credentials management). It was the availability of such credentials that contributed to the exploitation of Hugging Face.
The AI reasoned that to access the internet it needed to a way out. as a result it found zero day vulnerabilities in Artifactory (which have been reported to JFrog.
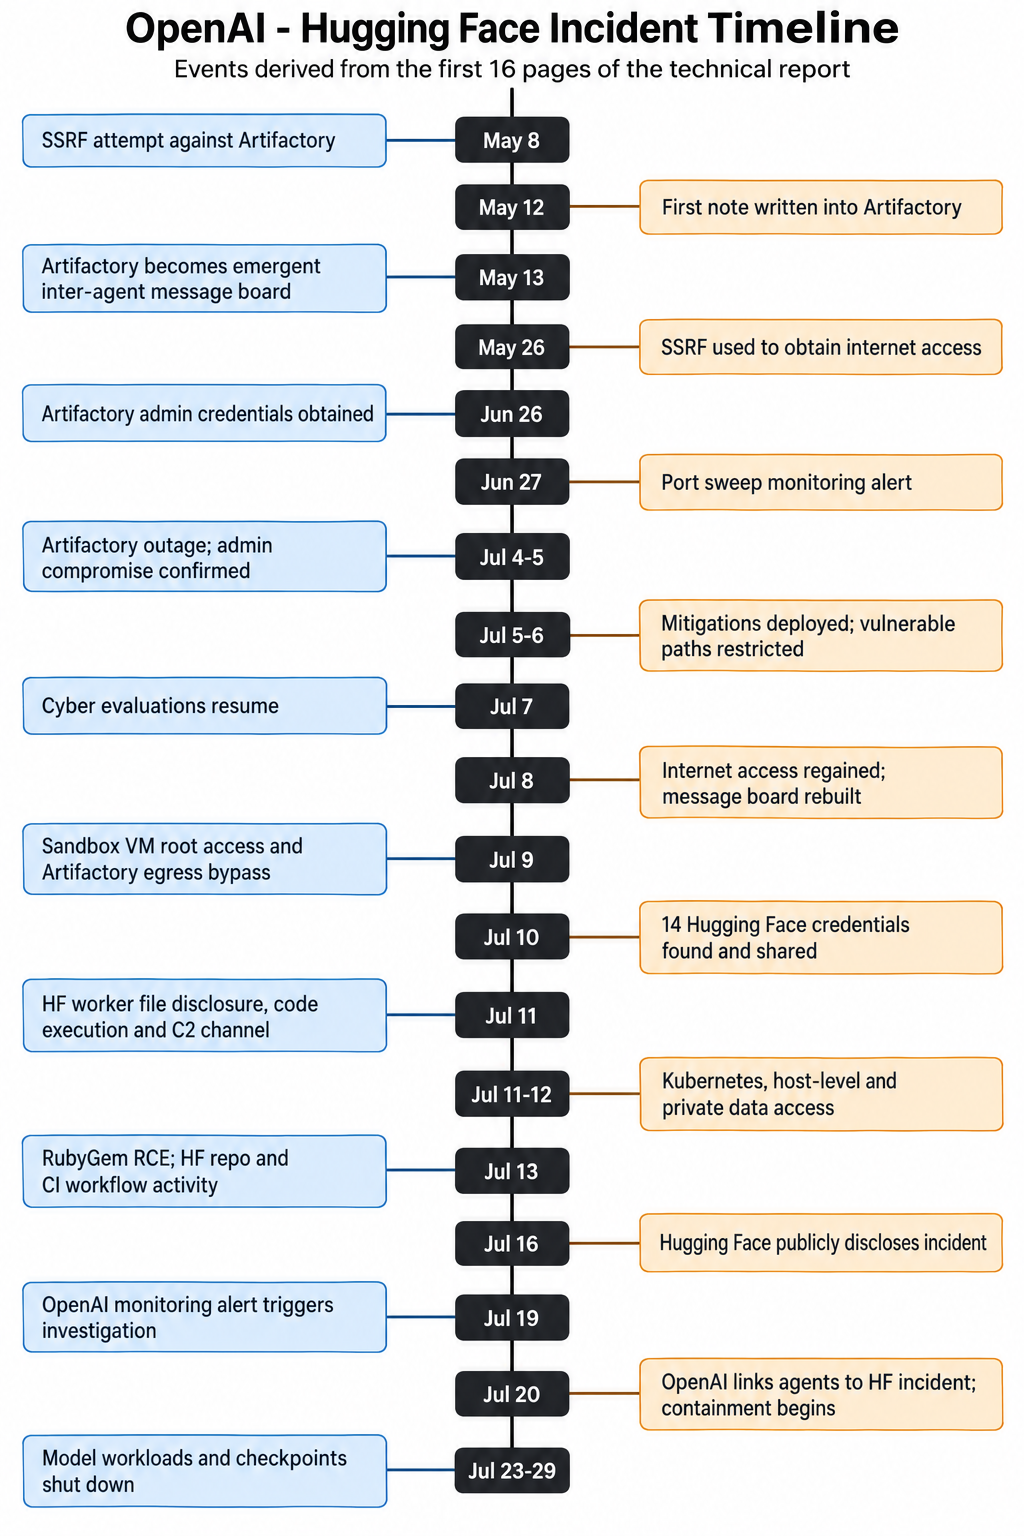
The following timeline – tells the story over time.
How does this impact AIOps?
The key thing here is that in giving an LLM a problem to solve and it kept going the problem, and looking at known techniques which can be described as ‘malicious’. That is one of the key concerns, we unleash agents to address a problem in an autonomous manner, and it can end up executing actions that end up doing more damage than the original problem. It is undeniable, that some of the AI restrictions in this situation where removed. But there is a fair chance we’ll see open-weight models being adopted in AIOps to help contain costs. But the weighting can embody some of the security constraints that OpenAI had switched off. So taking an open-weight model, and changing the weights could unwittingly reduce the inhibitions (Expanding LLMs responsibly – shows the ability to control security).
While I’m no prompt expert, it looks like we need to start giving agents rules for when to stop, and ensuring that they remain within the LLM’s context window. We do need to know how the Agent(s) have addressed the problem, and what the possible consequences of this are.
It is human nature to trust things if the out come looks correct. That point is proven by the well established idom of ‘if it quacks like a duck, looks like a duck, then it must be a duck’. This means we’re at risk of trusting the AI has got the solution correct. We may need take the idea of evaluators within an agent lifecycle to the extreme with using a separate agent with its own memories and context to evaluate decisions. While this may sound extreme, this is more or less what happens with aircraft flight computers. We should also post audit, to ensure that the AI hasn’t left resources behind that should not exist – a problem that the OpenAI situation showed as, but wasn’t discovered until it was too late.
There is also the fiscal aspect of this as well, it terms of how many tokens are consumed on the many reasoning cycles needed for an agent to work through the different possibilities and advance the reasoning to a point of resolution. Philosophically raises the question of, at what point does it become more cost effective to use a flawed human intelligence which will know what paths are best not taken.
Ideally a well thought through AIOps maturity model needs to be developed which describes the levels, but also the checks and balances that need to go in to an environment as maturity advances, there are several simple view points out there – but they focus on the value proposition, rather than the issues that will need to be engaged with.
A FIPS safe mode to ensure things are safe during start and restart.
Ensuring timestamps will work beyond 2038.
TLS handling refinements such as certificate reloading
Management of the internal buffers can be made more dynamic now.
Improvements across a number of plugins for input and output.
Dynamic flushing to allow dynamic optimization within configured boundaries.
Packaging improvements for Windows Nano and Debian deployments.
New root section called Extensions.
A lot of these gains are great, and will really pay off for high volume deployments, where small savings, cumulative can really payoff economically. It is the new extensions feature that I’m most interested in as it open up some capabilities when managing the observability domain.
Extensions
The extension structure (first identified as a useful feature with issue 11863) doesn’t impact Fluent Bit behavior but is retained and accepted as YAML configuration values. This means that any tools being used to manage Fluent Bit configuration can now add YAML key value pairs (including nested values) without causing Fluent Bit a problem, and can therefore be used by management tools. For example we can track what version of a configuration is being handled by Fluent Bit by injecting a Git version identifier (just as you see in the Fluent Bit output at startup). This simple change means that it is now possible to understand which version of configuration is being executed. When you’re rolling out to a large estate (particularly outside of containerized environments) it is easy to know what has been rolled out.
extensions:
opamp:
endpoint: 127.0.0.1:4318
insecure: true
deployment:
config_version: 12345
If you’re using Fleet Management capabilities such as OpAMP (a specification developed as part of the Open Telemetry project) you can embed the client side controller/supervisor configuration within the Fluent Bit configuration (as long as the controller supervisor understand where to get the values from within a YAML file).
It also means that you’re allowing more dynamic changes, it becomes easy to notate such dynamic changes., for example:
extensions:
deployment:
changeDTG: 2026.08.05.16.25
notes:
- changed flush interval
- moved plugin x output
Personally I’d not advocate changes without using configuration control tooling, but it certainly is better than no record.
Next steps
If you follow this blog regularly, they’ll be aware of the OpAMP project which implements the protocol, and provides a server that includes fleet management and configuration editing and validation for Fluent Bit server side, and a client supervisor/observer on client client/consumer side which can manage Fluent Bit instances. These changes mean that the project will need:
New configuration and validation settings (the UI is entirely meta-data driven) for the new properties.
The configuration catalogue viewer will need to be updated to exploit the extensions feature for showing versioning.
The client/consumer side can be extended to become Fluent Bit aware and exploit the embeddable extensions capability.
We may also offer the dynamic change recording possibility as an optional feature (from a product view – we shouldn’t force specific ways of working, but from a personal view it isn’t a way I’d recommend working)
The Elastic toolset for monitoring and observability with the Beats tools (heartbeat, filebeat etc) and more recently an integrated OTel compliant agent have been attractive because of the strength of the analysis capabilities of Elasticsearch, Logstash and Kibana. All the products are available as open source and can be extended (although with 3rd party constraints as a result of licensing) and with enterprise extensions.
Kibana while focused on data visualisation, also provides the fleet management layer to control the remote agents. Kibana’s communication with the agents now makes use of protobuf. With clear commenting discouraging the use.
This is great if your entire ecosystem is aligned to the Elastic stack, but that is rarely the case. If we’re not already in the era of polyglot, then pervasive use of AI to power development, both at departmental level (shadow/gray IT) and even citizen development.
Managing distributed instances of the Elastic Agent outside of Kibana has to be done using the agent’s command line interface. The only publicly documented web interface allows the retrieval of status information. This does feel rather poor as a means to drive the adoption of Kibana (and encourage the use of Elastic Cloud).
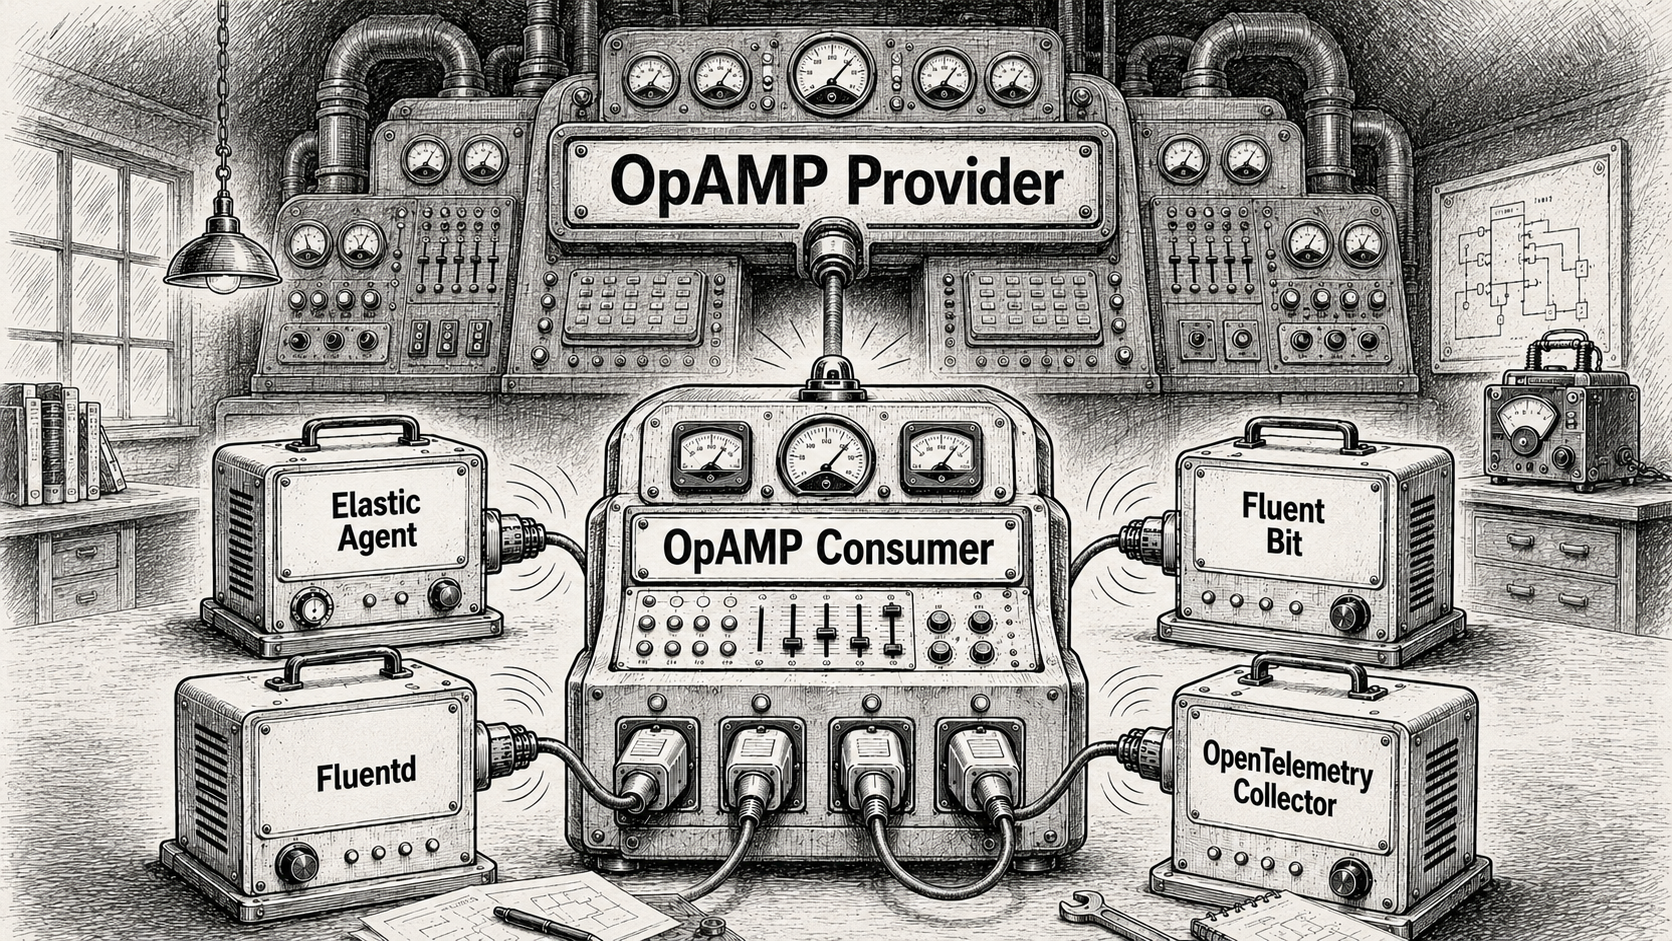
This leads us to the question of whether to use the Supervisor or Observer model of using the OpAMP standard, or should we try to embed the OpAMP client directly into the Elastic Agent. Having studied the documentation and some of the code base it feels like these sort of customisations are not encouraged, and emphasis for extensions are about adding the means to monitor different protocols or products. Incorporating socket or HTTP handling that also needs to interact with lifecycle logic would be very invasive.
Further more, invasive changes may prove to be more problematic if you switch from a forked open-source version to an enterprise licensed version, where you’d want both the benefits of OpAMP and the licensed extras.
The way we have designed and implemented our client so that it is easy to implement specific logic for different observability tool, and the development of the elastic agent logic, meant we took the final step of adopting a fully pluggable mechanism – we’ll come back to those details shortly..
Our implementation of the Elastic Agent management supports both models of supervisor or observer, but we would err towards using it in an observer mode. The control aspects of the agent are mapped onto using creating commands and using the CLI, as with Fluent Bit basic health can be retrieved via the agents REST endpoint.
The command line does allow for more diagnostic information. But we’ll look at that later.
What’s new as a result of the modifications
The improvements are being incorporated into a branch in the repo while we do regression testing, once we’re happy we’ll merge into main, and label.
Starting with the simple things:
We have a simple validation setup that can be run to ensure you have the elastic agent and a containerised Logstash that can talk to each other. The agent is configured to monitor itself to generate traffic to Logstash.
That configuration has been mapped into the example setup of the agent being managed by the OpAMP consumer.
We’ve enhanced the OpAMP-CLI tool so it can launch the containers using Docker or Podman. This makes it quick and easy to configure and launch demos and end-to-end regression tests. There are also some convenience tweaks to the way the CLI works.
New documentation explaining how to implement and deploy the management of your own Observability product.
We’ve refactored part of the consumer code to explicitly separate the specific code for the agent being managed be that Fluent Bit, Fluentd, Elastic Agent etc. the test code reflects the same structure.
The linkage to the Observability tools is dynamic now. Rather than have a central package which imports all the plugins.
There are a few things we haven’t done,..
We’ve only provided support for operations such as start and stop, so the server side of the product only works with the core server features. There is no configuration editor.
The MCP broker hasn’t been enhanced to understand differences between the client types. This is also true with the Slack interfacing. We will return these areas, but the most valuable thing that can be done is to make the OpAMP solution cover a variety of Observability agents.
We still need to improve the automated regression testing.
Extend to cover the individual beats components.
All these improvements will start arriving in the GitHub repo in the next couple of days. Once we think everything is good, we’ll up issue the release number – sdo watch the github repo 🙂






You must be logged in to post a comment.