Just about any web-based application will have cookies, even if they are being used as part of session management. Then, if you’re in the business-to-consumer space, you’ll likely use tracking cookies to help understand your users.
Understanding what is required depends on which part of the world your application is being used in. For the European Union (EU) and the broader European Economic Area (EEA), this is easy as all the countries have ratified the GDPR and several related laws like the ePrivacy Directive.
For North America (USA and Canada), the issue is a bit more complex as it is a network of federal and state/province law. But the strictest state legislation, such as California, aligns closely with European demands, so as a rule of thumb, meet EU legislation, and you should be in pretty good shape in North America (from a non-lawyer’s perspective).
The problem is that the EEA accounts for 30 countries (see here), plus the USA and Canada, and we have 32 of the UN’s recognized 195 states (note there is a difference between UN membership and UN recognition). So, how do we understand what the rules are for the remaining 163 countries?
I’m fortunate to work for a large multinational company with a legal team that provides guidelines for us to follow. However, I obviously can’t share that information or use it personally. Not to mention, I was a little curious to see how hard it is to get a picture of the global landscape and its needs.
It turns out that getting a picture of things is a lot harder than I’d expected. I’d assumed that finding aggregated guidance would be easy (after all, there are great sites like DLA Piper’s and the UN Trade & Development that cover the more general data protection law). But, far from it. I can only attribute this to the fact that there is a strong business in managing cookie consents.
The resources that I did find, which looked comprehensive on the subject:
Like many developers and architects, I track the news feeds from websites such as The New Stack and InfoQ. I’ve even submitted articles to some of these sites and saw them published. However, in the last week, something rather odd occurred: articles in The New Stack (TNS) appeared, attributed to me, although I had no involvement in the publication process with TNS; yet, the content is definitely mine. So what appears to be happening?
To help answer this, let me provide a little backstory. Back in October and November last year, we completed the publication of my book about Fluent Bit (called Logs and Telemetry with a working title of Fluent Bit with Kubernetes), a follow-up from Logging In Action (which covered Fluent Bit’s older sibling, Fluentd). During the process of writing these books, I have had the opportunity to get to know members of the team behind these CNCF projects and consider them as engineering friends. Through several changes, the core team has primarily come to work for Chronosphere. To cut a long story short, I connected the Fluent Bit team to Manning, and they sponsored my book (giving them the privilege of giving away a certain number of copies of the book, cover branding, and so on).
It appears that, as part of working with Manning’s marketing team, authors are invited to submit articles and agree to have them published on Manning’s website. Upon closer examination, the articles appear to have been sponsored by Chronosphere, with an apparent reference to Manning publications. So somewhere among the marketing and sales teams, an agreement has been made, and content has been reused. Sadly, no one thought to tell the author.
I don’t in principle have an issue with this, after all, I wrote the book, and blog on these subjects because I believe enabling an understanding of technologies like Fluent Bit is valuable and my way of contributing to the IT community (Yes, I do see a little bit of money from sales, but the money-to-time and effort ratio works out to be less than minimum wage).
The most frustrating bit of all of this is that one of the articles links to a book I’ve not been involved with, and the authors of Effective Platform Engineering aren’t being properly credited. It turns out that Chronosphere is sponsoring Effective Platform Engineering (Manning’s page for this is here).
Oracle has an intern programme. While the programmes differ around the world because of the way relationships with educational establishments work and the number of interns that can be supported within a particular part of the organization, there is a common goal—transitioning (under)graduates from a world of theory into productive junior staff (in the cases I work with, that’s developers).
This blog summarizes the steps I have taken with my mentees and elaborates on how I personally approach the mentor role. It serves as a checklist for myself so I don’t have to recreate it as we embark on a new journey.
Interns typically have several lines of reporting – the intern programme leadership, an engineering manager, and a technical mentor. The engineering manager and technical mentor is typically a senior engineer or architect with battle-hardened experience who is able to explain the broader picture and why things are done in particular ways. The mentor and engineering manager roles can often overlap. But the two points of contact exist, as that is how we run our product teams.
Each of the following headings covers the different phases of an intern engagement.
Introduction conversation
When starting the intern programme, and as with any mid-sized organisation, there is a standard onboarding process, which will cover all the details such as corporate policy, and possibly mandatory development skills. While this is happening, I’ll reach out to briefly introduce myself, and tell the intern to let me know when they think they’ll have completed that initial work. We use that as the point at which we have an initial, wide-ranging conversation covering …
expectations, goals, and rules of engagement
I have a couple of simple rules, which I ask my team and interns to work by:
Don’t say you understand when you don’t – as a mentor, your learning is as much my ability to communicate as it is your attention
No question is stupid
Your questions help me understand you better, pitch my communication better, appreciate what needs to be explained, and point out the best resources to help.
The more you ask, the more I share, which will help you find your path.
Mistakes are fine (and often, you can learn a lot from them), but we should own them (no deflection, or hiding – if there is a mistake or problem, let’s address it as soon as possible) and never repeat the same mistake.
We discuss the product’s purpose, value proposition, and definition of success. How do the architecture and technologies being used contribute to the solution? This helps, particularly when some of the technologies may not be seen as cool. It also provides context for the stories the intern will pick up.
Ongoing dialogue
During the internship, we have a weekly one-to-one call. Initially, the focus is to discuss progress, but as things progress, I encourage the intern to use the session to discuss anything they wish. From technologies to what things they enjoy. How they’re progressing, what is good, what can be better. Resources available to learn from, things to try.
Importantly, I put emphasis on the fact that the interns feel part of the team, never need to wait for these weekly calls if they have concerns, questions, requests, need help, etc. We get a grip on it early before things start to go very wrong.
Tasks & backlog
While the interns may not (at least to start with) be working on a product or at least be focussed on immediate tasks, we adopt normal working processes and practices. So, we manage tasks through JIRA; development processes are the same.
The major goals during the internship need to support a narrative for the intern’s degree defence. At the same time, they need to get a taste of the technologies being used across the product, such as the front-end presentation tier and the persistence and integration tech stack. The work needs to ultimately contribute to the product development programme.
In the stories early on in the internship, we keep well off the critical path, which means we can take the time to learn and understand why things are the way they are without any pressure. As the internship progresses, we start to bring stories in that are linked to specific deliverable milestones.
try and have a narrative for their degree/post-grad defence
Being part of the team
A mentor is only one part of the intern’s education journey. Ideally, learning can come from very interaction, so we need to facilitate:
It’s important that the interns feel part of the team, so they’re included in all the stand-ups and sprint planning. The intern tasks are managed as stories, just like everyone else’s. Being part of a team will help ease the tensions that can be experienced if someone is working with someone they also know has to evaluate their progress.
This gives the interns the chance to build relationships with others with whom they can talk and learn from those who are closer to where they are in their career journey.
Helping their Learning
From a mentor supporting technical development, when questions are asked, we take the time to not only answer the immediate question but also talk about the context and rationale. We look at where sources of information can be found – we don’t want to get into spoon feeding people, otherwise they’ll never stand up and figure things out for themselves. It is better that people seek some direction and then figure things out. Then go back and present what the right answer is. This way you embed initiative, different perspectives can be seen and life is easier if you’re told of a problem and then offered a solution.
Feedback
Feedback is important; if they’re doing well, then it reassures them to know this, and you’ll see more of what they’re like if you hire them. If there are problems, it is best to have quiet, informal one-to-one conversations. Things aren’t bad, but we all can be better. This positioning is constructive, and as a mentor, I’m there to help the intern find the way to overcome any weaknesses, or to recognize that strengths may be suited in other roles. The outcome of an internship should not be a surprise, but simply a formalized ceremony.
When we start our IT career (and depending on how long ago you started), the idea of software and legislation seemed pretty remote; the only rules you might have to contend with were your local development standards. As an architect today, that is far from the case, as the saying goes, you need to be a ‘Jack of all Trades’. You don’t need to be a lawyer, but you have to have a grasp of legislation and agreements that can impact, and recognise when it is time to talk to the legal eagles.
I thought it worthwhile calling out the different things we need to have a handle on, based on my experience. There will always be domain-specific laws, but the following are largely universal..
Software licenses—Today, we rarely build a solution without using a library, package, utility, or even a full application we haven’t written ourselves.
But what we can and can’t do with that third-party asset or reasonably expect from it, provided the resource is provided, is dictated by a license, explicit or implicit. Consider the implications of an Apache license compared to a Creative Commons Share-Alike. In terms of negative impact, open source licenses can at worst…
Prevent code from being used commercially or to provide commercial services (several software vendors, such as Elastic and Hashicorp, have adopted this).
Require you to share whatever you develop using open-source libraries
Declare your use of libraries (remember, such information can provide clues on possible attack vectors).
Fortunately, licenses for software solutions under several organizational umbrellas, such as the Linux Foundation (and its subsidiary organizations, such as the CNCF), require the projects to adopt a permissive licensing model.
Commercial licenses can come into play as well. The Open Source model often involves the key contributing organizations offering services such as support and training, or extended features. A|ttractive for larger organizations so that they have a fallback and access to specialist resources. However, we also have products that only exist commercially. Understanding the licensing position of these tools is essential – for example, Oracle database, where you pay for production deployments by the number of CPUs, but non-production deployments are free. Such licensing may have material on the architecture, for example, minimizing the amount of non-DB compute effort on those nodes that take place, and sizing your solution such that you have more CPUs but with less power to provide better resilience. In terms of negative impacts…
You can become exposed to unplanned license costs that hadn’t been planned.
Undermine the solution’s cost-benefit
GDPR – There are many variations of the General Data Protection Regulation (GDPR), but most have taken GDPR as a foundation. Covering concepts of the right to know and correct data held about an individual, disclosure as to personal data use, and the right to be forgotten are essential. There are resources available that cover which laws apply where. The negative impacts…
Additional development processes and administration to create evidence of compliance (eg, audit of access to data)
Additional costs to satisfy compliance, e.g, regular mandatory training for all developers that could be impacted
Several acts, such as the US Cloud Act, can also impact the choices of service providers when using hosting, such as cloud providers. This highlights an interesting factor to keep in mind: legislation from other countries can still impact the situation even if the solution will not be used in that country. Impacts could be…
Using sovereign cloud and any associated costs.
Solution options are controlled by the availability of sovereign cloud services.
Limit the use of managed services to make the solution portable to different sovereign clouds.
AI and ML are rapidly evolving areas of legislation. The EU has been proactive in this space with the AI Act. However, secondary legislative factors exist, such as intellectual property law. While we may not all be directly involved in training LLMs, we still need to understand the ramifications and the data we work with. Possible impacts can include…
Data source assurance processes.
PCI—While the Payment Card Industry (PCI) does not have legal standing, its impact is broad and substantial, so we might as well treat it as such. The exact rules PCI requires depend on whether you’re an organization providing the use and storage of cards or a service provider.
In areas like PCI, while not strictly legislation, certain domain compliances demand compliance with various standards, perhaps the most pervasive of these is ISO27001, which covers information security across the spectrum of business/commercial considerations, but extends to infrastructure, software, and its development IT. Understanding this and standards such as SOC 1, SOC 2, and SSAE16 (now 18 and 22) are essential to understand, as these are standards you need to determine if they are important to you when considering cloud and SaaS services, particularly. Things have improved over time, but we have encountered specialist managed/cloud services where the providers are unaware of such standards and have no position or evidence of addressing some of the expectations set out by SOC1 and SOC2.
If you work for a software vendor, exportation law can impact your business, particularly when the solution involves complex algorithms such as those used in encryption.
These points primarily focus on ‘universal truths’, but there are domain-specific laws and expected standards that can be considered in the same or similar light. As with all domains, there are specialist legislation requirements like the Digital Operational Resilience Act (DORA) that impact financial businesses and Consumer Protection (Distance Selling) for e-tail.
The rapid development of generative AI in traditional code development (third-generation language use) has had a lot of impact, with claims of massive productivity improvements. Given that developer productivity has historically been the domain of low-code tooling, this has led me to wonder whether the gap is shrinking and whether we are approaching a point where the benefits of low-code tools are being eroded for mainstream development.
To better understand this, let’s revisit how both technologies help.
AI-supported development
Delivered value in several ways:
Code refactoring and optimization
Code documentation generation
Unit test generation
Next generation of auto-complete
This can include creating code in a green field context. If you’ve been following reports on the value of services like Copilot, AWS Q Developer, and Code Assist, you’ll see that these tools are delivering a significant productivity boost. A recent ACM article pointed to benefits as high as a threefold boost for more routine activities, tapering off as tasks became more complex.
Low Code
Low-code tools have been around for a long time, while they have evolved and progressed, and have come in a number of forms, such as:
UI applications that map databases to screens.
Business process is defined with a visual tool support for BPM.
Connecting different data sources by using visual notations to leverage representations of sources and sinks and link them together.
The central value proposition of low-code development is speed and agility. This performance comes with the constraint that your development has to fit into the framework, which may have constraints such as how it can scale, elasticity for rapid scaling, and performance optimization. ACM conducted some research into the productivity gains here.
Development acceleration narrowing
Low-code/no-code tools are often associated with the idea of citizen developers, where people with primarily a business background and a broad appreciation of IT are able to develop applications (personal experience points to more developers being able to focus less on code, and more on usability of apps). KPMG shares a view on this here.
Evolution of AI that could change low-code?
It would be easy to be a doom monger and say that this will be the end of highly paid software engineering jobs. But we have said this many times over in the last twenty or thirty years (e.g Future of Development).
Looking at the figures, the gains of Gen AI for code development aren’t going to invalidate Low/no code tooling. Where it really benefits is where a low-code tool is not going to offer a good fit to the needs being developed, such as complex graphical UI.
What if …
If Low-Code and Generative AI assistive technologies coalesce, then we’ll see a new generation of citizen developers who can accomplish a lot more. Typical business solutions will be built more rapidly. For example, I can simply describe the UI, and the AI generates a suitable layout that incorporates all the UX features, supporting the W3C guidelines. Furthermore, it may also be able to escape the constraints of low-code frameworks.
The work of developing very efficient, highly scalable Ui building blocks, with libraries to use them will still demand talented developers. Such work is likely to also involve AI model and agent development skills, so the AI can work out how to use such building blocks.
To build such capabilities, we’re going to need to help iron out issues of hallucination from the models. Some UX roles could well be impacted as well, as how we impose consistency in a user’s experience probably needs to be approached differently to defining templates.
Merging of assistive technologies
To truly leverage AI for low-code development, we will likely need to bring multiple concepts together, including describing UIs, linking application logic to leverage other services, and defining algorithms. Bringing these together will require work to harmonize how we communicate with the different AI elements so they can leverage a common context and interact with the user if using a single voice.
Conclusion
So the productivity gap between traditional development and low/no-code has shrunk a bit, I suspect we’ll see this grow quickly if generative AI can be harnessed and is applied, not just as a superficial enhancement, but from a ground-up revisit of how the load-code tooling works. Although the first wave, like everywhere else, will be superficial in the rush for everyone to say their service or tool is AI-enabled.
Following on from my previous piece, I thought I’d cover additional music options that aren’t necessarily vinyl.
Not vinyl, but…
Super Deluxe Editions (SDE)
SDE produces Blu-ray versions of albums. These typically consist of high-quality audio mixes of the albums, along with surround sound audio mixes for an immersive sound experience. While not marketed as limited editions specifically, they appear to be produced in limited quantities, with pre-order volumes dictating the number of copies to be produced.
If you have an artist you like, an established rock or indie act that is about to reissue a successful album or release a new title with high expectations, it’s worth checking in with SDE if Blu-ray audio is of interest. To date, releases have been made available for Paul McCartney, Tears for Fears, Kraftwerk, Suede, Bob Dylan, and others.
Subscriptions
Many artists, particularly those who are not multi-million-selling artists, are exploring the use of subscription models through services such as Patreon and Bandcamp. It is possible to buy such subscriptions as gifts.
The subscription’s benefits vary from artist to artist, but they usually involve additional releases not available elsewhere. Examples of this include Thea Gilmore (a new song every month) and Peter Gabriel (previously unreleased recordings, versions of songs during their development, etc.).
Books
Books seem to be a growing area, not just in the form of biographies, but also in narratives about music collections, album artwork, and so on.
Aubrey ‘Po’ Powell – complete Hipgnosis Catalogue (I got my copy from Hypergallery)
Dust & Grooves is the best book I’ve seen on vinyl collecting
Some of these books, while substantial volumes, are getting very expensive. We have a signed copy of Aubrey Powell’s Complete Hipgnosis Catalogue (the group responsible for the art on all of Pink Floyd’s albums) from a couple of years ago for less than £50. The second volume of Dust & Grooves, released this year, costs £100 for a standard copy.
Some indie record stores are expanding to cover music-related books, such as Resident Music.
Kit
Aside from buying music, another option is resources to help care for a vinyl collection. There are some nice kits available, which bundle vinyl brushes, cleaning solutions, and more. But such kits have limited benefit. To provide proper care, consider a suitable vinyl cleaning machine. Good ones start at a couple of hundred pounds and are best purchased through a hi-fi dealer, such as Audio-T or Sevenoaks Sound and Vision. They typically use ironised water to gently wash the vinyl. Don’t suggest tap or typical bottled water as these will contain small impurities that dry into the grooves – the very thing you’re trying to avoid.
Better still, to minimize the problems of dust and dirt, is to store records within antistatic inserts. Have you ever noticed how brand-new vinyl can be challenging to remove from the inner sleeve? That’s static at play, and it also attracts dust and dirt into the grooves. The static will build up as you slide the vinyl in and out of the inner sleeves. So, putting the vinyl into an antistatic sleeve first removes that problem. Some record companies provide the albums in a paper inner sleeve, which is lined with an anti-static layer – Godwana Records do this. However, the inner sleeve is typically plain, without any printing (i.e., printed lyrics, musician details, or artist commentary).
Pro-Ject VC-E2 Vinyl Record Cleaner – from dealers like Audio-T
There are several brands available, but the best ones, which many people swear by, are Nagaoka RS-LP2 Anti-Static Record Sleeves, also referred to as Nagaoka No. 102. These usually come in packs of 50, and you can expect to pay £30 per pack.
If the records are not being stored in a nice soft-lined sturdy record case, then consider outer sleeves. This will help in several ways …
Reduces dust and dirt getting into the sleeve in the first place.
Reduces the potential for sleeve wear (corners and edges can show wear) as the records are slid in and out of shelves.
Reducing sun bleaching of the sleeve is the shelving that gets exposed to direct sunlight.
Replace the PVC packaging that records are shipped in, as it can cause the sleeve and record to tarnish over time due to plastic ‘off-gassing’ (a more detailed explanation can be found here). You want to replace that with Polyethylene (also known as polythene) sleeves.
These are pretty easy to source. Personally, I’ve dealt with Covers33 and found their products to be of good quality and well-priced. Remember, if you’re using sleeves for box sets, you’ll need larger sleeves, which are not always easy to obtain.
Artwork
Most people think of hanging original or limited, signed prints from artists or photographers, where the art was not created for a specific purpose, such as album sleeves. However, the art for album sleeves is no less of an artistic endeavour, and doesn’t have to be plastered with titles and other text. You can collect such art with limited-edition prints approved and signed by the artist and/or the musician. You can find this sort of thing at galleries such as Hypergallery or St Paul’s Gallery. If you go something like this, the picture needs to be framed appropriately and, importantly, has a certificate of authenticity.
Conclusion
These two posts started out as just sharing some brief thoughts, but have morphed into a bit of a monster. I hope you find them useful. As I wrote these two posts, a couple of pieces on HiFi Pig Magazine came to mind, which I thought were worth sharing as they do reflect aspects of the mind of vinyl music collectors:
Buying vinyl as a gift for a loved one can be tricky if you’re not an aficionado. Buying vinyl generally is easy – just hitting a box shifter like Amazon can do it. However, in most cases, you will only get a generic pressing for mainstream artists, and won’t receive something collectible.
This isn’t a hint for me, as I always keep a list of suggestions for those significant dates. As I’m not the only vinyl fan in our extended family, I thought I’d share the thinking I go through – or at least that is how this post started out.
New releases
From a collector’s perspective, like books generally, 1st issues are more collectible than later additional pressings or reissues. Often, reissues will be on standard black vinyl with a standard sleeve. There are some things where reissues are worth considering, and we’ll come back to this.
In the last couple of years, new releases have seen multiple versions being made available. The versions differ in two ways. Firstly,y special editions will come with extra tracks, typically these tracks are:
Alternate mixes result from how the song is put together in the studio.
Demos, early versions that artists have put together before entering the studio to produce the song properly. In some cases, these versions can turn out to be better than the final production (as was the case with Norah Jones’ debut album).
Live performances, artists often record their own shows, even if it’s just to review and improve.
B-sides, when vinyl and CD singles were dominant, you would have multiple additional tracks. It was once common for an artist to record 20 or more songs for an album. Ten or so tracks would make the album, and others would be included as B-sides.
A recent development is the emergence of different audio mixes, such as 5.1 or 7.1 mixes, which often accompany Blu-ray Disc releases.
The most common variations are the different coloured vinyl. Indie record stores often offer a limited run of coloured vinyl. Sometimes, even picture discs, and in recent years, Zoetrope art and etched album sides. These are harder and more expensive to produce, so they are rarer, often limited runs, so more collectible.
Explanation to zoetrope vinyl
Coloured Vinyl sources
As just mentioned, artists and record labels have supported independent record stores by providing not only the standard black, but also coloured vinyl versions. This has expanded in recent years to having special colors being offered to fans through streaming services such as Spotify and artist websites.
Resident Music details for the new Turin Brakes album, vs the band’s (label-managed) website
Sadly, this approach has been adopted by some very successful artists to entice their loyal fans to buy multiple copies of the same album, with even Amazon getting its own special, colored vinyl. I personally feel Taylor Swift having more than 45 versions of one album is somewhat exploitative of her fan base.
Numbered Editions
We’ve mentioned that often, the colored vinyl runs will be limited. How limited it can vary, so when a release is listed as a limited edition, it is worth checking if a number of copies is identified. These releases will also have numbering printed and written onto them. How many in the run will influence that value? Some runs can be as many as 10,000. For a popular artist, it’s still relatively rare, but not for a smaller name. Others will be as low as 500 copies. So, consider the artist’s popularity when looking at the numbering.
Dinked Editions
In the U.K., a group of indie record stores have been working with smaller indie artists to release ‘Dinked Editions‘ of albums. These versions have been developed with the artists, and often have different album covers, additional tracks on a supplemental single, and will be numbered as part of a limited edition. These are usually numbered and have between 500 and 1000 copies.
Signed artwork
Artists signing the albums will always make the records more collectible. But, signing sleeves can be problematic (doing it once an album is packaged means a lot of weight has to be transferred around). Sign the sleeve before adding the record, as this may impact production. As a result, sadly, the signed piece is a separate art card. So a signed, genuine sleeve will always be more collectible.
Record Store Day / National Album Day
Record Store Days (RSDs) have been going for approaching 20 years. Started as a lifeline to help keep independent record stores stay alive when a lot of stores were closing down. RSD releases are usually limited runs, where just enough copies are produced to sell in stores on a specific date. RSD releases tend to go beyond just coloured vinyl to artists releasing ‘new’ (sometimes older but previously unreleased, remastered, or demo material).
While RSD releases are aimed at physical instore sale events, on the Monday evening after the RSD stores can then sell their RSD overstock online. Occasionally, you may find a store with an odd copy lingering well after the RSD event, but these are relatively rare.
So getting an RSD release involves a bit of luck and timing. Being willing to queue at a store will boost the chances of getting the desired RSD release. It does help in advance of the RSD day, the releases for the event are published, so you know in advance what to get.
RSDs normally take place on a Saturday in April and have become a bit of an event. So, if you’re not that interested in the music you’re buying for someone, you’re better off gambling on a store having it online on the following Monday at 8pm. Most indie stores have online sales channels (often this is how they survive during quiet times), so bookmark several to try.
Unlike RSD, National Album Day isn’t a global setup, although there are similarities National Album Day currently doesn’t carry the same impact.
Vinyl weight and Audiophile pressings
It is worth keeping an eye on the vinyl weight referenced. Good-quality releases are typically 180 g, although 140 g is not uncommon; standard releases can be as low as 100-120 g. The heavier the vinyl, the less susceptible it is to warping, and any surface scuffing is less likely to impact sound reproduction.
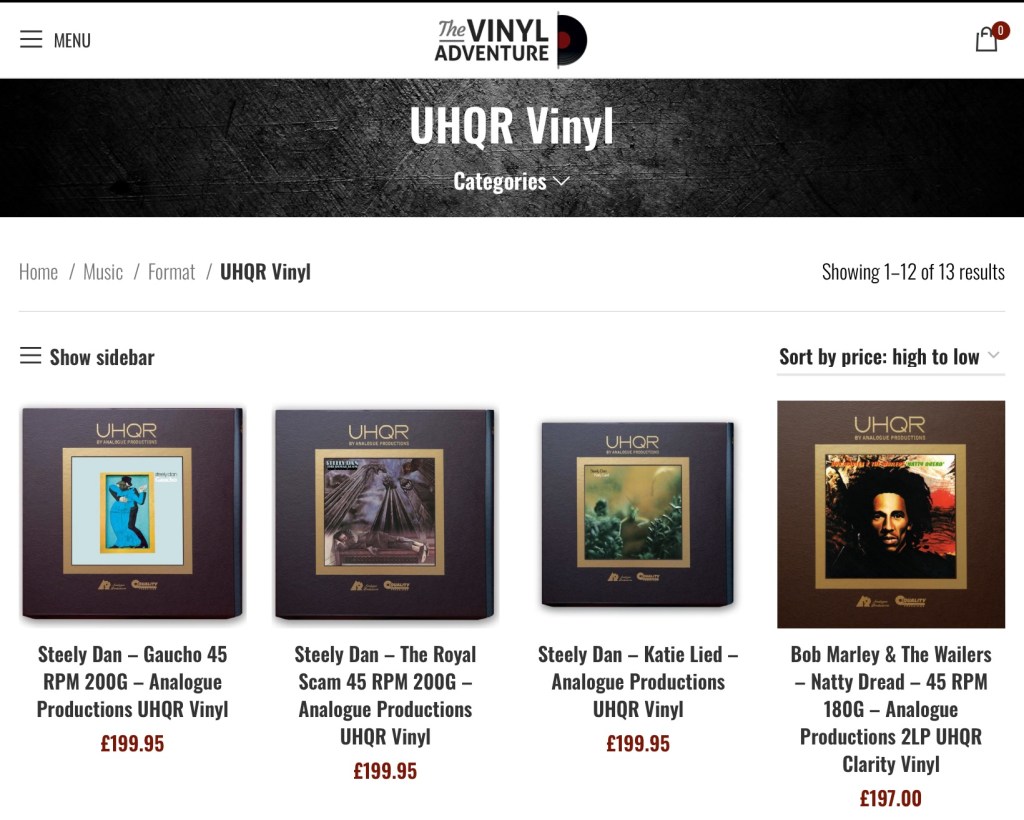
There is a correlation between vinyl weight and vinyl quality, with some specialist pressings over 180 g. These come from specialist companies such as Mobile Fidelity Sound Lab. These releases will also feature albums playing back at 45 RPM, as this effectively adds 50% more groove length to the recording. These releases can cost multiples of a standard release. Such purchases will pay off when used with an audiophile setup.
Box sets
Album box sets can be an attractive vinyl gift option, but can be rather expensive for the quantity of music that can be included. Not all box sets are published as Limited Editions, but in most cases, they can be considered so because the number of buyers prepared to spend hundreds of pounds on a small set of new actual material. For example, Rush R50 has 7 new previously recorded tracks with a 234.99 price tag.
The recovery of vinyl has also driven the bootleg market. Bootleg (sometimes referred to as Recordings Of Illegitimate Origin – ROIO) really took off with CDs, as the production costs are low, and even more with downloading. While downloading has dented the value of the market. What it doesn’t replace is the sleeves and artwork that can go into such releases.
When it comes to the legality of such recordings, some legal loopholes in the U.K. can give sufficient legitimacy to the releases, which is why they do show up in record stores.
There is an important consideration when buying bootlegs, which is the lineage of the recording. For example, a recording taken from an FM broadcast is transferred to a cheap cassette before being transferred to vinyl. Some labels, and bootleg series have a reputation for quality lineage, such as Transmission Impossible.
Sometimes, a bootleg recording of a specific performance is worth having, regardless of its quality. But to know this requires research and understanding of the performances and bootlegging labels.
Rare Vinyl
Like rare books, rare record buying can need an understanding of what is valuable and what is not. Many factors can influence value, factors such as:
Flawed productions or label printing,
Original pressings and pressings of the wrong version of an album (different mixes etc.).
Alternate sleeves, or where early releases had gatefold sleeves, but later changed to have a conventional sleeve.
Artists signing the sleeve.
First pressings of some albums.
In addition to these points, all the previous considerations, such as numbering, limited issues, coloured vinyl, etc., what is important is evidence of authenticity. Some details such as matrix codes etched in the vinyl, which can help identify specific versions (such information can be found on sites like Discogs).
However, there are some easy value propositions, such as pressed broadcasts like King Biscuit Flower Hour and BBC Top of the Pops, which had limited pressings made so that the vinyl copies could be distributed to regional radio stations.
Understanding the value and pricing becomes easier when you understand how second-hand vinyl is graded. The sleeves and vinyl are graded separately. Grading goes from mint (like new), near mint (NM), very-good (VG), excellent (Ex), and so on. Personally, I would focus on VG or better, except in some exceptional cases (a more precise definition can be seen here).
Finding Your Indie Store
As I’ve mentioned Indie record stores several times, the question becomes, where are they, how do I find them? Well, most cities these days will have an indie store, but they aren’t usually on the high street. You’ll need to find them. Of course, a LOT (not all) are also online. The easiest places to locate your nearest indie store are via:
We’ve covered a lot of possibilities here. However, this is far from exhaustive, and we will follow up with another post that explores other ideas, although not all of them involve vinyl.
I’ve been a long-time fan of mind maps, as a means to take notes while reading books, and to help organize thoughts and ideas in my day job. If you’ve explored the content of this blog, you’ll have seen I have a page of mind maps (here) covering various subjects. I’ve published them, as much to share them freely, as to provide a quick access back to them for myself.
For a long time, I’ve been using the excellent iThoughts tool from ToketaWare (great UX and works across multiple platforms – IOS, Mac, and Windows with support for cloud storage). Sadly, in 2023, iThoughts reached end-of-life. I had resisted moving tools for a long time as I couldn’t settle on a solution I liked that wasn’t crazy expensive and has bells and whistles I didn’t want. I finally settled on Wondershare’s EdrawMind which has all the core capabilities, with one additional feature I’d always wished for with iThoughts – interactive navigation of the maps online.
I’ve finally found the time to migrate a lot of my shared documents and add a couple I hadn’t shared. You can access and interact with the mindmaps I’ve migrated by clicking on the icon on the Mindmaps Index page.
With the announcement of Fluent Bit v4 at Kubecon Europe, we thought it worthwhile to take a look at what it means, aside from celebrating 10 years of Fluent Bit.
Firstly, normally using Semantic Versioning would suggest likely breaking (or incompatible changes to use SemVer wording) changes. The good news is that, like all the previous version changes for Fluent Bit the numbering change only reflects the arrival of major new features.
This is good news for me as the author of Logs and Telemetry with Fluent Bit, as it means the book remains entirely relevant. The book obviously won’t address the latest features, but we’ll try to cover those here as supplemental content.
Let’s reflect upon the new features, their benefits, and their implications.
More flexible support for TLS (v1.3, choosing ciphers to enable)
New language for custom plugins in the form of Zig
Security Improvements
While security for many is not something that will get most developers excited about, there are things here that will make a CSO (Chief Security Officer) smile. Any developer who knows implementing security behaviors because it is a good thing, rather than because you have been told to do it, makes a CSO happy, puts them in a good place, to be given some more lianency when there is a need to do something that would get the CSO hot under the collar. Given this, we can now win those points with CSOs by using new Fluent Bit configurations that control TLS versions (1.1 – 1.3) and ciphers to support in use.
But even more fundamental than that are the improvements around basic credentials management. Historically, credentials and tokens had to be explicit in a configuration file or referenced back to an environment variable. Now, such values can come from a file, and as a result, there is no explicitness in the configuration. File security can manage access and visibility of such details. This will also make credentials rotation a lot easier to implement.
Processor Improvements
The processor improvements are probably the most exciting changes. Processors allow us to introduce additional activities within the pipeline as part of a process such as an input, rather than requiring additional buffer fetch and return which we see in standard plugin operations.
Of course, the downside is that if the processor introduces a lot of effort, we can create unexpected problems, such as back pressure, for example, as a result of a processor working hard on an input.
The other factor that extending processors bring is that they are not supported in classic format, meaning that to exploit such formats, you do need to define your configuration using YAML. The only thing I’m not a fan of, is that the configuration for these features does make me think I’m having to read algorithms expressed with Backus Naur form (BNF).
Trace Sampling
Firstly, the processors supporting OpenTelemetry Tracing can now sample. This is probably Fluent Bit’s only weakness in the Open Telemetry domain until now. Sampling is essential here as traces can become significant as you track application executions through many spans. When combined with each new transaction creating a new trace, traces can become voluminous. To control this explosion on telemetry data, we want to sample traces, collecting a percentage of typical traces (performance, latency, no errors, etc) and the outliers, where tracing will show us where a process is suffering, e.g., an end-to-end process is slowing because of a bottleneck. We can dictate how the sampling is applied based on values of existing attributes, the trace status, status codes, latencies, the number of spans, etc.
Conditionality in Processors
Conditionality makes it easier to respond to aspects of logs. For example, only when the logging payload has several attributes with specific values do we want to filter the event out for more attention. For example, an application reporting that it is starting up, and logs are classified as representing an error – then we may want to add a tag to the event so it can be easily filtered and routed to the escalation process.
Plugins with Zig
The enablement of Zig for plugin development (input, output and filters) is strictly an experimental feature. The contributors are confident they have covered all the typical use cases. But the innate flexibility supporting a language always represents potential edge cases never considered and may require some additional work to address.
Let’s be honest: Zig isn’t a well-known language. So, let’s start by looking briefly at it and why the community has adopted it for custom plugin development as an alternative to the existing options with Lua and WASM.
So Zig has a number of characteristics that align with the Fluent Bit ethos better than Lua and WASM, specifically:
It is a compiled rather than interpreted language, meaning that we reduce the runtime overheads of an interpreter or JIT compiler such as Lua and the proxy layer of WASM. This aligns to be very fast/minimal compute overhead to do its job, – ideal for IoT and minimising the cost of side-care container deployments.
The footprint for the Zig executable is very, very small—smaller than even a C-generated binary! As with the previous point, this lends itself to common Fluent Bit deployments.
The language definition is formally defined, compact, and freely available. This means you should be able to take a tool chain from anyone, and it is easy for specialist chip vendors to provide compilers.
Based on those who have tried, cross-compiling is far easier to deal with than working with GCC, MSVC, etc. Making it a lot easier to develop with the benefits we want from Go. Unlike Go – to connect to the C binary of Fluent Bit doesn’t require the use of a translation layer.
One of Zig’s characteristics that differs from C is its stronger typing and its approach of, rather than prescribing how edge cases are handled, e.g., null pointers, working to prevent you from entering those conditions.
Zig has been around for a few years (the first pre-release was in 2017, and the first non-pre-release was in August 2023). This is long enough for the supporting tooling to be pretty well fleshed out with package management, important building blocks such as the HTTP server, etc.
While asking a large enterprise with more conservative approaches to development (particularly when IT is seen as an overhead, and source of risk rather than a differentiator/revenue generator) to consider adopting Zig could be challenging compared to adopting, say Go. The different potential values here, make for some interesting potential.
Not Only, but Also
While we have made some significant advancements, each Fluent Bit release brings a variety of improvements in its plugins. For example, working with it with eBPF, HTTP output supports more compression techniques, such as Snappy and ZSTD, and Exit having a configurable delay.
The Plus version of library dependencies is being updated to exploit new capabilities or ensure Fluent Bit isn’t using libraries with vulnerabilities.
The OpenAPI SpecificationOAS and its Open API Initiative (OAI)—the governing body—have been around for 10 years, and of course, OAS’s foundation, Swagger, has been around a lot longer. OpenAPI is very much a mature proposition. But the OAI community hasn’t stood still. Two standards have been developed, the first being Overlays and the latter being Arazzo.
Overlays
Overlays support the Arazzo specification. So let’s start there. It is a simple specification that describes how an OpenAPI definition can be extended, particularly for providing additional information about the API. While we don’t strictly need such a specification, as the OpenAPI spec provides the means to incorporate additional information, it doesn’t say how to best use the extension points to support use cases such as elaborating on the application.
This means an organisation could use an overlay to describe how internally particular APIs from mainly 3rd party APIs or standards can or should best be used. For example, if we built an API using GeoJSON for passing data describing no-fly zones (sometimes called prohibited airspace), the zone’s shape is easily expressed as a polygon or circle. However, no-fly zones can often have ceilings or base altitudes (consider the use of airspace for military low-altitude air training, which shouldn’t impact airliners at cruising altitude). GeoJSON can support this by attaching attributes to the shapes. What GeoJSON doesn’t describe is the name of the additional attributes. We can document this attribute using the overlay without refining the GeoJSON specification.
Simply put, an Overlay describes a structured way to add detail to an API without changing the original specification. Hopefully, we’ll see tooling to take the overlay detail, merge that content into the original specification, and generate enhanced API documentation.
This presents some interesting possibilities. With the rise of AI, we could potentially use it to provide a structured explanation to an LLM that can then take the additional information to generate the code needed to build functionality using a selected API, which could then be reused when an API is updated. While asking an LLM to generate code will not guarantee the same result (the result of reranking, ongoing training, etc), it is unlikely things will drift radically. This means any breaking changes in the API should be more easily absorbed.
Arazzo
Arazzo, takes the ability to define overlays to APIs a step further, as it leverages the OpenAPI overlay concept to define workflows that can be used to show how APIs can be orchestrated. This is hardly a new idea. Before RESTful APIs became dominant, we saw various standards complementary to WSDL, such as WS-BPEL (bringing BPEL together with WSDL). After open source solutions, which may have closer alignment to languages such as Apache Camel, they also provide the means to define orchestration of APIs that can be used in a language-agnostic manner.
Unlike OAS and Overlays, this standard is not being presented a contract, which will always need a specific way of being written to minimize ambiguity as it is effectively a contract between two or more parties (we even see this in the way contracts are drawn up, from NDAs to T&Cs and Liability disclaimers). It is being presented as a means to be illustrative of API use, where ambiguity can be tolerated (by being stateless, we have to accept some ambiguity in how people will use APIs and eliminate ambiguity through contractual clarity.
While Arrazo’s structure and schema are much easier to work with than BPEL, particularly if you’re comfortable with AOS, as the schema has a similar style and weaves OAS specifications as first-class citizens. My concern is that BPEL, and the more domain-specific orchestration definitions, while adopted by some more prominent organisations in the search for standardisation and consistency, never had a profound impact; most organizations ended up extending, tailoring it, or using the notation as a means to apply effective configuration management. Only time will tell whether Arazzo will make a profound impact. There are certainly some headwinds for Arazzo to overcome. Consider these …
The LLM domain is evolving so quickly that we aren’t too far away from mainstream tool vendors that have built or acquired companies like Poly API, which can document and integrate APIs using LLMs. We can also look at LangGraph’s work on developing AI agents’ ability to orchestrate tools such as APIs to solve complex problems. Remember that LangGraph was launched in January 2023, whereas the Arazzo committee was formed mid-2021.
If we can’t reach a point where natural language will be sufficient to see APIs orchestrated in a predictable manner, is it possible to describe sufficient information using structured English (language)? PlantUML and Mermaid diagrams provide sufficient structured English to achieve the goal, which is less sensitive to things like positioning and white space, such as YAML.
Personal wish
While I applaud Overlays as they allow me to add qualification to an existing API (contract), I would be happier if the OAI worked to find a way for the core OAS syntax to bring OAS and Async API (very possible as Async API makes use of a similar schema structure) without needing the additional complexity of the orchestration concepts in Arazzo. The North Star ideal would be a means to weave GraphQL capabilities into the notation without complexity, although, to be honest, this is a lot further apart, maybe too far apart today.
Today, we must use more advanced (often commercial) tools that combine the notations in a single tool or multiple plugins sourced from different places. These tools are not aligned and don’t offer a seamless experience, e.g., defining JSON structures that could work across multiple APIs.
's Blog")


 icon on the

You must be logged in to post a comment.