Development trends have shown a shift towards precompiled languages like Go and Rust away from interpreted or Just-In-Time (JIT) compiled languages like Java and Ruby as it removes the startup time of the language virtual machine and the JIT compiler as well as a smaller memory footprint. All desirable features when you’re scaling containerized solutions and percentage point savings can really add up.
Oracle has been leading the way with its work on GraalVM for some years now, and as a result, not only can GraalVM be used to produce native binary images from Java code, GraalVM also supports TuffleRuby and GraalPy, among others. As TruffleRuby is an open-source project, Oracle isn’t the only vendor contributing to it, work effort has also come from Shopify.
Helping Ruby move forward isn’t new for the Shopify engineering team, and part of that investment is that they have just announced the open-sourcing of a toolchain called Ruvy. Ruvy takes Ruby and creates a WebAssembly (WASM) from it the code. This builds on the existing project ruby.wasm. In doing so they’ve addressed the Ruby startup overhead of the language VM we mentioned. They have also simplified the process of deployment, eliminating the need for Web Assembly System Interface (WASI) arguments, and overcome constraints of class loading by reading files by having the code bundled within the assembly and then accessing the content using WASI-VFS, a simple virtual file system.
The published benchmarks show a massive performance boost in the process of executing where the Ruby code needs to be executed by the packaged JIT. For me, this is interesting as one of the related cloud-native trends is the shift from Fluentd to Fluent Bit. Fluentd was built with Ruby and has a huge portfolio of third-party extensions. But Fluent Bit is built using C to get those performance gains previously described. But it does support plugins through WASM. This raises an interesting question can we take existing Ruby plugins and wrap them so the required interfacing works – which should be minimal and more likely to be impacted by the fact Fluent Bit v2 has refined the internal data structure that was common to both Fluentd and Fluent Bit to allow Fluent Bit to more easily engaged with OpenTelemetry.
If the extra bit of wrapping code isn’t complex, then applying Ruvy should mean the core plugin can then work with Fluent Bit. If this can be templated, then Fluent Bit is going to make a big leap forward with the number of available plugins.
Infoworld published a rather clickbait incendiary new item the other week ‘few open source projects actively maintained’. Personally, I find these statements a little frustrating, as it would be easy for the less informed to assume that adopting open-source software is dangerous. There are several missed points here:
How well and frequently are close source solutions being maintained, and does that stop businesses from using end-of-life products? There is big business to be had in offering support to end-of-life solutions. Just look at companies like Rimini Street. Such organizations aren’t going to change software unless there is a major issue.
Not all open-source software is intended to be undergoing continuous maintenance? Shocking until you consider that open-source projects will remain open and available even when they have been declared end-of-life. Why? One of the things about open-source is you don’t know who is using the code, and suddenly pulling the code because the originator has decided they can no longer maintain their investment could put others in a difficult position. So, the right thing is to leave the source available and allow people to fork it so they can continue maintaining their own version of it or until they’ve migrated away. That way, the originator is not impacted by changes.
Next up, not all open-source projects need continued maintenance; many repositories exist to provide demo and sample solutions – so that developers can see how to use a product or service. These repositories shouldn’t need to change often. Frequent change could easily be a sign of an unstable product or service. These solutions may not be the most secure, as you don’t want to complicate the illustration with all the checks and balances that should be considered. Look at it this way: when we start learning a new language or tool, we start with the classic Hello World – which today means pointing your browser at a URL and seeing the words appear on the page. Do we insist that the initial implementation be secure? No, because it distracts from the basic message. For example, in my GitHub repository, I have multiple public repositories with Apache2 licenses attached to them – i.e., open-source. A number of them support the books I’ve written – they aren’t going to change – in fact, change would be a bad thing unless the associated book is corrected (this repo, for example).
When it comes to security vulnerabilities. This needs to be viewed with some intelligence. For several reasons:
As mentioned, our demo examples are unlikely to be patched with the latest versions of dependencies all the time. The point is to see how the code works. Unless the demo relates directly to something that has to be patched and that changes the demo itself. I don’t think it is unreasonable to expect developers to apply some intelligence to ensure dependencies (and therefore the risk of known vulnerabilities) are checked rather than blindly cutting and pasting. The majority of the time, such content will be published with a minimum version number, not a maximum.
Sometimes, a security vulnerability isn’t an issue. For example, I rarely run vulnerability checks on my LogSimulator. Not because I have a cavalier attitude to security but because I don’t expect it to ever be near a production environment, and the data flowing through the tool will be known and controlled by the user in advance of any activity. Secondly, it shouldn’t be using sensitive data, and thirdly, if there was any malicious intent intended, then I’d be more concerned about how secure its data source and configuration is. The tool is a command-line solution. That said, I still apply development practices that minimize potential exploitation.
Don’t get me wrong, there are risks with all software – closed and open-source, whether it is maintained or has security vulnerabilities. A software development team has a responsibility to make informed, risk-aware selections of software (open or closed source). If you have the means to check for risks, then they are best used. It is worth not only scanning our own code but also considering whether the dependencies we use have been scanned if appropriate (e.g. used in production). Utilizing innovations like SBOM, and exercising routine checks and reviews can also help.
While I can’t prove it, I suspect there are more risks being carried by organizations adopting a library that was considered sufficiently secure when downloaded, but subsequent vulnerabilities have been found, or selected mitigations to risks have been eroded over time.
when you’re testing apps, it is pretty common to want to send JSON via CURL to a local endpoint. The problem is that this usually means that the string you provide curl needs to have characters escaped, such as quote marks. By hand, this can be irritating to sort out, particularly if you’re using an IDE to make sure the JSON is correct. I’d concluded this is hardly a new problem; someone must have produced a nice little multiple-platform command line utility that can do it for you. The result was a bit more surprising.
There are plenty of online utils that solve it, but if you’re working with data, you don’t want to publicly share (or the fiddling around with copy-pasting to your browser). Nothing wrong with these tools, but you can’t script them without resorting to RPA (Robotic Process Automation) either. Here are a couple of services I found that are straightforward, and when I’ve tried them, not plagued by annoying ads.
But finding command line tools, well, finding an answer, has proven a bit more challenging. For removing escaped characters, you could use jq, but we actually want to go the other way to use curl with JSON that has been escaped. I have come across conversations covering the use of bash (making use of awk and sed. Plus, details about how the manipulation could be done in various languages (so you could code your own solution if so inclined. Coding is unlikely to take much effort, but testing permutations is going to demand effort).
The one solution I have found that meant I could escape (or reverse) JSON locally is a plugin for VS Code called appropriately JSON-escaper, which does what is needed in a nice and clean manner. All credit to Joshua Poehls for the tool.
The solution JSON-escaper built on top of a more generic JavaScript utility which addresses escaping special characters which can be found here.
Permissions on ssh key files on Windows can be rather annoying. If you try to use ssh it will protest about the permissions and will stop the secure connection. On Linux, it is easy to modify the permissions with a chmod command (chmod 700 *.key).
Update
Since originally writing this blog post, we came across a cmd (.bat) script that can alter the file permissions for Windows 10 and later (the basis of the script can be found here). With this script’s directory in the PATH variable, we can call it anywhere with the command protect-key.bat my-key-file.key, and it will correct the permissions accordingly.
We could solve this with custom integrations, or we can exploit an IETF standard called SCIM (System for Cross-domain Identity Management). The beauty of SCIM is that it brings a level of standardization to the mechanics of sharing personal identity information, addressing the fact that this data goes through a life cycle.
While Oracle’s IDCS and IAM support identity management for authentication and authorization for OCI and SaaS such as HCM, SCM, and so on. Most software ecosystems need more than that. If you have personalized custom applications or COTS or non-Oracle SaaS that need more than just authentication and need some of your people’s data needs to be replicated.
The lifecycle would include:
Creation of users.
Users move in and out of groups as their roles and responsibilities change.
User details change, reflecting life events such as changing names.
Users leave as they’re no longer employees, deleted their account for the service, or exercise their right to be forgotten.
It means any SCIM-compliant application can be connected to IDCS or IAM, and they’ll receive the relevant changes. Not only does it standardize the process of integrating it helps handle compliance needs such as ensuring data is correct in other applications, that data is not retained any longer than is needed (removal in IDCS can trigger the removal elsewhere through the SCIM interface). In effect we have the opportunity to achieve master data management around PII.
SCIM works through the use of standardized RESTful APIs. The payloads have a standardized set of definitions which allows for customized extension as well. The customization is a lot like how LDAP can accommodate additional data.
The value of SCIM is such that there are independent service providers who support and aid the configuration and management of SCIM to enable other applications.
Securing such data flows
As this is flowing data that is by its nature very sensitive, we need to maximize security. Risks that we should consider:
Malicious intent that results in the introduction of a fake SCIM client to egress data
Use of the SCIM interface to ingress the poisoning of data (use of SCIM means that poisoned data could then propagate to all the identity-connected systems).
Identity hijacking – manipulating an identity to gain further access.
There are several things that can be done to help secure the SCIM interfaces. This can include the use of an API Gateway to validate details such as the identity of the client and where the request originated from. We can look at the payload and validate it against the SCIM schema using an OCI Function.
We can block the use of operations by preventing the use of certain HTTP verbs and/or URLs for particular or all origins.
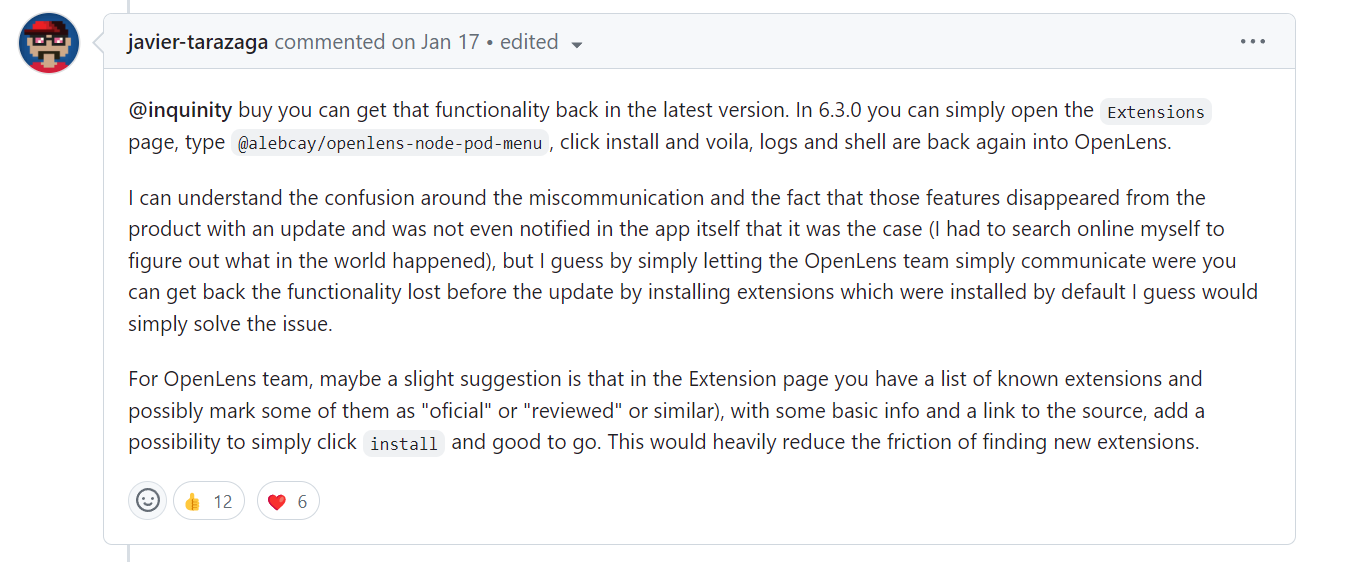
I wrote about how much I like the lens app K8s dashboard capability without needing to deploy K8s dashboard. Sadly recently, there has been some divergence from K8sLens being a pure open source to a licensed tool with an upstream open-source version called Open Lens (article here). It has fallen to individual contributors to maintain the open-lens binary (here) and made it available via Chocolatey and Brew. The downside is that one of the nice features of K8sLens has been removed – the ability to look at container logs. If you read the Git repo issue on this matter – you’ll see that a lot of people are not very happy about this.
If you read through all the commentary on the ticket, you’ll eventually find the following part of the post that describes how the feature can be reintroduced.
In short, if you use the extensions feature and provide the URL of the extension as @alebcay/openlens-node-pod-menu then the option will be reintroduced. The access to the extension is here:
I’m not sure why, but I did find the installation a little unstable, and needed to reinstall the plugin, restart OpenLens and reenable the plugin. But once we got past that, as you can see below the plugin delivered on its promise.
The problem with the licensing is that it doesn’t distinguish between me as an individual and using Lens for my own personal use vs. using Lens for commercial activities. The condition sets out:
ELIGIBILITY:You or your company have less than $10M in annual revenue or funding.
Given this wording, I can’t use the licensed version, even if I was working on an open-source project and in a personal capacity, as the company I’m employed by has more than $10 million in revenue. For me, the issue is $200 per year is a lot for something I only need to use intermittently. While I get k8slens includes additional features such as Lens Security which performs vulnerability management, and Lens Teamwork, along with support, are features and services that are oriented to commercial use – these are features I don’t actually want or need. Lens Kubernetes sounds like an interesting proposition (a built-in distribution of K8s), but when many others already provide this freely – from Docker Desktop to Kind it seems rather limited in value.
We did try installing Komodor, given its claims for an always free edition. But on my Windows 11 Pro (developer early access) installation, it failed to install, as you can see:
Outside of my Oracle cloud-related content, we’ve just published an article on DZone. Those who follow this blog will be familiar with the article theme as it relates to the Log Simulator work. We’ve also written for Devmio – although we don’t yet know when the article will be published and whether the content will be publicly available or behind their paid firewall.
The last week or so has been the DeveloperWeek 23 Conference – in Hybrid form, with the physical event last week and online this week. Circumstances prevented me from attending physically, but yesterday I was honored with the opportunity to present virtually. My session covered the adoption of API Streaming as an alternative approach to needing to poll with APIs to get the latest data state/updates.
One of the benefits of using cloud providers is the potential to scale solutions to meet demand by scaling out with additional compute nodes without concern for physical capacity limits (cost considerations are smaller, but still apply). Dynamic scaling is typically driven by monitoring defined groups of nodes for CPU use and when demand hits a threshold an additional node is spun up. Kubernetes can create some more nuanced scaling configurations but this is tends to be used for microservice style solutions.
This is well and fine, but if we need to finesse the configuration to ensure multiple container instances (such as microservices) can be allowed on a single node without compromising the deployment of containers across nodes of a cluster to provide resilience things can get a lot more challenging. We also want to manage the number of active containers – we don’t want to have unnecessary volumes of containers effectively idling. So how do we manage this?
In addition to this, what if we’re using services that demand tens of seconds or even minutes to be spun up to a point of readiness – such as instantiating database servers, adding new nodes to data caches such as Coherence which will need time to clone data, and adjust the demand balancing algorithms? Likewise, for more traditional application servers. Some service calls will impact upstream configuration changes, such as altering load-balancing configurations. Cloud-native Load Balancers typically can understand node groups, but what if your configuration is more nuanced? If you’re running services such as ActiveMQ you need to update all the impacted nodes in a cluster to be aware of the new node. Bottomline is some solutions or solution parts need lead time to handle increased demand?
This points to more advanced, nuanced metrics than simply current CPU load. And possibly the scaling algorithm needs to be aware of lead times of the different types of functionality involved. So how can we advance a more nuanced, and informed scaling logic? You could look at the inbound traffic on firewalls or load balancers. But this will require a fair bit of additional effort to apply application context. For example is the traffic just getting directed to static page content? We do need to derive some context so that the right rules are impacted. Even in simple K8s only hosted solutions a cluster may host services that aren’t related to the changes in demand and need to be scaled as a result.
A use case perspective
Let’s look at this from a hypothetical use case. We’re a music streaming service. Artists can control when their music is made available, but the industry norm is 12:01am on a Friday morning. There is always a demand spike at this time, but the size of the demand spike can vary, with some artists triggering larger spikes (this isn’t directly correlating to an artist’s popularity, some smaller groups can have very enthusiastic fans) – so dynamic scaling is needed, and reactive to demand. Reporting, analytics, and payment services see cyclical bumps around the monthly financial periods. These monthly cyclic activities can also be done during quieter operating hours. So it is clear we may wish to apply logical partitioning, but for maximum cost efficiency keep everything in the same cluster. There are correlations between different service demands. Certain data services see increased demand during the demand spikes and reporting period, but ‘The bottom line is we need to not only address dynamic scaling, but tailor the scaling to different services at different times.
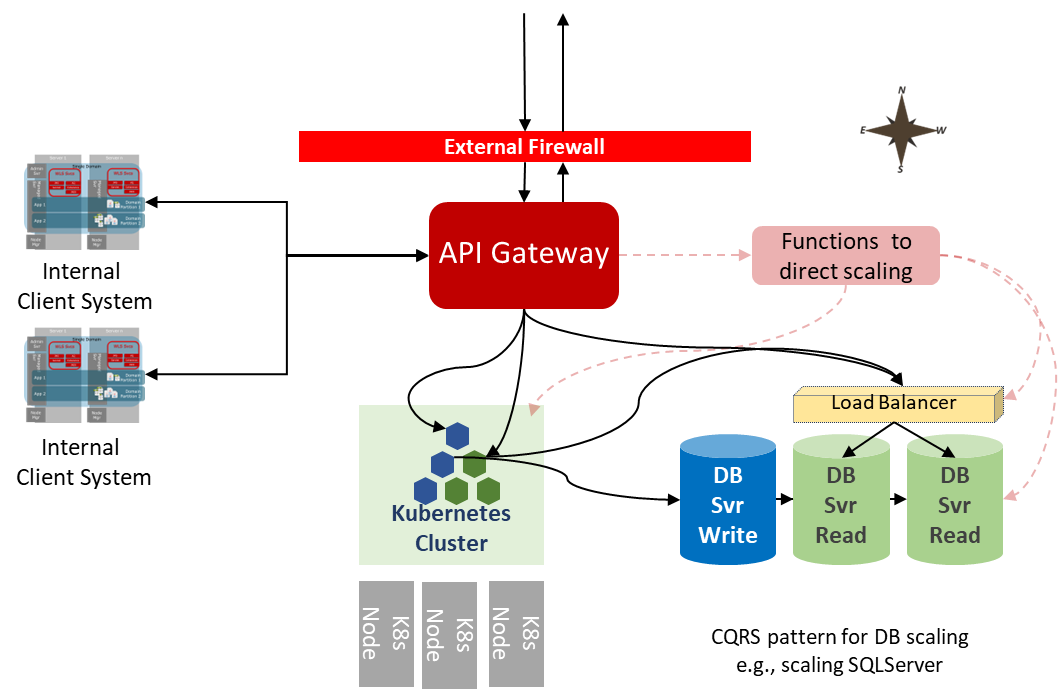
Back to our question – how do we manage the scaling? We could monitor the firewall and load balancer logs and analyze the kinds of requests being received. That would need additional processing logic to determine which services are receiving the traffic. But our API gateway is likely to have that intelligence implicitly in place as we have different API policies for the different types of endpoints. So we can monitor specific endpoints or groups of endpoints very easily – meaning we can infer the types of traffic demand and how to respond. Not only that, we may have API plans in place so we can control priority and prevent the free versions of our service from using APIs to initiate high-quality media streams. So we already have business and specific process meaning. So linking scaling controls such as KEDA (Kubernetes Event-driven Autoscaling) directly to measurements such as plans and specific APIs creates a relatively easy way to control scaling. Further, we may also use the gateways to provide a rate throttle so it’s not possible to crash our backend with an instantaneous spike. This strategy isn’t that different from an approach we’ve demonstrated for scaling message processing backends (see here and here).
Representation of how we can use the metrics from a gateway to not only support the scaling of a K8s cluster but also other cloud services
We can also use the data KEDA can see in terms of node readiness to adjust the API Gateway rate limiting dynamically as well. Either as a direct trigger from the number of active container instances or by triggering a more advanced check because we still have to address our services that need more lead time before relaxing the rate limiting.
Handling slow scaling services
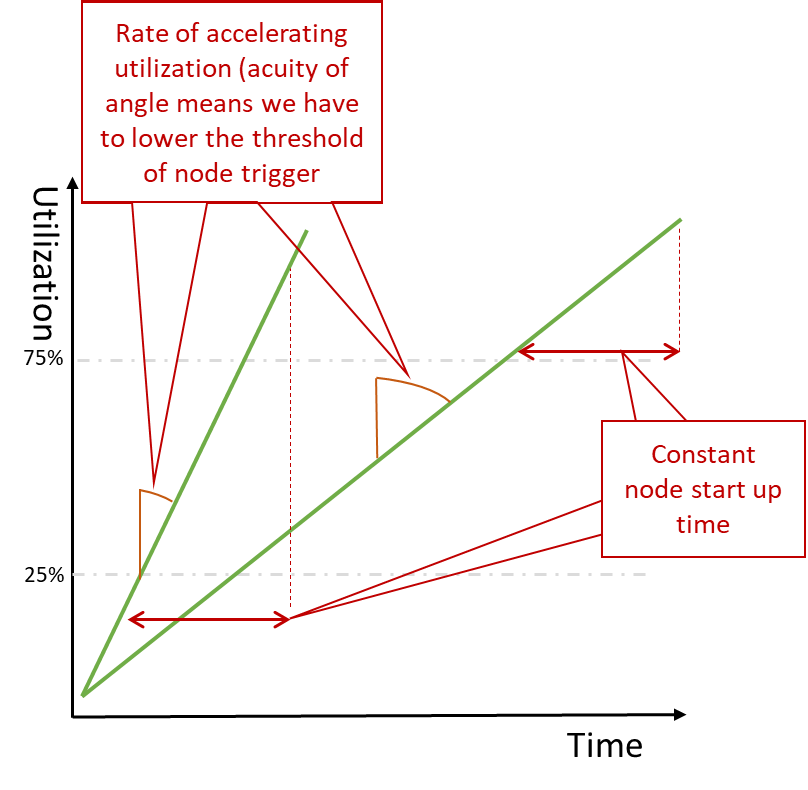
So we’ve got a way of targeting the scaling of services. But what do we do to address the slower scaling services we described? With the data dimensioned, we can do a couple of things. Firstly we can use the rate of change to determine how many nodes to add. A very sudden increase in demand and adding a node at a time will create the effect of the service performance stuttering as it scales, and all additional capacity is suddenly consumed and then scales again. Factoring in the rate of change to the workload threshold and the context of which services could generate the increased workload can be used to not only determine which databases may need scaling but also be used to adjust the threshold of workload that actually triggers the node introduction. So a sudden increase in demand on services that are known to create a lot of DB activity is then met with dropping the threshold that triggers new nodes from, say, 75% to 25% so we effectively start the nodes on a lower threshold, means the process is effectively started sooner.
With different rates of utilization growth, we can see that we need to alter the trigger threshold for launching new resources
For this to be fully effective we do need the Gateway tracking traffic both internally (East-West) and inbound (North-South). Using the gateway with East-West traffic means that we can establish an anti corruption layer.
Conclusion
Not all parts of a solution will be instantaneous in scaling – regardless of how fast the code startup cycle might be, some services have to address the need to move large chunks of data before becoming ready, e.g., in-memory databases. Some services may not have been built for the latest business demands and the ability to exploit cloud scale and dynamic scaling. Some services need time to adjust configurations.
We may also need to adjust our protection mechanisms if we’re protecting against service overloading.
Scaling capabilities that have response latency to the scaling process can be addressed by achieving earlier, more intelligent recognition of need than warning simply by CPU loads hitting a threshold. The intelligence that can be derived from implicit service context simplifies the effort in creating such intelligence and makes it easier to recognize the change. API Gateways, message queues, message streams, and shared data storage are all means that, by their nature, have implicit context.
Pushing the recognition towards the front of the process creates milliseconds or possibly seconds more warning of the demand than waiting for the impacted nodes to see compute spikes.
One area of API design that doesn’t get discussed much is the semantics of the payload. That is, the names we give our attributes and elements for the values being communicated. When developing single-use APIs (usually for client applications), this is unlikely to be an issue as the team(s) involved are likely to know each other and are able to interact and resolve clarity issues easily enough (although getting the semantics right makes this easier particularly in the long term). But when it comes to providing reusable endpoints, we may know the early adopters but are unlikely to interact with consumers beyond that unless there is a problem.
This makes getting the semantics right somewhat harder. How do we know if our early adopters represent the wider customer base (internally and externally)? Conversely, if we simply use our own company terminology, how do we know that it is representative of the wider user base? It isn’t unusual for organizations to develop their own variations of a term or apply assumed meaning. Even simple things, a ‘post code’ element of an address, other parts of the world use ‘zip codes’ or PINS are they the same? Perhaps if we said ‘postal code,’ we break the direct specific country associations with ‘post code.’ We can overcome these issues by providing a dictionary of meanings and lengthy explanations. Using the right term goes beyond simply understanding the data value; it will infer specific formatting and potential application behaviors. Taking our postcode/zip code example. In the UK data is published, which means it is possible to easily validate a postcode against the address line and vice versa. In fact, in the UK to get something delivered, you only need the property number and the postcode. A US 5-digit zipcode can’t do that. For that precision, the ZIP+4 needs to be used.
If we can address these issues, then life becomes easier for us in maintaining the information and for consumers in not needing to look up the details. The question is how can we be sure of using semantics that is consistent across our APIs and widely understood and, when necessary, already documented, so we don’t have to document the information again?
There is a shortcut to some of these problems. Many industries have agreed on data models for different industries. The bodies such as OASIS, OMG, and others are developed and maintained by multiple organizations. As a result, there is a commonality in the meaning achieved. So if you align with that meaning, then use that semantic. Not only can the naming of attributes become easier, but any documentation can be simplified to reference the published definitions. in most cases, these standards are publicly available as it promotes the widest adoption – one of the goals of developing such models. But there are some pitfalls to be mindful of using this approach:
Sometimes rather than arrive at a universal definition, the models will accommodate structural variations or aliased names – as a result, they may not necessarily be helpful to you.
The more well-known models are internationalized. If you have no intent to support international needs and not expecting to have international consumers, then the naming may not align with localized conventions.
If you use the semantics provided, ensure your data abides by the meaning. For example, don’t use ‘shipping address’ if you’re not shipping anything.
Don’t slavishly copy the data models provided – the model may not be intended for API use cases. At the same time, it doesn’t stop you from asking why the data in the model is there and whether your users may want such data (and whether it makes sense for you to provide that information).
Predefined APIs
Some organizations, such as TMForum have taken the public data model to the next step and provided predefined API specifications. This is ideal where you’re following industry standards and providing standardized/common services that aren’t a differentiator but need to be offered as part of doing business.
Data Catalogs
Larger, data-mature organizations will keep some form of Data Catalog. These catalogs are often held to help understand compliance needs, such as where personal data is held, how data issues can impact data accuracy and integrity, etc. It is possible that metadata may also be kept to address the semantic meaning of data or reference the definitions. Such information is used to help inform any data cleansing that may be needed. This offers a potentially good source of information for internal API use cases.
Vendor Led
If your business is delivery/service focussed so that your unique value isn’t in IT processes but perhaps something that the company manufactures or a specialist service such as consulting in a specific industry, then it is possible that the majority of your systems are SaaS or COTs based. If your business has opted to focus on a particular vendor, e.g., Oracle or SAP, for most services, then vendor-led data models are a possibility. These vendors are often involved with public data model development, so they won’t be too divergent in most situations – but awareness of differences is necessary, but as both models should be internally consistent, the differences will also be consistent. This approach will give you better alignment and reduce the chances of needing to address any divergence. The downside of this is a change of direction on strategic vendors can create additional work going forward as the alignment is disrupted. More work will be needed to map from your naming and semantics to the new core, and attempts to move away from the selected model to try to realign semantics with a new core will potentially create breaking changes for API consumers.
Don’t Forget
Regardless of the approach taken, there are some very simple but critical rules that will keep you in a good place:
Don’t use your underlying storage data models – this is a well-documented API anti-pattern.
Consistency of language across your APIs, regardless of whether they are internal or external, is important.
Information Sources
Regardless of approach – be careful not to lock your API semantics and data model to that of the storage layer – these can change and even create breaking changes that you shouldn’t expose to your users. Some sources to consider.
OAGIS – covers a broad variety of business data domains. Some ERP suppliers have used this as a foundation for their application data models.
's Blog")


You must be logged in to post a comment.