In addition, if you want to see the presentation and hear us discuss the solution and explain how it works, we recorded part of the presentation dry run, which can be heard here (Demo) and here (Code overview).
I couldn’t be in Paris in person, so Patrick took the job of presenting in Paris, we tried to enable my remote participation but had audio issues. Hopefully, you’ll see the recording of Pat’s physical presentation here. But I did manage to collaborate in the demo:
This means that the original repo I mentioned can be viewed as a beta or upstream version (it’s cluttered with some generated code from Helidon, which we will eventually get around to exploiting and making the utility a native binary executable).
When it comes to observability, particularly logs, and traces, there is a historical tendency to process things in a batch manner or even only once the need to determine the root cause of an outage, often only using something in the metrics to indicate something might not be right. This misses a real opportunity given Fluent Bit can capture observability events in near real-time, whether that is a log, metric, or trace indicating something unhealthy; why not present the issue to those performing an ops role as soon as it is recognized by Fluent Bit. Not once the data is processed by a back end?
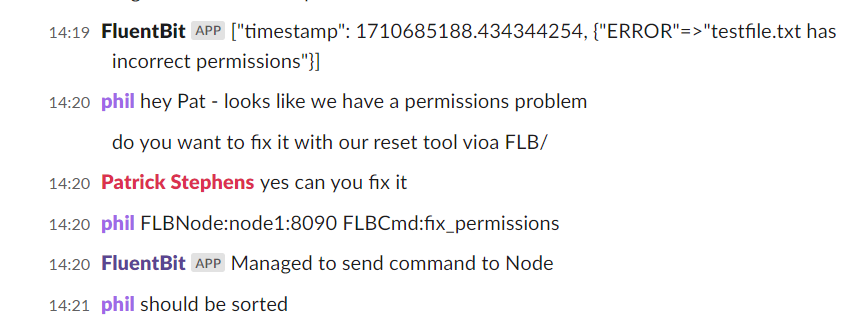
While we have solutions like PagerDuty, they tend to be integrated with back-end event analytics tools. Fluent Bit can talk to social channels such as Slack – so why not direct critical events to Slack and interact with the Ops team more directly. After all, if we’re told quickly about an imminent issue or as soon after something wrong occurs, the impact and effort involved in remediation and recovery are smaller. This is the basis of a presentation that Patrick Stephens (from Chronosphere and a committer to the Fluent Bit project) and I have put together. Patrick will be leading the session at the Cloud Native Rejekts conference in Paris (the ‘b side’ to Kube Con Europe), which takes place on the two days before Kubecon itself.
The session looks at the idea of what has been called ChatOps, why and how it can bring value, facilitated with a demo of using Fluent Bit to detect and share an event with Fluent Bit and also pick up and handle directions from the Ops team in the Slack channel.
We hope you’ll see from the session why we think the approach is worthy of consideration and how the potential security considerations can be mitigated. The MVP code is currently here but may, in due course, actually be migrated to the Fluent repos here.
We’ve bundled readme content and scripts to build and help test the additional functionality created to facilitate part of the operation.
We don’t want to spoil the presentation, so we won’t share too much. But it’ll also be worth checking with the blog, seeing as we’ll record a video and eventually record a session explaining the MVP’s ins and outs.
The hyper scaler cloud vendors all offer Logging and monitoring capabilities. But they tend to focus on supporting their native services. If you’re aware of Oracle’s Cloud (OCI) messaging, then you’ll know that there is a strong recognition of the importance of multi-cloud. This extends not only to connecting apps across clouds but also to be able to observe and manage cloud-spanning solutions. Ultimately, most organizations want to headline observability-related views of their solutions.
Late last year, I presented these ideas, illustrating the ideas with the use of Fluent Bit and OCI’s Observability and Management products to visualize and analyze what is happening. I finally found the time to write how the very basic demo was built from a clean sheet over on the Oracle Devs blog on Medium.
This also highlights the fact that the Fluent Bit book, while I believe, once completed, will be through, can’t cover everything – and certainly not build end-to-end use cases like the Oracle Observability & Management example. To help address this, the book includes an appendix of helpful additional information, some of which I have included here, along with other content that we encounter – all of which can be found at Fluentd & Fluent Bit Additional stuff.
One of the areas I present publicly is the use of Fluentd. including the use of distributed and multiple nodes. As many events have been virtual it has been easy to demo everything from my desktop – everything is set up so I can demo things very easily. While doing this all on one machine does point to how compact and efficient Fluentd is as I can run multiple instances concurrently it does undermine distributed capabilities somewhat.
Add to that I now work for Oracle it makes sense to use OCI resources. With that, I have been developing the scripts to configure Ubuntu VMs to set up the demo environments installing Ruby, Fluentd, and various gems needed and pulling the relevant configurations in. All the assets can be found in the GitHub repository https://github.com/mp3monster/logging-demos. The repository readme includes plenty of information as well.
While I’ve been putting this together using OCI, the fact that everything is based on Ubuntu should mean it can be run locally on VMs, WSL2, and adaptable for MacOS as well. The environment has been configured means you can still run on Ubuntu with a single node if desired.
Additional Log Destinations
As the demo will typically be run on OCI we can not only run the demo with a multinode setup, we have extended the setup with several inclusion files so we can utilize OCI services OpenSearch and OCI Log Analytics. If you don’t want to use these services simply replace the contents of several inclusion files including files with the contents of the dummy_inclusion.conf file provided.
Representation of the Demo setup
The configuration works by each destination having one or two inclusion files. The files with the postfix of label-inclusion.conf contains the configuration to direct traffic to the respective service with a configuration that will push log events at a very high frequency to the destination. The second inclusion file injects the duplication of log events to each service. The inclusion declarations in the main node Fluentd config file references an environment variable that should provide the path to the inclusion file to use. As a result, by changing the environment variable to point to a dummy file it becomes possible o configure out the use of one of the services. The two inclusions mean we can keep the store declarations compact and show multiple labels being used. With the OpenSearch setup, we have a variant of the inclusion file model where the route inclusion can reference the logic that we would use in the label directly within the sore declaration.
The best way to see the use of the inclusions is to experiment with setting the different environment variables to reference the different files and then using the Fluentd dry-run feature (more on this in the book).
Setup script
The setup script performs a number of tasks including:
Pulling from Git all the resources needed in terms of configuration files and folders
Retrieving the necessary plugins against the possibility of their use.
Setting up the various environment variables for:
Slack token
environment variables to reference inclusion files
shortcut environment variables and aliases
network (IP) address for external services such as OpenSearch
Setting up a folder for OCI tokens needed.
Setting up temp folders to be used by OCI Plugins as a file-based cache.
Feeding the log analytics service is a more complex process to set up as the feeds need to have metadata about the events being ingested. The downside is the configuration effort is greater, but the payback is that it becomes easier to extract meaningful information quickly because the service has a greater understanding of the content. For example, attributing the logs to a type of source means the predefined or default log formats are immediately understood, and maximum meaning can be retrieved from the log event.
Going to OCI Log Analytics does cut out the need for the Connections hub, which would allow rules and routing to be defined to different OCI services which functionally can help such as directing log events to PagerDuty.
Whilst the weather may have put some off venturing out, not for our intrepid duo of presenters – Joost Volker (Oracle PM for a Blockchain) and Robert van Mölken Oracle Groundbreaker Ambassador and author of Blockchain Across a Oracle who both had to negotiate protesting farmers, traffic jams, flight delays (wrong kind of rain to land in London) and London’s rush hour traffic.
's Blog")


 Whilst the weather may have put some off venturing out, not for our intrepid duo of presenters –
You must be logged in to post a comment.