The hyper scaler cloud vendors all offer Logging and monitoring capabilities. But they tend to focus on supporting their native services. If you’re aware of Oracle’s Cloud (OCI) messaging, then you’ll know that there is a strong recognition of the importance of multi-cloud. This extends not only to connecting apps across clouds but also to be able to observe and manage cloud-spanning solutions. Ultimately, most organizations want to headline observability-related views of their solutions.
Late last year, I presented these ideas, illustrating the ideas with the use of Fluent Bit and OCI’s Observability and Management products to visualize and analyze what is happening. I finally found the time to write how the very basic demo was built from a clean sheet over on the Oracle Devs blog on Medium.
This also highlights the fact that the Fluent Bit book, while I believe, once completed, will be through, can’t cover everything – and certainly not build end-to-end use cases like the Oracle Observability & Management example. To help address this, the book includes an appendix of helpful additional information, some of which I have included here, along with other content that we encounter – all of which can be found at Fluentd & Fluent Bit Additional stuff.
With the Christmas holidays happening, things slowed down enough to sit and catch up on some reading – which included reading Cloud Observability in Action by Michael Hausenblas from Manning. You could ask – why would I read a book about a domain you’ve written about (Logging In Action with Fluentd) and have an active book in development (Fluent Bit with Kubernetes)? The truth is, it’s good to see what others are saying on the subject, not to mention it is worth confirming I’m not overlapping/duplicating content. So what did I find?
Cloud Observability in Action by Michael Hausenblas
Cloud Observability In Action has been an easygoing and enjoyable read. Tech books can sometimes get a bit heavy going or dry, not the case here. Firstly, Michael went back to first principles, making the difference between Observability and monitoring – something that often gets muddied (and I’ve been guilty of this, as the latter is a subset of the former). Observability doesn’t roll off the tongue as smoothly as monitoring (although I rather like the trend of using O11y). This distinction, while helpful, particularly if you’re still finding your feet in this space, is good. What is more important is stepping back and asking what should we be observing and why we need to observe it. Plus, one of my pet points when presenting on the subject – we all have different observability needs – as a developer, an ops person, security, or auditors.
Next is Michael’s interesting take on how much O11y code is enough. Historically, I’ve taken the perspective – that enough is a factor of code complexity. More complex code – warrants more O11y or logging as this is where bugs are most likely to manifest themselves; secondly, I’ve looked at transaction and service boundaries. The problem is this approach can sometimes generate chatty code. I’ve certainly had to deal with chatty apps, and had to filter out the wheat from the chaff. So Michael’s approach of cost/benefit and measuring this using his B2I ratio (how much code is addressing the business problems over how much is instrumentation) was a really fresh perspective and presented in a very practical manner, with warnings about using such a measure too rigidly. It’s a really good perspective as well if you’re working on hyperscaling solutions where a couple of percentage point improvements can save tens of thousands of dollars. Pretty good going, and we’re only a couple of chapters into the book.
The book gets into the underlying ideas and concepts that inform OpenTelemetry, such as traces and spans, metrics, and how these relate to Observability. Some of the classic mistakes are called out, such as dimensioning metrics with high cardinality and why this will present real headaches for you.
As the data is understood, particularly metrics you can start to think about how to identify what normal is, what is abnormal, or an outlier. That then leads to developing Service Level Objectives (SLOs), such as an acceptable level of latency in the solution or how many errors can be tolerated.
The book isn’t all theory. The ideas are illustrated with small Go applications, which are instrumented, and the generated metrics, traces, and logs. Rather than using a technology such as Fluentd or Fluent Bit, Michael starts by keeping things simple and directly connecting the gathering of the metrics into tools such as Prometheus, Zipkin, Jaeger, and so on. In later chapters, the complexity of agents, aggregators, and collectors is addressed. Then, the choices and considerations for different backend solutions from cloud vendor-provided services such as OpenSearch, ElasticSearch, Splunk, Instana and so on. Then, the front-end visualization of the data is explored with tools such as Grafana, Kibana, cloud-provided tools, and so on.
As the book progresses, the chapters drill down into more detail, such as the differences and approaches for measuring containerized solutions vs. serverless implementations such as Lambda and the kinds of measures you may want. The book isn’t tied to technologies typically associated with modern Cloud Native solutions, but more traditional things like relational databases are taken into account.
The closing chapters address questions such as how to address alerting, incident management, and implementing SLOs. How to use these techniques and tools can help inform the development processes, not just production.
So I would recommend the book, if you’re trying to understand Observability (regardless of a cloud solution or not). If you’re trying to advance from the more traditional logging to a fuller capability, then this book is a great guide, showing what, why, and how to evaluate the value of doing so.
To come back to my opening question. The books have small points of overlap, but this is no bad thing, as it helps show how the different viewpoints intersect. I would actually say that the Observability in Action shows how the wider landscape fits together, the underlying value propositions that can help make the case for implementing a full observability solution. Then, Logging in Action and the new book, Fluent Bit with Kubernetes, give you some of the common context, and we drill into the details of how and what can be done with Fluent Bit and Fluentd. All Manning needs now is content to deep dive into Prometheus, Grafana, Jaeger, and OpenSearch to provide an end-to-end coverage of first principles to the art of the possible in Observability.
I also have to thank Michael for pointing his readers and sections of Logging in Action that directly relate and provide further depth into an area.
We’ve just had a new article published for Software Engineering Daily which looks at monitoring in multi-cloud and hybrid use cases and highlights some strategies that can help support the single pane of glass by exploiting features in tools such as Fluentd and Fluentbit that perhaps aren’t fully appreciated. Check it out …
Getting to grips with FluentD configuration which describes how to handle logging event(s) it has to process can be a little odd (at least in my opinion) until you appreciate a couple of foundation points, at which point things start to click, and then you’ll find it pretty easy to understand.
It would be hugely helpful if the online documentation provided some of the points I’ll highlight upfront rather than throwing you into a simple example, which tells you about the configuration but doesn’t elaborate as deeply as may be worthwhile. Of course, that viewpoint may be born from the fact I have reviewed so many books I’ve come to expect things a certain way.
But before I highlight what I think are the key points of understanding, let me make the case getting to grips with FluentD.
Why master FluentD?
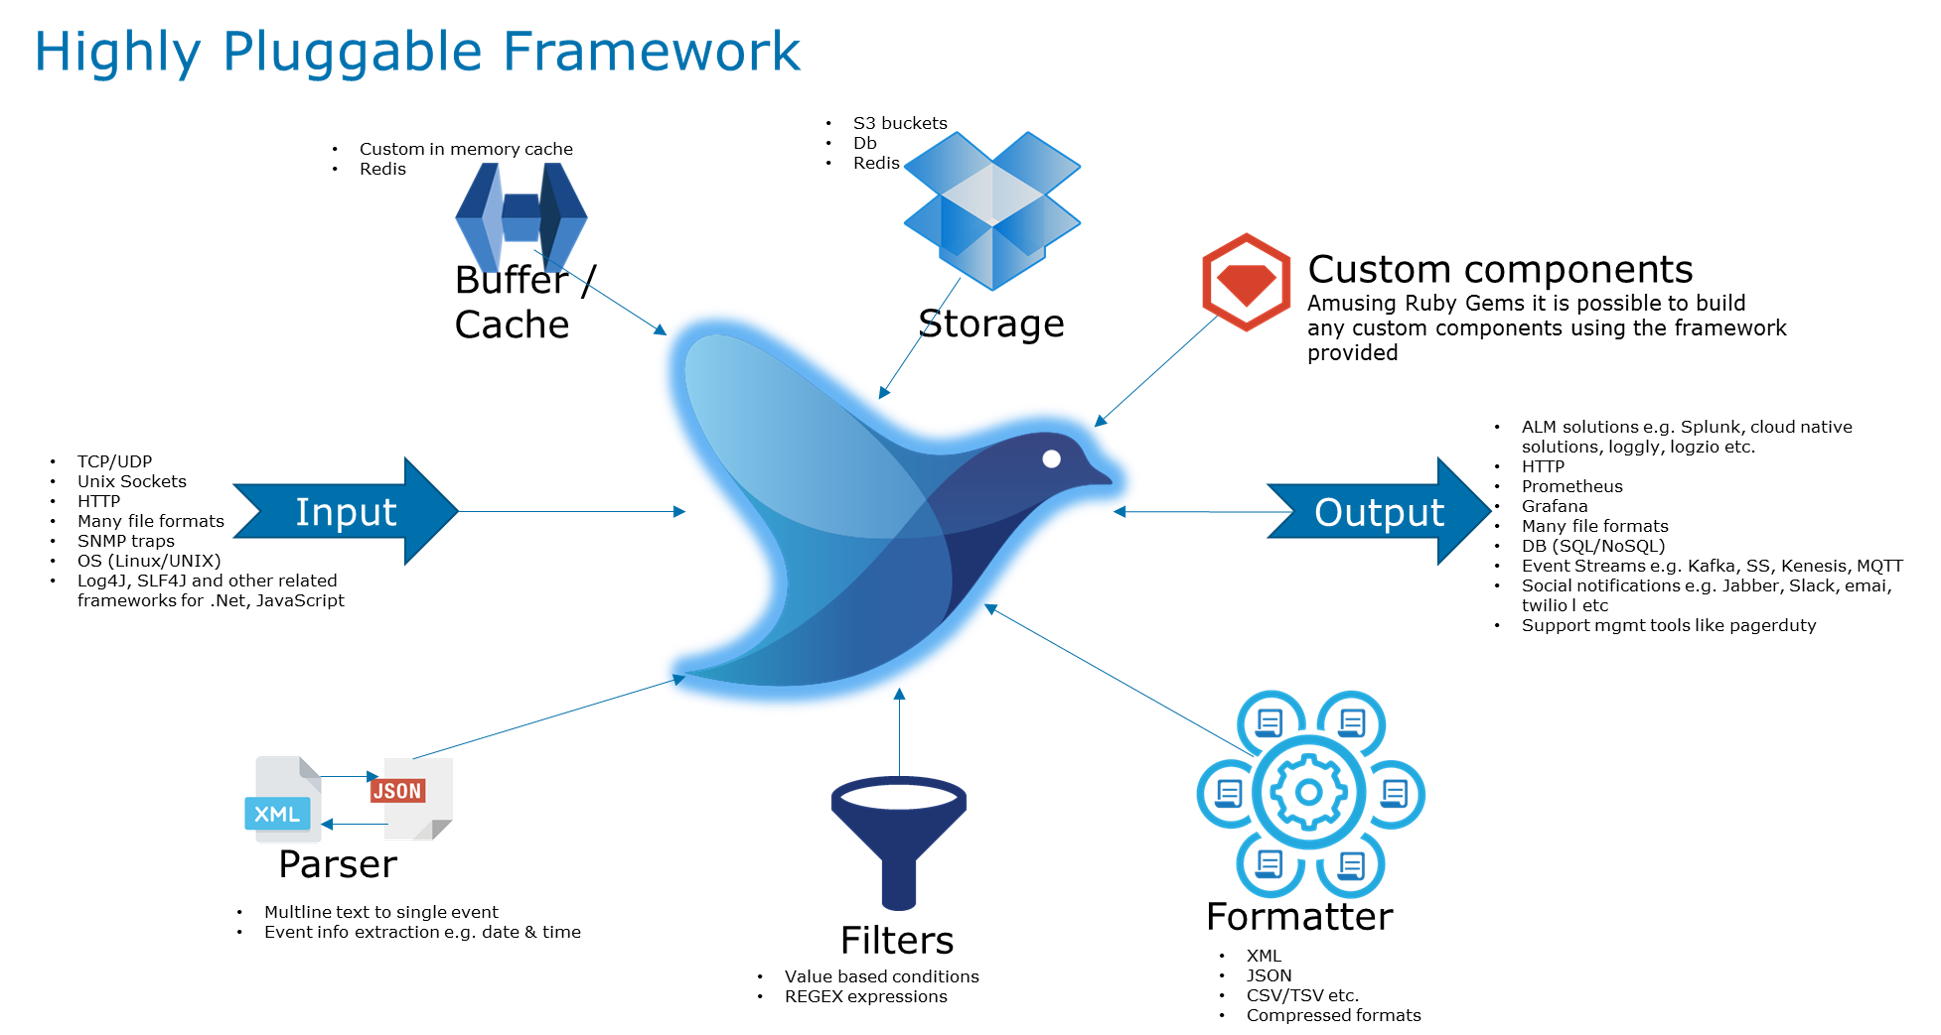
FluentD’s purpose is to allow you to take log events from many resources and filter, transform and route logging events to the necessary endpoints. Whilst is forms part of a standard Kubernetes deployment (such as that provided by Oracle and Azure for example) it can also support monolithic environments just as easily with connections working with common log formats and frameworks. You could view it as effectively a lightweight (particularly if you use FluentBit variant which is effectively a pared-back implementation) middleware for logging.
If this isn’t sufficient to convince you, if Google searches are a reflection of adoption, then my previous post reflecting upon Observability -London Oracle Developer Meetup shows a plot reflecting the steady growth. This is before taking into account that a number of cloud vendors have wrapped Fluentd/fluentbit into their wider capabilities such as Google (see here).
Not only can you see it as middleware for logging it can also have custom processes and adapters built through the use of Ruby Gems, making it very extensible.
Last night was the London Oracle Developer Meetup’s sessions around observability. Andrei Cioaca with a focus on the use of OpenTracing as provided by Jaeger, in a standard Kubernetes deployment with Istio – realized with Oracle Kubernetes Engine (OKE). This was followed by my session on another pillar using logging via FluentD. Also incorporated into standard Kubernetes, but also able to support traditional monolithic use cases.
Andrei provided a great overview of the 3 pillars and the strengths and weaknesses of the different pillars. With the basics covered Andrei then dove into the configuration and execution of Istio combined with Jaeger and the corresponding insights available. including a look at the kinds of visual insights that Jaeger and Kiali provide. Some probing conversations followed about the relationship to Spring Cloud Sleuth, Open Zipkin and the OpenTracing as a concept more generally.
Andrei’s presentation material can be found in his GitHub repository here.
Google Analytics on Search Terms
My session followed a pizza break, as there was a delay in its arrival. With everybody having chatted over pizza about OpenTracing, we picked up on FluentD and the Logging aspect to Observability. FluentD, as an open-source project has been growing steadily, and actually baked into several Log Analytics products and services – as the above analytics from Google shows.
The presentation looked at the growing challenges of modern software in terms of making sense of logging. We explored the capabilities of FluentD before drilling into real-world use cases and potential deployment models.
As you’ll see from the slides we ran a couple of demos. The configuration for the demos can be found at https://github.com/mp3monster/fluentd-demos along with an example payload.



 Last night was the London Oracle Developer Meetup’s sessions around observability.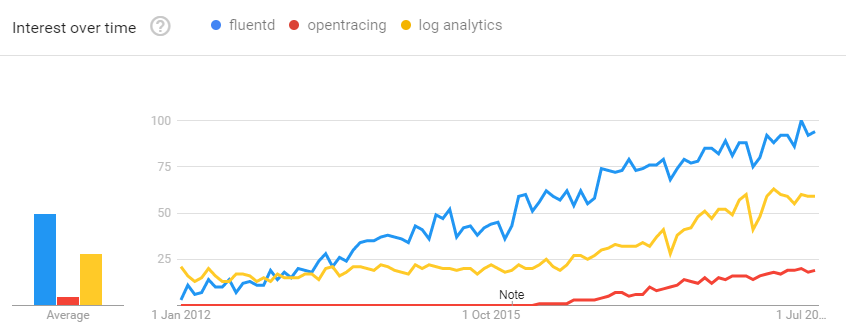


You must be logged in to post a comment.