Last week saw the Open Source Observability Day (OSOD) during which I presented on the subject of the Open Agent Management Protocol, covering the underlying protocol that forms the foundation of a wider capability we have been building along with a demo of what is available.
If you want to see the presentation, and hear the full story not only of the core protocol but how it can help with the ideas around ChatOps and AIOps head over to the OSOD website (and previous years can be seen on YouTube with playlists for each year e.g. OSOD 2025). Of course if you have been following my blog posts you’ll know this.
The demo is recorded against a version prior to the 0.6 release.
Running the demo yourself
If you want to try this out for yourself, you can do so. You’ll need to:
There are several things that separate the turn-key/commercial observability solutions from the pure open source options. The most visible of these are:
Fleet management of you agents, particularly when working outside of a Kubernetes ecosystem
Deployed services and applications with default monitoring configuration
Prebuilt dashboards
While the issue of fleet management is a subject I’ve covered at length with OpAMP. We’ve not looked so closely at the discovery and automation. While the OpAMP server (and standalone option) provides schema driven editor, the key separation is to drive the configuration based on finding what solutions are deployed.
This process can look very sophisticated, but there are a number of open source tools that can help address it pretty easily. By bringing therse tools together we can achieve the same effect of detect and configure agents. At this stage we’re not looking at the backend of creating out of the box dashboards, but the potential to evolve the approach is there.
Detecting and Generating Configuration
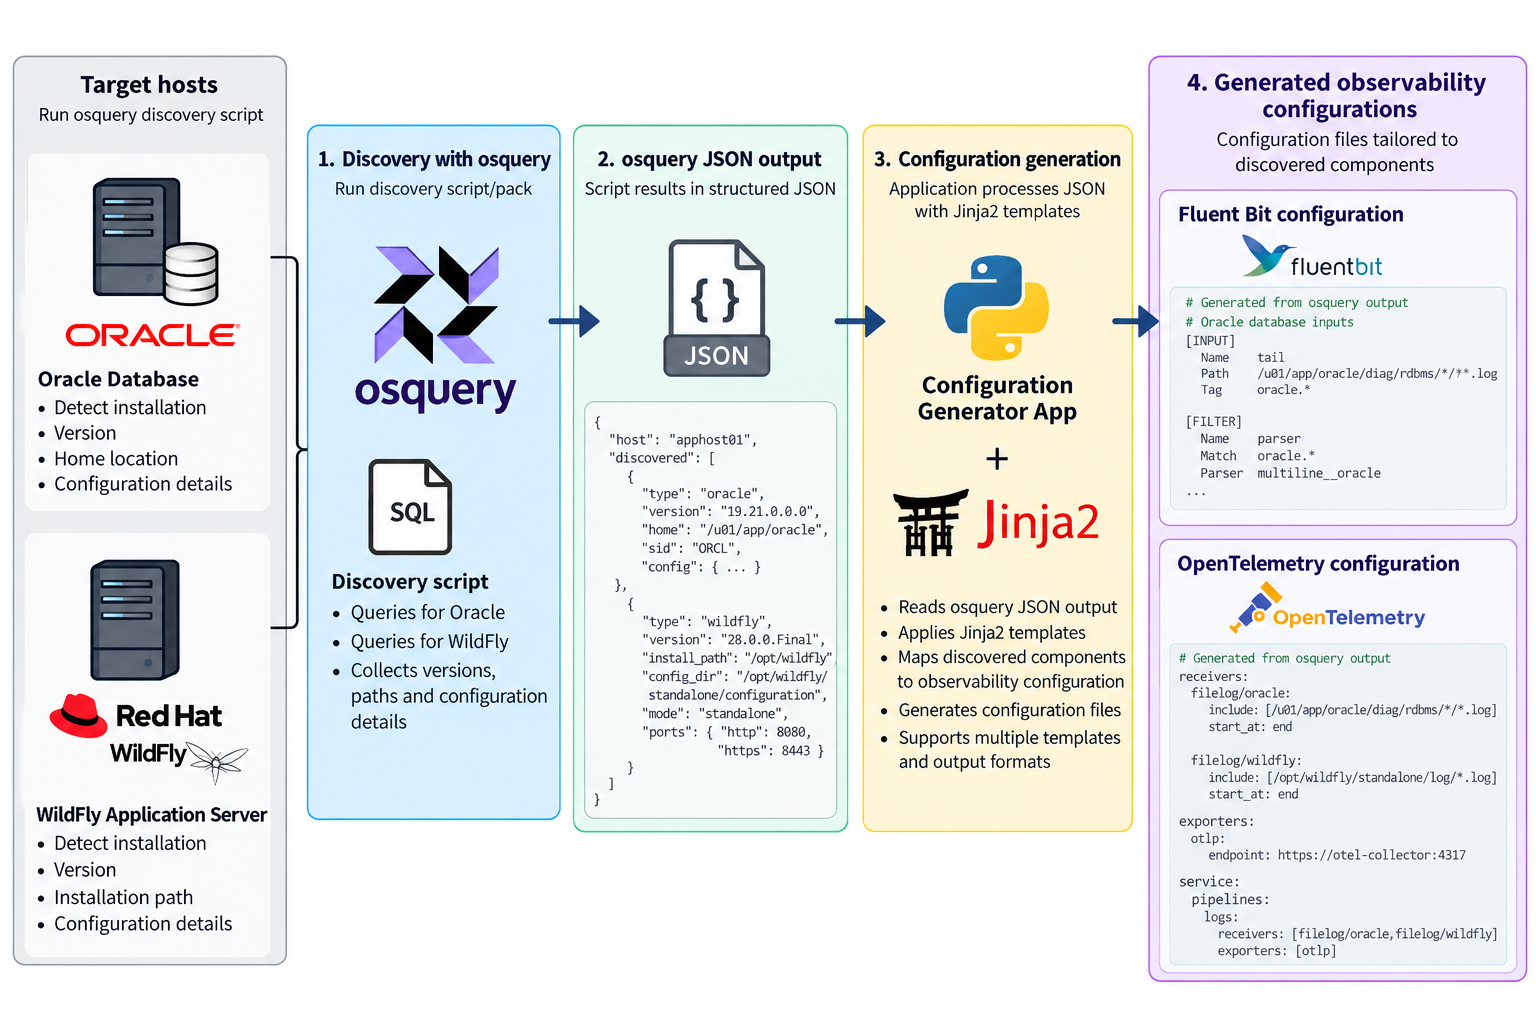
The process we need has the following steps:
find the deployed solution(s)
Understand how they are deployed
Generate a configuration based on the detection
Push the configuration out to agents
Detect and capture config
One of the more active solutions that provides a means to detect deployments, and find configurations in this space is OSQuery, which is used by some serious players (Airbnb, Dropbox, Netflix, Palantir, Etsy, and Uber are just a few). OSQuery is particularly appealing solution because of its ease of use. All the information OSQuery can make available is accessible through the use of SQL including all the power SQL provides to mix data together.
While SQL is powerful, we do want to return the results in an easily consumable manner, so the CLI tool allows us to ask for the result to be returned in JSON. This makes the result easy to work with and we can use it with technologies such as JSONPath, particularly if we can impose a defined schema on the output, something that can be done as we know the queries being run, and can use constructs such as select … as …
As we can query the JSON output to retrieve the relevant parts of the output, for example the result of the queries to look for an Oracle Database or a RedHat/IBM WildFly application server. We can then combine that data with a template, such as the templating capabilities of Jinja2. The template defines the configuration that we would want to use, for example we want to tail log files, we want to establish a Prometheus metrics pull. Then the values are pulled from the JSON to create an instance of the file.
Templates make the result reusable
By using templates, known queries and their result structures we can generate reusable configurations on a product by product basis. The last step is stitching it together. To be reusable each template is discrete for an application or standard stack. So we up with multiple configuration files that need to be combined. This could be addressed by simply merging all the files together, but a lot of the observability tools such as Fluent Bit and Fluentd provide the ability to include files. Obviously you still need to work out what to include to combine, but this pretty straight forward.
There are limits
So this brings together all the sources, for destination side for the turn key solutions is known as the backend is the core product. In the open source solution you’re probably going to run multiple tools, so you need to have a more advanced routing. You can create a standard backend routing and include it.
Convenience as a weakness?
While having turn-key solutions, makes setup so much easier, could it also be a weakness? As we can see with our automation, we’ve not got tailoring to filter data in the pipeline, or park it out of the way. Which ratchets up the costs, because of the retention costs, and greater computational effort to trawl the data. Nor can we derive new signals through correlation inflight. But then our approach with templating creates the same challenge, BUT this approach doesn’t preclude you from incorporating into the solution such smarts.
Backend Bootstrapping
Rapid configuration of the backend is going to be a bit harder because the chances are you’re wanting to mix and match the backend tools (one of the strengths of not going down a turnkey adoption). We’ll explore the possibilities of making this step easier in another post.
The hyper scaler cloud vendors all offer Logging and monitoring capabilities. But they tend to focus on supporting their native services. If you’re aware of Oracle’s Cloud (OCI) messaging, then you’ll know that there is a strong recognition of the importance of multi-cloud. This extends not only to connecting apps across clouds but also to be able to observe and manage cloud-spanning solutions. Ultimately, most organizations want to headline observability-related views of their solutions.
Late last year, I presented these ideas, illustrating the ideas with the use of Fluent Bit and OCI’s Observability and Management products to visualize and analyze what is happening. I finally found the time to write how the very basic demo was built from a clean sheet over on the Oracle Devs blog on Medium.
This also highlights the fact that the Fluent Bit book, while I believe, once completed, will be through, can’t cover everything – and certainly not build end-to-end use cases like the Oracle Observability & Management example. To help address this, the book includes an appendix of helpful additional information, some of which I have included here, along with other content that we encounter – all of which can be found at Fluentd & Fluent Bit Additional stuff.
We’ve just had a new article published for Software Engineering Daily which looks at monitoring in multi-cloud and hybrid use cases and highlights some strategies that can help support the single pane of glass by exploiting features in tools such as Fluentd and Fluentbit that perhaps aren’t fully appreciated. Check it out …
Fluentd has an incredible catalogue of plugins including notification and collaboration channels from good old-fashioned email through to slack, teams, and others.
The thing to remember if you use these channels is that if you’re sending errors, from application logs it isn’t unusual for there to be multiple error events as a root event can cause a cascade of related issues. For example, if your code is writing transactions to a database and the database goes down with no failover mechanism, then your code will most likely experience an error, roll back the transaction perhaps to some sort of queue, and then try to process the next event. Which will again fail. This is the classic situation where multiple errors will get reported for the same issue. This problem is often referred to as a mail storm given that there was a time when we didn’t have social collaboration tools and everyone used email.
There are several ways to overcome this problem. But the most simple and elegant of these is using the suppress plugin in its filter mode.
<filter **>
  @type suppress
  interval 60       # period in seconds when the condition to supress is triggered
  num 2             # number of occurences of a value before suppressing
  attr_keys source  # the element of the event to consider.
</filter>
In this example if we encounter an event with an attribute called source containing the same value twice then the suppression will kick in for 60 seconds. If you want the key to the valuebeing checked to be the tag then simply omit the attr_keys parameter.
Of course, we don’t want the suppression to kick in if the same value in the attribute keys occured once every few hours. To address this the occurence count is applied over not a time period, but a number of events received by the configuration of max_slot_num which defaults to 10k, but resets
In the filter mode, this plugin is best positionbed immediately before the match block. This means we don’t accidentally suppress messages before they are routed anywhere else.
For the purposes of a demo this is less of an issue. But for a realworld use case would probably benefit from some tuning. All the documentation for this plugin is at https://github.com/fujiwara/fluent-plugin-suppress
Opening of the blog post on blogs.oracle.commy Author Profile on blogs.oracle.com
World Festival Conference
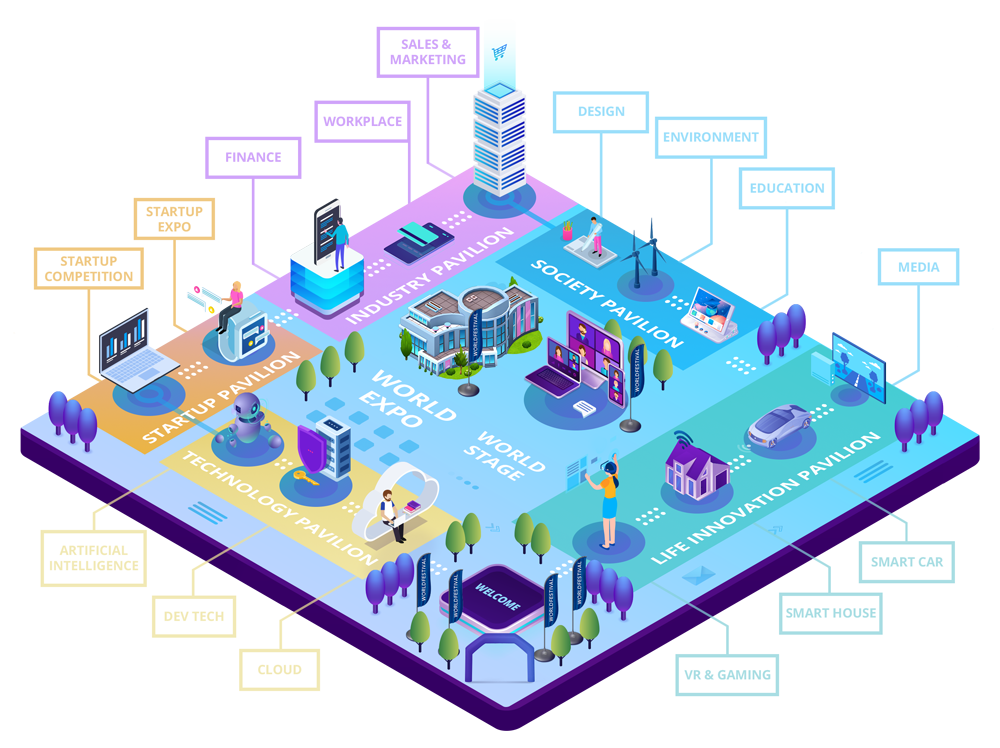
We’ve also scored another success, this time we’ve been invited to speak at WorldFestival in August, this is an online conference organized by the same team behind DeveloperWeek. This is the first time outside of an Oracle linked event where I’ve been amongst the first few named speakers, so proud of that. The conference looks really interesting as it looks beyond just core developer themes with conference tracks on Space & Transportation, Smart Cities, Robotics, Digital Health to name a few of the 12 streams. Worth checking out.
Fluentd is both an open source solution for making log management so much easier to work with, particularly for distributed / multi component solutions. But not only that it is supported by many log analytics tools, and central to several cloud vendors log management services.
The goal of the book is to explain how Fluentd can help us and to use the tool. We can’t cover every possible plugin, so we walk through the use of enough plugins and the way features interact you can extrapolate to other plugins.
Getting to grips with FluentD configuration which describes how to handle logging event(s) it has to process can be a little odd (at least in my opinion) until you appreciate a couple of foundation points, at which point things start to click, and then you’ll find it pretty easy to understand.
It would be hugely helpful if the online documentation provided some of the points I’ll highlight upfront rather than throwing you into a simple example, which tells you about the configuration but doesn’t elaborate as deeply as may be worthwhile. Of course, that viewpoint may be born from the fact I have reviewed so many books I’ve come to expect things a certain way.
But before I highlight what I think are the key points of understanding, let me make the case getting to grips with FluentD.
Why master FluentD?
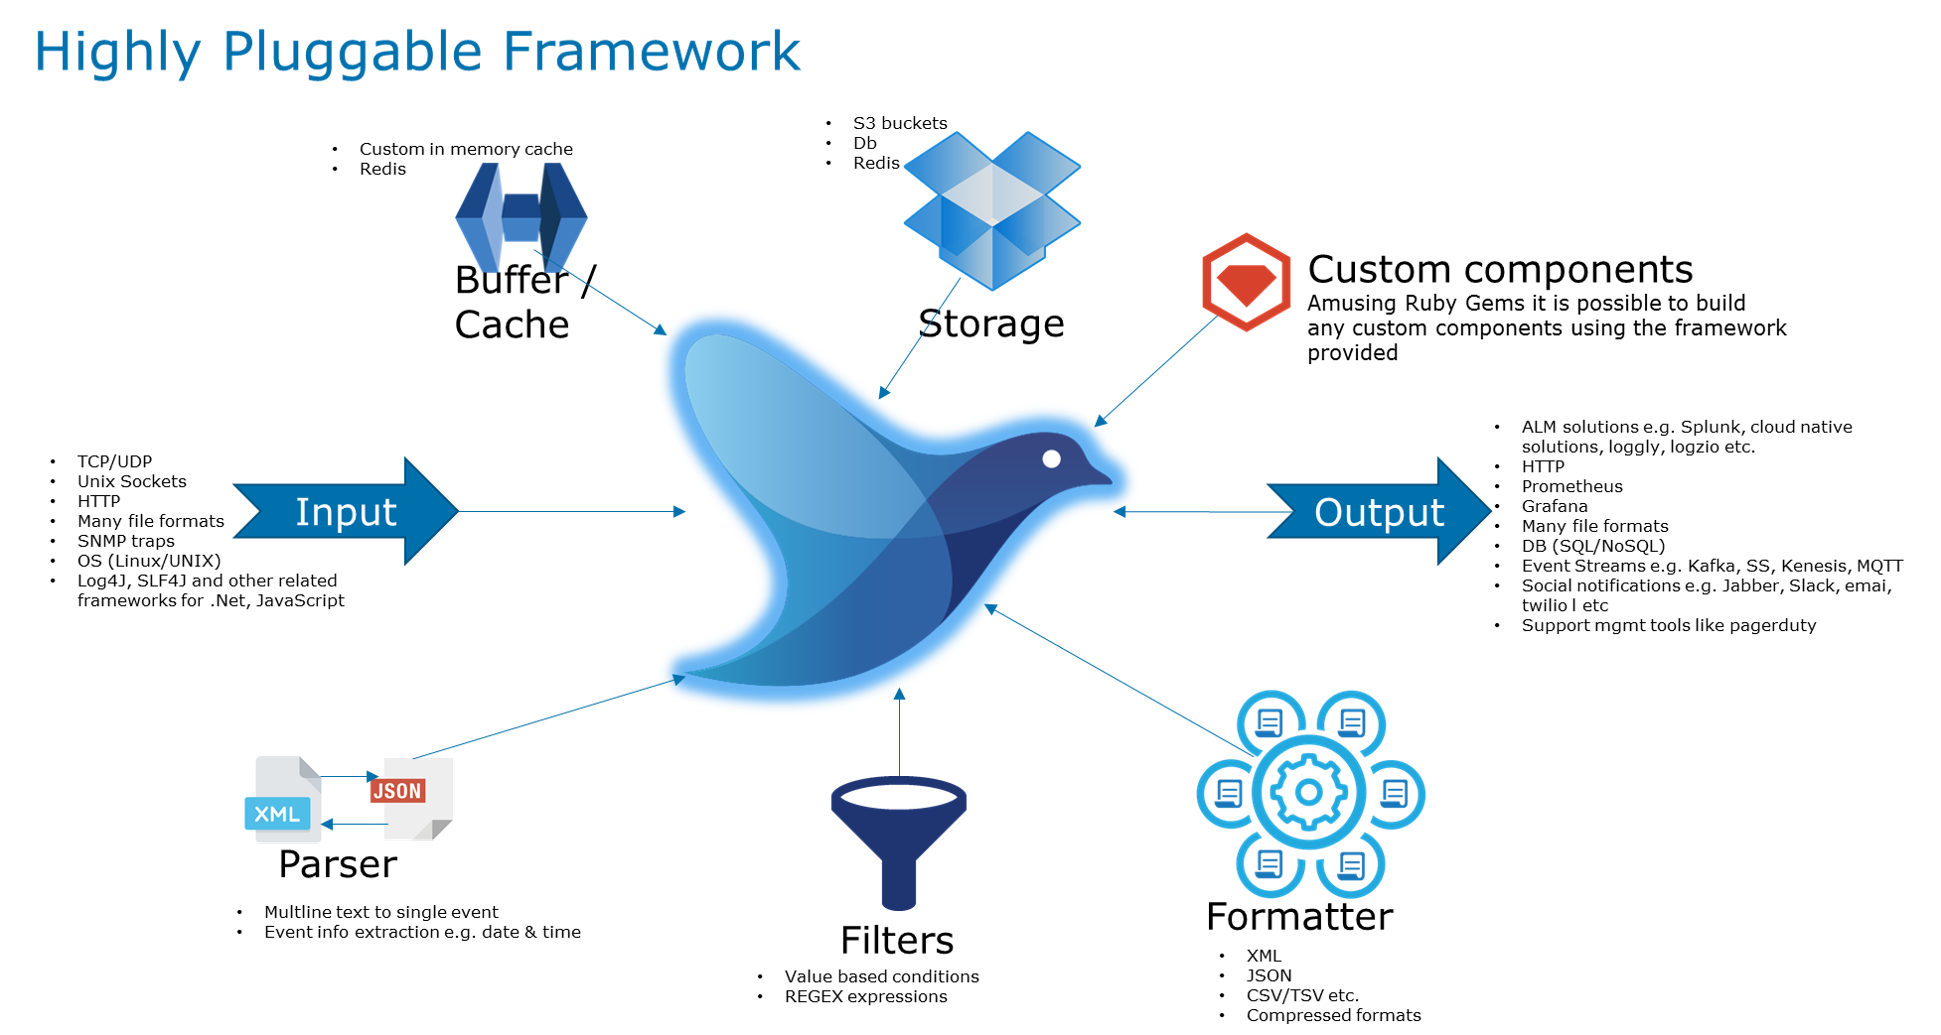
FluentD’s purpose is to allow you to take log events from many resources and filter, transform and route logging events to the necessary endpoints. Whilst is forms part of a standard Kubernetes deployment (such as that provided by Oracle and Azure for example) it can also support monolithic environments just as easily with connections working with common log formats and frameworks. You could view it as effectively a lightweight (particularly if you use FluentBit variant which is effectively a pared-back implementation) middleware for logging.
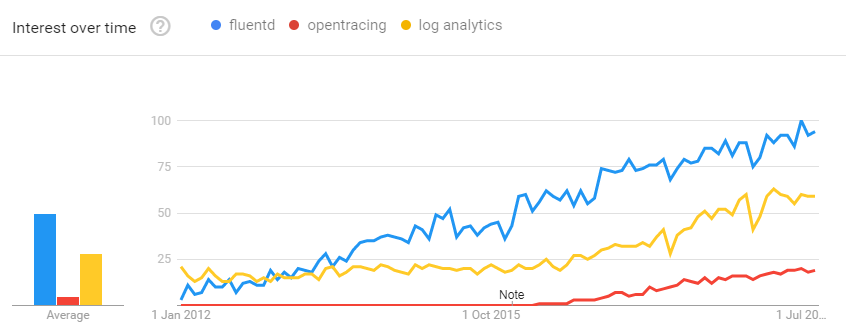
If this isn’t sufficient to convince you, if Google searches are a reflection of adoption, then my previous post reflecting upon Observability -London Oracle Developer Meetup shows a plot reflecting the steady growth. This is before taking into account that a number of cloud vendors have wrapped Fluentd/fluentbit into their wider capabilities such as Google (see here).
Not only can you see it as middleware for logging it can also have custom processes and adapters built through the use of Ruby Gems, making it very extensible.
Last night was the London Oracle Developer Meetup’s sessions around observability. Andrei Cioaca with a focus on the use of OpenTracing as provided by Jaeger, in a standard Kubernetes deployment with Istio – realized with Oracle Kubernetes Engine (OKE). This was followed by my session on another pillar using logging via FluentD. Also incorporated into standard Kubernetes, but also able to support traditional monolithic use cases.
Andrei provided a great overview of the 3 pillars and the strengths and weaknesses of the different pillars. With the basics covered Andrei then dove into the configuration and execution of Istio combined with Jaeger and the corresponding insights available. including a look at the kinds of visual insights that Jaeger and Kiali provide. Some probing conversations followed about the relationship to Spring Cloud Sleuth, Open Zipkin and the OpenTracing as a concept more generally.
Andrei’s presentation material can be found in his GitHub repository here.
Google Analytics on Search Terms
My session followed a pizza break, as there was a delay in its arrival. With everybody having chatted over pizza about OpenTracing, we picked up on FluentD and the Logging aspect to Observability. FluentD, as an open-source project has been growing steadily, and actually baked into several Log Analytics products and services – as the above analytics from Google shows.
The presentation looked at the growing challenges of modern software in terms of making sense of logging. We explored the capabilities of FluentD before drilling into real-world use cases and potential deployment models.
As you’ll see from the slides we ran a couple of demos. The configuration for the demos can be found at https://github.com/mp3monster/fluentd-demos along with an example payload.
So recently we have been working on ‘knowing what I don’t know’ when it comes to Open Tracing and how such tech may intersect with traditional logging and the use of FluentD.
Whilst I have a good relationship with Packt, the fact they published the book is pretty much coincidental.
Understanding tracing over traditional logging is very important when moving into the world of microservices and reactive frameworks such as Node.js where threads are picked up and put down, you don’t know where and when the next service in a solution will pick up the next related activity. When you add to this solutions are more polyglot than ever – not only in the sense of different languages that may be used but a more diverse source of middle features e.g. historically you’d probably use JMS based messaging if you’re a Java developer and MSMQ for .net. Now you may be using AWS SNS as easily as Kafka. This means the mechanisms for passing and tracing events through these services need to be more unifying than ever.






 Last night was the London Oracle Developer Meetup’s sessions around observability.


You must be logged in to post a comment.