A FIPS safe mode to ensure things are safe during start and restart.
Ensuring timestamps will work beyond 2038.
TLS handling refinements such as certificate reloading
Management of the internal buffers can be made more dynamic now.
Improvements across a number of plugins for input and output.
Dynamic flushing to allow dynamic optimization within configured boundaries.
Packaging improvements for Windows Nano and Debian deployments.
New root section called Extensions.
A lot of these gains are great, and will really pay off for high volume deployments, where small savings, cumulative can really payoff economically. It is the new extensions feature that I’m most interested in as it open up some capabilities when managing the observability domain.
Extensions
The extension structure (first identified as a useful feature with issue 11863) doesn’t impact Fluent Bit behavior but is retained and accepted as YAML configuration values. This means that any tools being used to manage Fluent Bit configuration can now add YAML key value pairs (including nested values) without causing Fluent Bit a problem, and can therefore be used by management tools. For example we can track what version of a configuration is being handled by Fluent Bit by injecting a Git version identifier (just as you see in the Fluent Bit output at startup). This simple change means that it is now possible to understand which version of configuration is being executed. When you’re rolling out to a large estate (particularly outside of containerized environments) it is easy to know what has been rolled out.
extensions:
opamp:
endpoint: 127.0.0.1:4318
insecure: true
deployment:
config_version: 12345
If you’re using Fleet Management capabilities such as OpAMP (a specification developed as part of the Open Telemetry project) you can embed the client side controller/supervisor configuration within the Fluent Bit configuration (as long as the controller supervisor understand where to get the values from within a YAML file).
It also means that you’re allowing more dynamic changes, it becomes easy to notate such dynamic changes., for example:
extensions:
deployment:
changeDTG: 2026.08.05.16.25
notes:
- changed flush interval
- moved plugin x output
Personally I’d not advocate changes without using configuration control tooling, but it certainly is better than no record.
Next steps
If you follow this blog regularly, they’ll be aware of the OpAMP project which implements the protocol, and provides a server that includes fleet management and configuration editing and validation for Fluent Bit server side, and a client supervisor/observer on client client/consumer side which can manage Fluent Bit instances. These changes mean that the project will need:
New configuration and validation settings (the UI is entirely meta-data driven) for the new properties.
The configuration catalogue viewer will need to be updated to exploit the extensions feature for showing versioning.
The client/consumer side can be extended to become Fluent Bit aware and exploit the embeddable extensions capability.
We may also offer the dynamic change recording possibility as an optional feature (from a product view – we shouldn’t force specific ways of working, but from a personal view it isn’t a way I’d recommend working)
The Elastic toolset for monitoring and observability with the Beats tools (heartbeat, filebeat etc) and more recently an integrated OTel compliant agent have been attractive because of the strength of the analysis capabilities of Elasticsearch, Logstash and Kibana. All the products are available as open source and can be extended (although with 3rd party constraints as a result of licensing) and with enterprise extensions.
Kibana while focused on data visualisation, also provides the fleet management layer to control the remote agents. Kibana’s communication with the agents now makes use of protobuf. With clear commenting discouraging the use.
This is great if your entire ecosystem is aligned to the Elastic stack, but that is rarely the case. If we’re not already in the era of polyglot, then pervasive use of AI to power development, both at departmental level (shadow/gray IT) and even citizen development.
Managing distributed instances of the Elastic Agent outside of Kibana has to be done using the agent’s command line interface. The only publicly documented web interface allows the retrieval of status information. This does feel rather poor as a means to drive the adoption of Kibana (and encourage the use of Elastic Cloud).
This leads us to the question of whether to use the Supervisor or Observer model of using the OpAMP standard, or should we try to embed the OpAMP client directly into the Elastic Agent. Having studied the documentation and some of the code base it feels like these sort of customisations are not encouraged, and emphasis for extensions are about adding the means to monitor different protocols or products. Incorporating socket or HTTP handling that also needs to interact with lifecycle logic would be very invasive.
Further more, invasive changes may prove to be more problematic if you switch from a forked open-source version to an enterprise licensed version, where you’d want both the benefits of OpAMP and the licensed extras.
The way we have designed and implemented our client so that it is easy to implement specific logic for different observability tool, and the development of the elastic agent logic, meant we took the final step of adopting a fully pluggable mechanism – we’ll come back to those details shortly..
Our implementation of the Elastic Agent management supports both models of supervisor or observer, but we would err towards using it in an observer mode. The control aspects of the agent are mapped onto using creating commands and using the CLI, as with Fluent Bit basic health can be retrieved via the agents REST endpoint.
The command line does allow for more diagnostic information. But we’ll look at that later.
What’s new as a result of the modifications
The improvements are being incorporated into a branch in the repo while we do regression testing, once we’re happy we’ll merge into main, and label.
Starting with the simple things:
We have a simple validation setup that can be run to ensure you have the elastic agent and a containerised Logstash that can talk to each other. The agent is configured to monitor itself to generate traffic to Logstash.
That configuration has been mapped into the example setup of the agent being managed by the OpAMP consumer.
We’ve enhanced the OpAMP-CLI tool so it can launch the containers using Docker or Podman. This makes it quick and easy to configure and launch demos and end-to-end regression tests. There are also some convenience tweaks to the way the CLI works.
New documentation explaining how to implement and deploy the management of your own Observability product.
We’ve refactored part of the consumer code to explicitly separate the specific code for the agent being managed be that Fluent Bit, Fluentd, Elastic Agent etc. the test code reflects the same structure.
The linkage to the Observability tools is dynamic now. Rather than have a central package which imports all the plugins.
There are a few things we haven’t done,..
We’ve only provided support for operations such as start and stop, so the server side of the product only works with the core server features. There is no configuration editor.
The MCP broker hasn’t been enhanced to understand differences between the client types. This is also true with the Slack interfacing. We will return these areas, but the most valuable thing that can be done is to make the OpAMP solution cover a variety of Observability agents.
We still need to improve the automated regression testing.
Extend to cover the individual beats components.
All these improvements will start arriving in the GitHub repo in the next couple of days. Once we think everything is good, we’ll up issue the release number – sdo watch the github repo 🙂
Over the years we’ve created a number of GitHub repos with tools and associated content that can help us in the Observability space, such as log generation and replay, to help validation Fluentd and Fluent Bit configurations (or an OTel collector of choice). This extends to the most recent efforts with imp,eating the OpAMP capabilities and configuration UI.
Tools are good, but documentation that is easy to work with is a key to helping users be successful. To support that we have established a consolidated set of pages using GitBook which can be found at:
The nice thing about GitBook, is that it brings together the various resources such as markdown , HTML etc and creates a friendlier experience. It also keeps in sync with the GitHub repos.
New logos
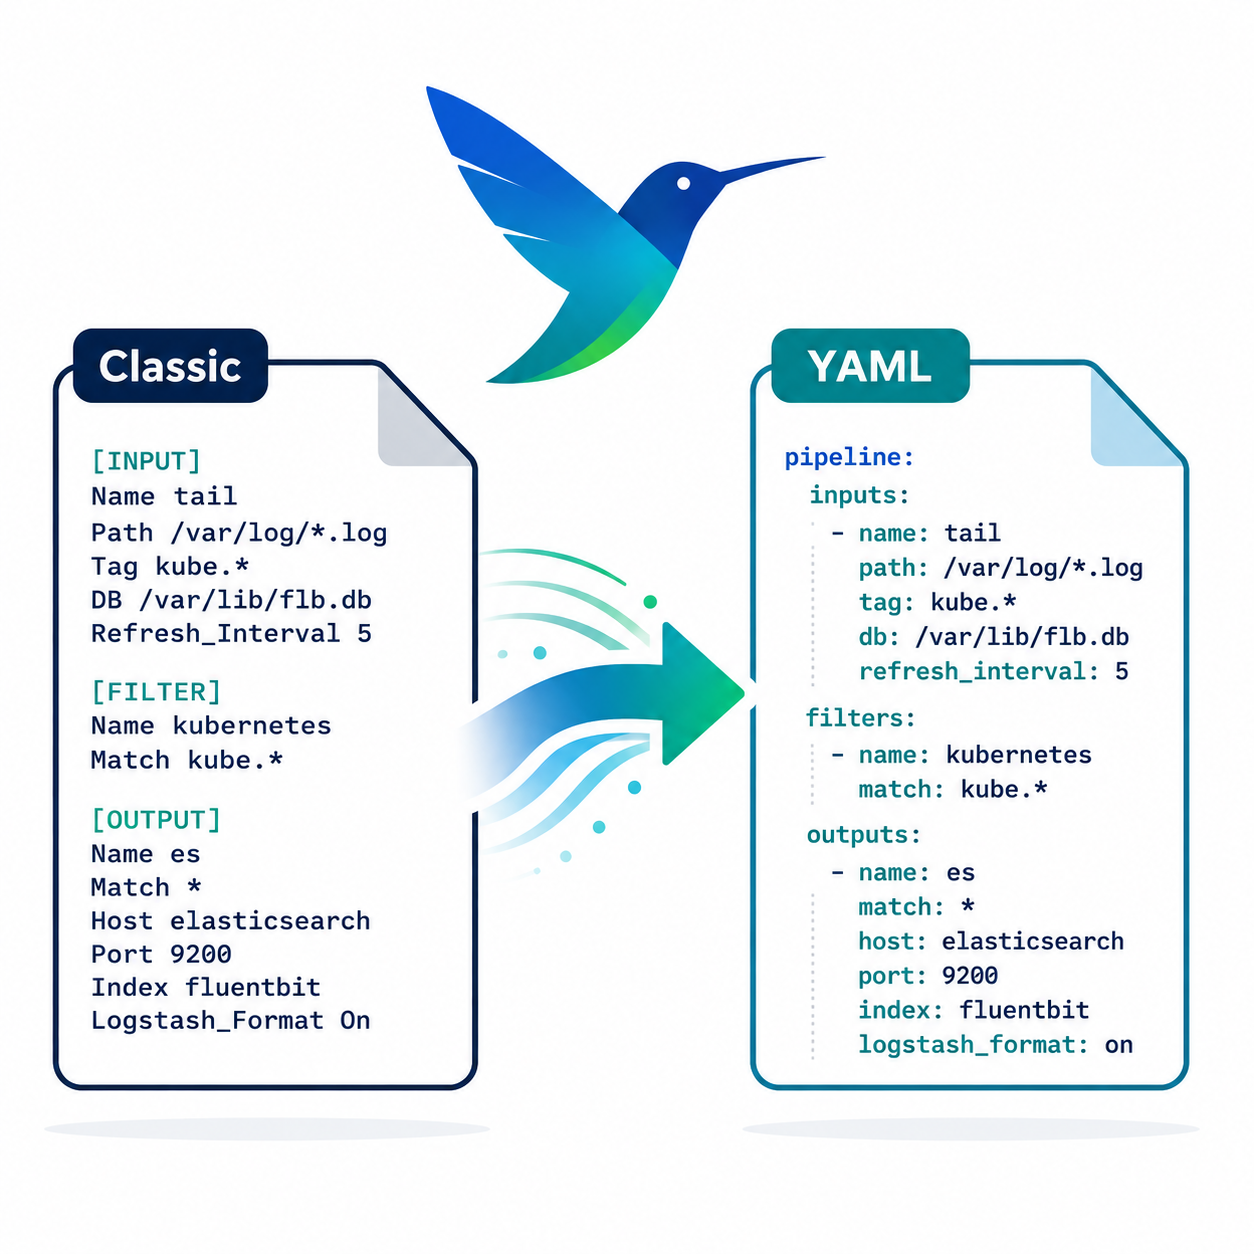
As we’ve established the GitBook content, and using AI makes us less artistically able people to create graphics and logos, we’ve created a couple of logos for the older repos as well:
Fluent Bit Classic configuration to YAML conversion tool.
Log Generator can create synthic logs, or replay application logs to simulator a real system logging.
Another aspect of OpenTelemetry’s OpAMP protocol is the ability to share connections details, not just between the server side of the OpAMP protocol, but with other connections a collector like Fluent Bit could be using such as an OTel consumer for logs, traces and metrics that are being collected that could be a managed Grafana service or another Fluent Bit if you’re using a concentrator network.
This is includes Observability data generated by the collector I.e. Fluent Bit in our case.
Yes, but Fluent Bit doesn’t push its own OTel signals
It is true that out of the box Fluent Bit doesn’t push OTel signals for itself. But this is easily fixed. We can control logging, and metrics that are exposed (and today no traces are produced). The solution is simple, we use Fluent Bit itself to collect the logs and metrics and route them to using an OTel output plugin.
While creating a configuration for sharing seems onerous, once you’ve done it once, you can simply include the config file in every deployment. Further more, if you backend for any of the signals is not Fluent Bit conversant, just use a different Fluent Bit plugin.
Config walkthrough
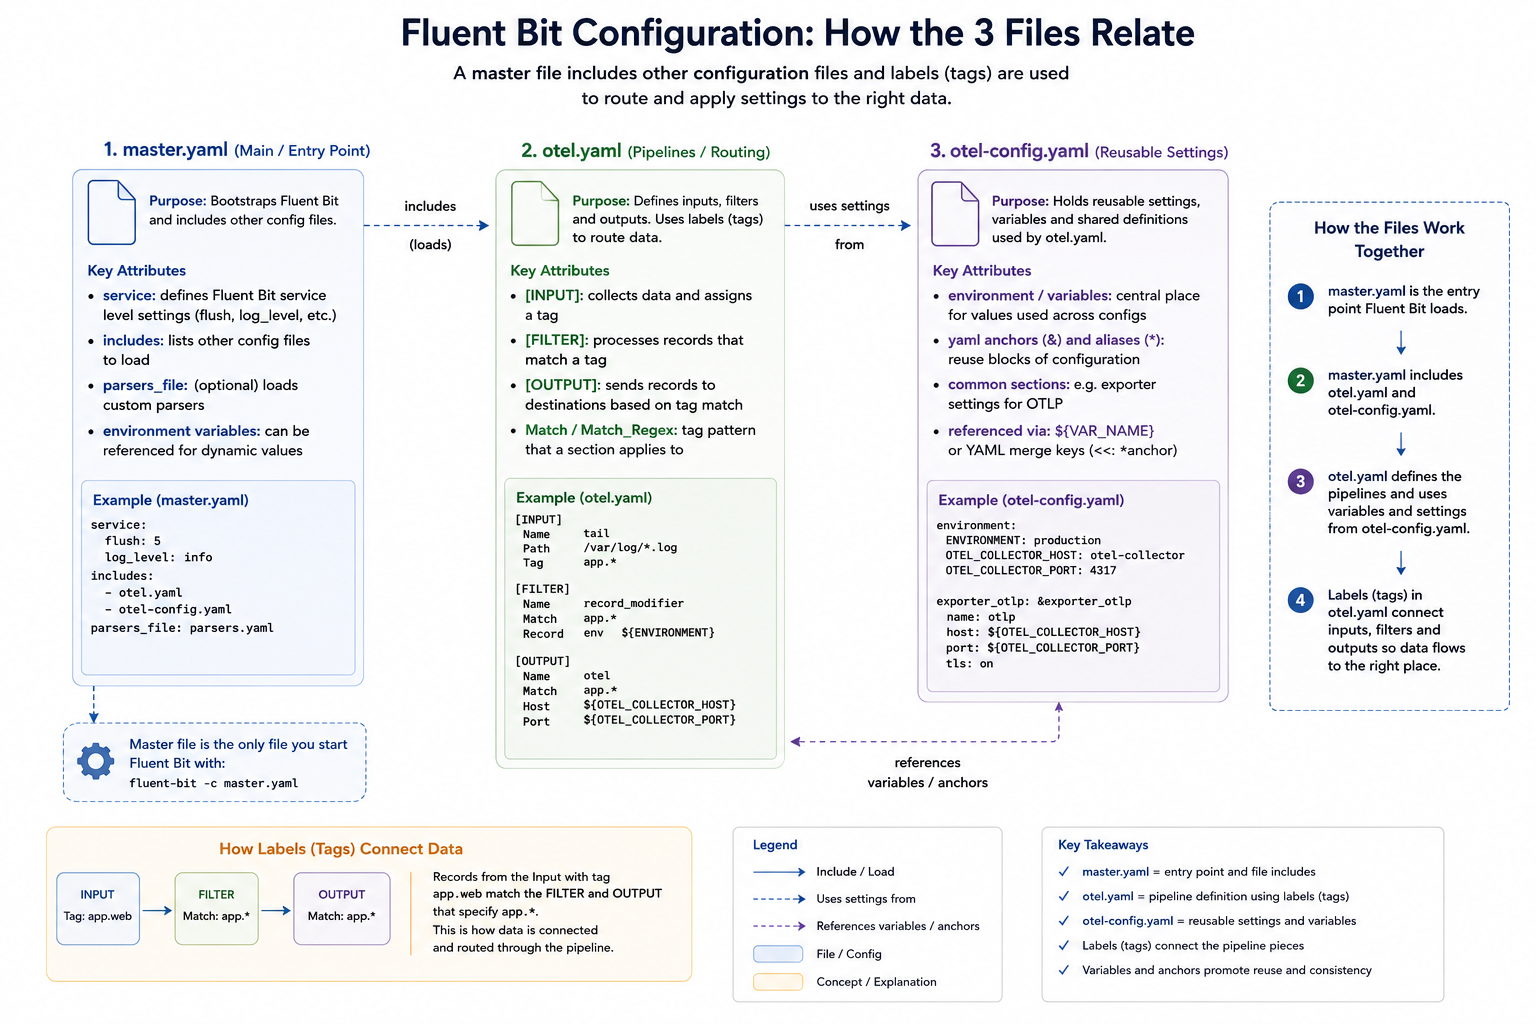
Our configuration consists of several files, which we’ll explain. We’ve adopted a multi-file setup, which works through the use of Fluent Bit’s includes capability so we can separate out the application-level observability configuration (master.yaml), the configuration to allow us to observe Fluent Bit itself (otel.yaml), and the configuration for the connection parameters (otel-config.yaml).
Master.yaml
The master.yaml contains our application observability settings and is the configuration file we pass to Fluent Bit. In this case, we’re simply using a dummy input that’s fed to a file output; we’ve also got a wildcard stdout configuration to make it easy to observe what’s going on from the command line.
There are at this level, two telltale signs of self-monitoring at this level:
The includes declaration picks up otel.yaml, which includes additional inputs and outputs, as well as service configurations.
The service settings that switch on the HTTP server. It is controlled via environment variables, so you could switch this off easily. We have to implement these settings here, as within the full set of file inclusions, there can only be a single service block.
The service declaration also specifies where we want the log file that the Fluent Bit setup needs to go.
otel.yaml
We’ve separated the pipeline definitions for Fluent Bit observability to reuse the configuration across many deployments. As different deployments may need to talk to different instances of the observability backend (for example, when operating in a multi-cloud arrangement we have defined the environment variables that provide the credentials and target address).
We have defined additional environment variables at this level, so that anyone needing to understand master settings and the service values needs only look here. How this layer (or layers) is established is, to an extent, concealed. It also means we can use OpAMP to generate a configuration file, but we’ll come back to that.
The environment variables that we define to be used by the master.yaml switch the HTTP server on, and indicate which ports to use. Making this easy to check for the person or people defining the master.yaml makes it easier to avoid port collisions.
We also tell Fluent Bit where to write its logs through the service setting. To consolidate the configuration, that value references a different environment variable, so we can put all of our configurations together. Even if we didn’t have this level of redirection, it is worthwhile setting the value using an environment variable as the file location is needed both as our output for the service and the input for a plugin.. As you can see, we’ve just named the file. So the file created will be relative to wherever we run Fluent Bit from.
Let’s look at the inputs and outputs being used, and what they do:
Tail – this is the input that reads Fluent Bit’s logs, as we set Fluent Bit to log at debug level, we’ll see plenty of activity. Having Fluent Bit write to the file system, only for a thread in the same process to read it, is obviously inefficient. It can be optimised by using a RAMFS-like filesystem on Linux and a RAMDisk-like filesystem on Windows, so everything is in memory.
Fluentbit_metrics – this is the active collection of metrics, which we simply point to the server part of Fluent Bit. If you’re using Fluent Bit as a sidecar in a pod, this has to be done carefully because of how networking for containers within a pod is handled.
opentelemetry – This takes our different input signals we’ve been collecting and pushes them to the OTel-compliant service. If we had different backend products for different types of signals, then we’d need different or multiple plugins defined. Although OpAMP does infer an OTel-compliant backend.
That is the hard bit done. As a result of these inputs, we get the metrics and logs (and no traces are available). We now just need an OpenTelemetry output plugin to direct all the OTLP-represented signals. For simplicity, we’ve made use of a free account on Grafana Cloud.
otel-config.yaml
This configuration file is simple, which is key to making it easy for us to manage the connections setup using OpAMP. It simply defines the connection-based attributes needed, as shown:
While populating credentials in a file isn’t ideal, it makes it pretty straightforward for an OpAMP Client (observer or supervisor) to receive the credentials for the management side of the protocol, make them available to Fluent Bit quickly, and have Fluent Bit pick them up dynamically via hot-deploy functionality. This is precisely what we have implemented in our OpAMP. This approach works for both Fluent Bit and Fluentd configurations and we can even apply a similar approach for driving clients such as Elastic Beats.
This configuration file is simple enough that we can rewrite it whenever the configuration values are amended; there is no complexity in inserting such settings into the broader configuration. Furthermore, if Fluent Bit were running as an observed process rather than a supervised (i.e., child) process, setting environment variables could become problematic.
We can mitigate credential-related challenges in the file system by restricting filesystem permissions to the file being written, so only certain users and processes can access it. When working with containers, we can also keep this part of the file system within the image by using a transient storage layer.
Alternative strategy for securing credentials
An alternative approach would be for the client to receive the credentials and store them in an encrypted method, such as a credentials vault, and then the launcher for the process would read and decrypt the file as it launches Fluent Bit or another collector. The way we have implemented the client for our OpAMP certainly makes this possible, but it also complicates the process and suggests that the mechanics of credential management would be better handled by a distributed vault solution.
OpAMP’s assumption
The only niggle, is that when passing the connections, the protocol assumes that connection details are only needed for the collector. That’s fine if the collector includes the client side of the protocol. But as we know, the collector may be managed with a supervisor or observer process. We could use the connection for the collector and our supervisor, but that may not be what is wanted.
Visualising the configuration
We can visualise the relationships, like this:
Unpacking the server-side aspects
As you start to think about the server aspect of this, it gets potentially very complex. In simple scenarios, sending everything to a single Observability backend isn’t an issue.
But if you’re managing a multi-cloud, hybrid, or managed client setup, you’re likely to want separate backend instances for different collectors. In our setup, that means passing the different connection details to the client to populate otel-config.yaml. Understanding this deployment will require understanding the distribution. We will also need to manage potentially a concentrated catalogue of credentials, which will need to map to the collector nodes, and a means for the user to define the mapping. Creating a means to visualise the mapping, and ideally to allow the server to apply rules or infer assignments for more complex use cases such as multi-cloud, isn’t going to be simple.
Conclusion
We have a simple means to deploy configuration and observe our collector and the supervisor/observer process. Making server-side management in a large-scale environment easy to work with will require some consideration and potentially additional optional metadata. But the protocol supports all of this, but doesn’t mandate specifics. Which does mean that either the server has to be smart enough to know when what to do if it interacts with a client that has been built or configured to work with this server – which is an essential requirement, otherwise we lose the value of the
Something that vendors like Microsoft have been really good at is reducing the friction on getting started – from simplifying installations with MSI files and defaulted options through to very informative error messages in Excel when you’ve got a function slightly wrong. Apple is another good example of this; while no two Android phones are the same, my experience is that setting up an iPhone is just so much easier than setting up an Android phone. It is also the setup/configuration where most friction comes from.
Open-Source Software (OSS), as a generalisation, tend to be a bit weaker at minimising friction – this comes from several factors:
When OSS is part of a business model, vendors can reduce that friction, making their enhanced version more attractive.
OSS contributors are typically focused on the core problem space and are usually close enough to the fine details to not need those fancy features to keep the rest of us out of trouble.
The expectation is that tools to make configuration easy are embedded in the application, making it heavier, when the aim is to keep things as light as possible.
Occasionally, a little bit of intellectual snobbery can creep in
The common challenge
The issue that I have observed is that we often go through cycles of working with a technology. For example, you’re building a microservice. Chances are, you’ll start writing and running it locally, without worrying about containerization. Once you’re pretty happy with things, you’ll Dockerize the service, start testing it locally, and then you’ll be ready to deploy it to a cluster. Now you’ll need your YAML. It may well be weeks since you last looked at Helm charts. You end up cutting and pasting your last configuration. But now you need to use another feature of Helm, can you remember the exact settings for the feature. So now you’re trawling the net for documentation, and then it takes several tries to get it right.
AI may well step in to help developers in this area, where solutions and products are well-documented. But with the wrong model or insufficient detail in the prompt, it’s easy to make a mistake. Personally, I’d turn to AI when it becomes necessary to trawl code to better understand the configuration and its behaviour, and to set options.
Experimental Solution
Solution – well, that depends upon the configuration syntax. We have been experimenting with RJSF (React JSON Schema Form), which provides a React-based UI that can be dynamically driven by a JSON schema and validate data with AJV (an alternative stack considered would have been around JSON Forms).
{
"type":"object",
"title":"Dummy",
"properties":{
"name":{
"type":"string",
"const":"dummy",
"title":"Plugin"
},
"copies":{
"type":"integer",
"description":"Number of messages to generate each time messages are generated.",
The above fragment shows part of the Schema definition for the Dummy plugin for Fluent Bit.
By then creating a schema that defines the different plugins, attributes, etc., we can drive validation and menu items easily in the UI. Admittedly, the config file is significant given all the plugins and configuration options, but it is a fair price to pay for a UI that validates the data. Establishing the schema to start with, we’ve covered it through scripting the retrieval and scraping of the Fluent Bit pages, which are pretty consistent in structure.
We have added some custom elements into the definition, for example, x-doc-reference, which allows us to extend the React components to provide features such as a link back to the original documentation as you select attributes or plugins.
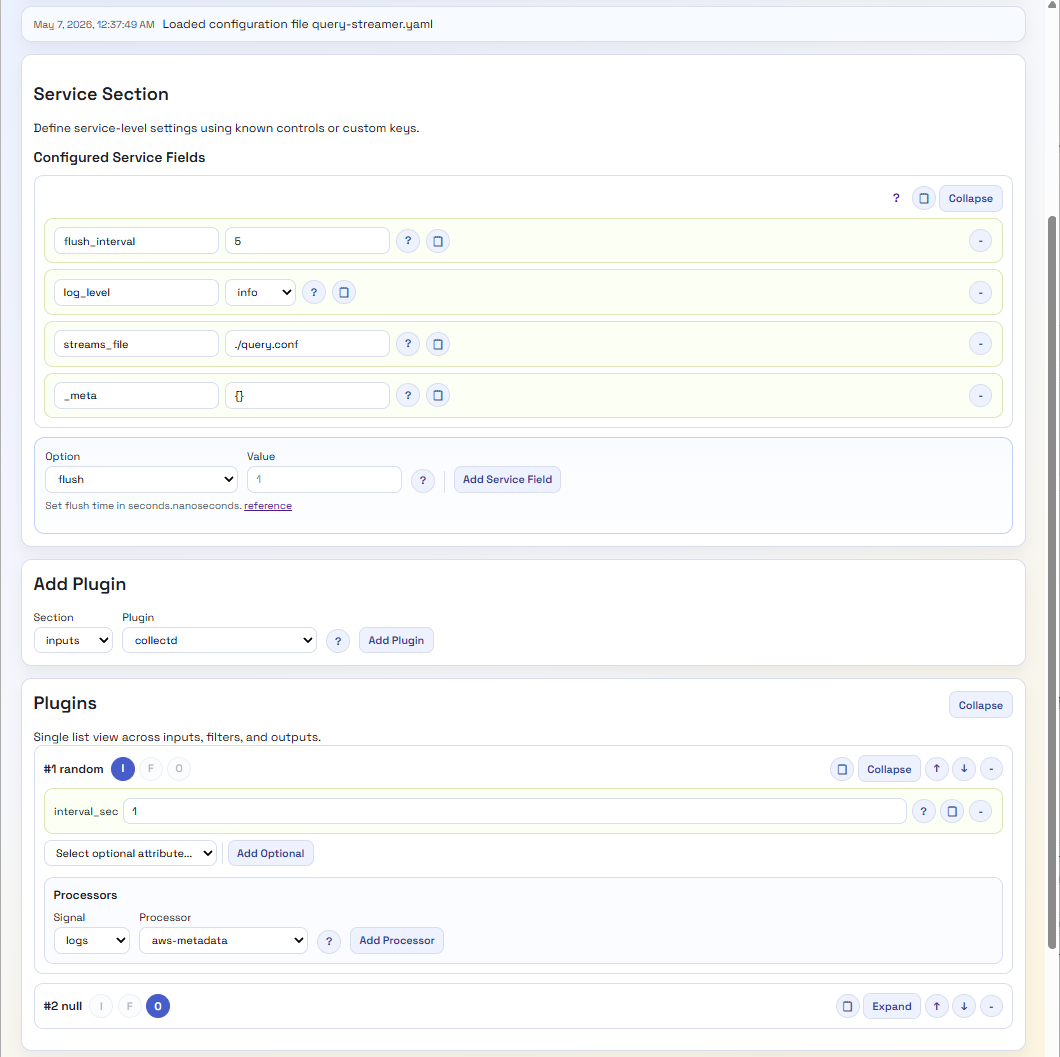
As a result, we very quickly have a UI that can look like this:
A lot easier to view and tweak, with no need to hunt for valid options. Even if we want more information, we’re just a button click away from the open-source data. Perhaps we should provide a version that hyperlinks to the Manning Live Books on Fluent Bit, etc.
There are a few other factors to consider; for example, Fluent Bit configuration is YAML, not JSON, which can be easily resolved given the relationship between the two standards. Then there are processors that can embed Lua code or a SQL-like syntax. As we’ve chosen to provide a Python backend, we’ve addressed this by providing REST endpoints which can query out of the JSON the code or SQL and perform validation using the Python Lua Parser, and the SQL syntax can be addressed using the Lark library for processing the SQL, as the syntax is simple enough to define and maintain the syntax.
Outstanding Gaps for Fluent Bit
We still need to address several features that Fluent Bit has, specifically:
Environment variables
Includes
These issues should be straightforward to overcome, although dynamically including the included elements into the UI view elements can be done. The challenge is: if any changes need to go into something that has been included, how do we push them back to the included file? Particularly if there are multiple layers of inclusion.
What about Fluentd?
Fluentd configuration isn’t JSON-based notation, but it is structured. So, to apply the same mechanism, we’ll need to define a schema and a mapping mechanism. The tricky part of the schema is that Fluentd supports nesting plugins, since the way pipelines are defined for routing differs. While JSON schema will enable this with constructs such as anyOf, oneOf, object nesting, and bounded object arrays, the structure will be more complex.
The second challenge will be the transformer/renderer, so we don’t introduce issues from having to escape and unescape characters, since JSON Schema is stricter about character use.
Then What?
Well, if we get this going, we’ll probably incorporate the capability into our OpAMP project and maybe create a build that lets the configuration tool run independently. Lastly, perhaps we should look to see if we can make the different layers a little more abstract, so we can plug in editors for other configurations, such as OTel Collectors or the ELK Stack.
As a bonus, perhaps transform the Schema into a quick reference web document?
Time to share a short update on our OpAMP project to support Fluent Bit and Fluentd in a supervisor model. We’ve just put a V0.3 label on the GitHub repo (https://github.com/mp3monster/fluent-opamp). The trigger for this has been the refactoring so that the framework on the client side is as reusable as possible for both Fluentd and Fluent Bit (the benefit of implementing Opamp using a supervisor model)
As OpAMP defines what happens between the Client and Server rather than how the client, server and agent must behave as well as the protocol we’ve introduced some features not mandated by the standard but can be delivered using the OpAMP framework. Such as shutting the agent down completely.
The following sections summarize what has recently been incorporated.
What’s New in Our OpAMP Supervisor Stack
Over the last set of releases, we focused on three areas that matter in day-to-day operations:
Better multi-agent support through a cleaner client architecture for both Fluent Bit and Fluentd.
Optional bearer-token authentication that can be enabled in production and disabled for fast local development and tests.
Clear, predictable rules for when a client sends a full state refresh back to the server.
This post is a walkthrough of what changed and why.
Client Architecture Refactor: Fluent Bit and Fluentd as First-Class Implementations
We restructured the consumer so Fluent Bit and Fluentd are now explicit concrete implementations built on a shared abstract client.
Why this matters
Before this work, behavior could drift toward Fluent Bit defaults in places where Fluentd needed different handling. The new structure makes those differences deliberate and visible.
What we changed
Shared logic is centralised in a typical abstract client and reusable mixins.
Fluent Bit remains the default implementation with shared runtime behaviour.
Fluentd overriding functionality for Fluentd-specific behaviour, including:
monitor agent config parsing from fluentd.conf/YAML
monitor agent endpoint usage for version and health
Fluentd-specific health parsing and service type handling
Operational improvements
We’ve created scripts to make it easy to get things started quickly. The startup scripts were standardized:
scripts/run_fluentbit_supervisor.sh|cmd
scripts/run_fluentd_supervisor.sh|cmd
scripts/run_all_supervisors.sh|cmd
Optional Bearer-Token Authentication (With a Fast Disable Switch)
We added optional bearer-token auth for the UI and MCP end points in the server. The OPAMP spec points to different authentication strategies that need to be addressed. For bearer-token-managed endpoints (where you can direct the server to do things that are potentially much more harmful), the design goal is to keep development and unit testing simple, so we have some controllable modes..
Modes
Authentication is controlled by environment variables:
disabled (default): no auth checks.
static: bearer token checked against a configured shared token.
jwt: JWT bearer validation via JWKS (for example with Keycloak).
Why this model works
Production can enforce auth with static or JWT validation.
Local development and endpoint unit tests can run with auth disabled, avoiding unnecessary test harness complexity.
The same app can move between dev/staging/prod by environment configuration, without code changes.
Protected endpoints
Protection is prefix-based (for example /tool, /sse, /messages, /mcp) and configurable.
This means teams can gradually expand the scope of protection over time by updating path prefixes, rather than doing an all-or-nothing rollout.
Auth observability
Authorisation rejections are logged with mode, method, path, source, and reason, making failed requests easier to troubleshoot.
Full-State Refresh Rules: More Predictable and Easier to Reason About
A major part of OpAMP behavior is deciding when to send compact updates versus a fuller state snapshot. We now fully observe the approach defined by OpAMP, but also have explicit controller-driven rules to provide robustness to the solution.
Core mechanism
The client tracks reporting flags for optional outbound sections, such as:
agent_description
capabilities
custom_capabilities
health
If a flag is set, that section is included on send. After inclusion, the flag resets. Controllers determine when those flags are re-enabled for a future full refresh.
Controller strategies
We support three controller types:
AlwaysSendre-enable all report flags after each successful send.
SentCount: re-enable all report flags after N successful sends (fullResendAfter).
TimeSend: re-enable all report flags after a configured elapsed interval.
Important behaviour detail
Controller updates happen after a successful send. This means a controller schedules what the next message should include; it does not mutate the already-transmitted message.
Server-driven override
If the server sets ReportFullState in ServerToAgent.flags, the client immediately re-enables all reporting flags so the next outbound message contains full reportable state.
This gives operators a direct way to request state re-synchronization when needed.
Security + Developer Experience Balance
A recurring theme in this work was avoiding “security vs usability” tradeoffs:
Auth can be strict in production.
Auth can be disabled in local/test workflows.
Endpoint protection scope is configurable and incremental.
Rejection logging is explicit for troubleshooting.
That same principle guided client behavior:
Shared behavior is centralized.
Agent-specific behavior is explicit where required.
Full refresh rules are deterministic and configurable.
What This Enables Next
This foundation makes the next iterations easier:
extending JWT/IdP deployment patterns (for example, broader Keycloak automation)
adding more agent variants with fewer regressions
improving configuration and rollout safety for mixed Fluent Bit + Fluentd estates
If you’re running both Fluent Bit and Fluentd, this release should make the platform easier to operate, easier to secure, and easier to reason about under change.
With KubeCon Europe happening this week, it felt like a good moment to break cover on this pet project.
If you are working with Fluent Bit at any scale, one question keeps coming up: how do we consistently control and observe all those edge agents, especially outside a Kubernetes-only world?
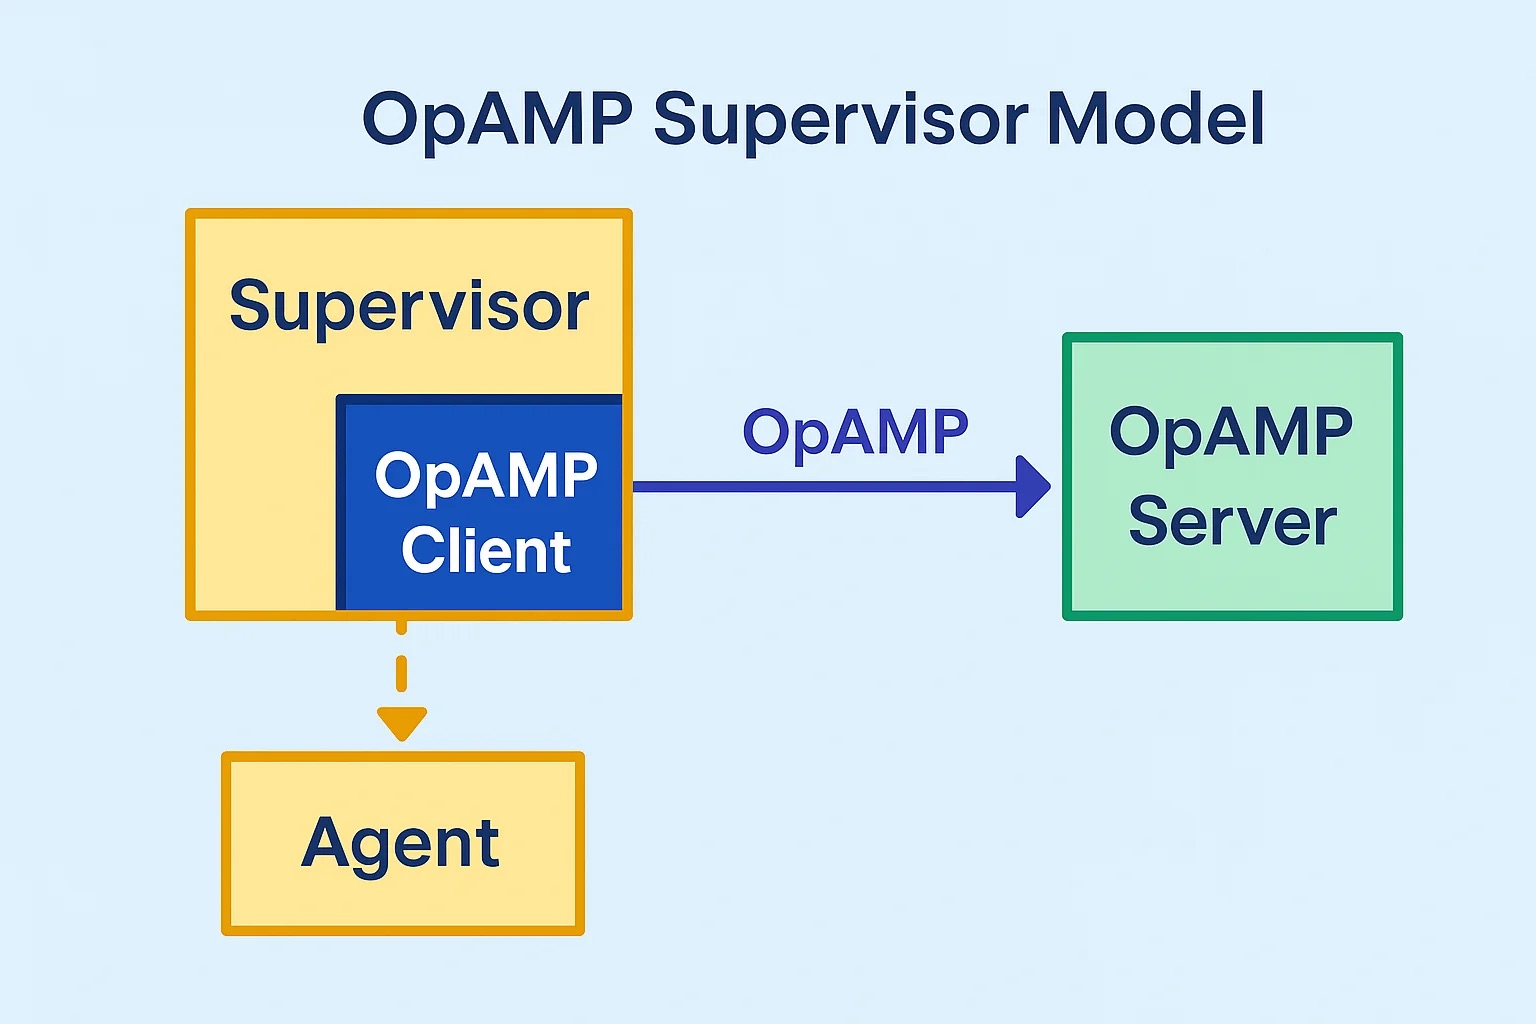
This is exactly the problem the OpAMP specification is trying to solve. At its core, OpAMP defines a standard contract between a central server and distributed agents/supervisors, so status, health, commands, and config-related interactions follow one protocol instead of ad-hoc integration per tool.
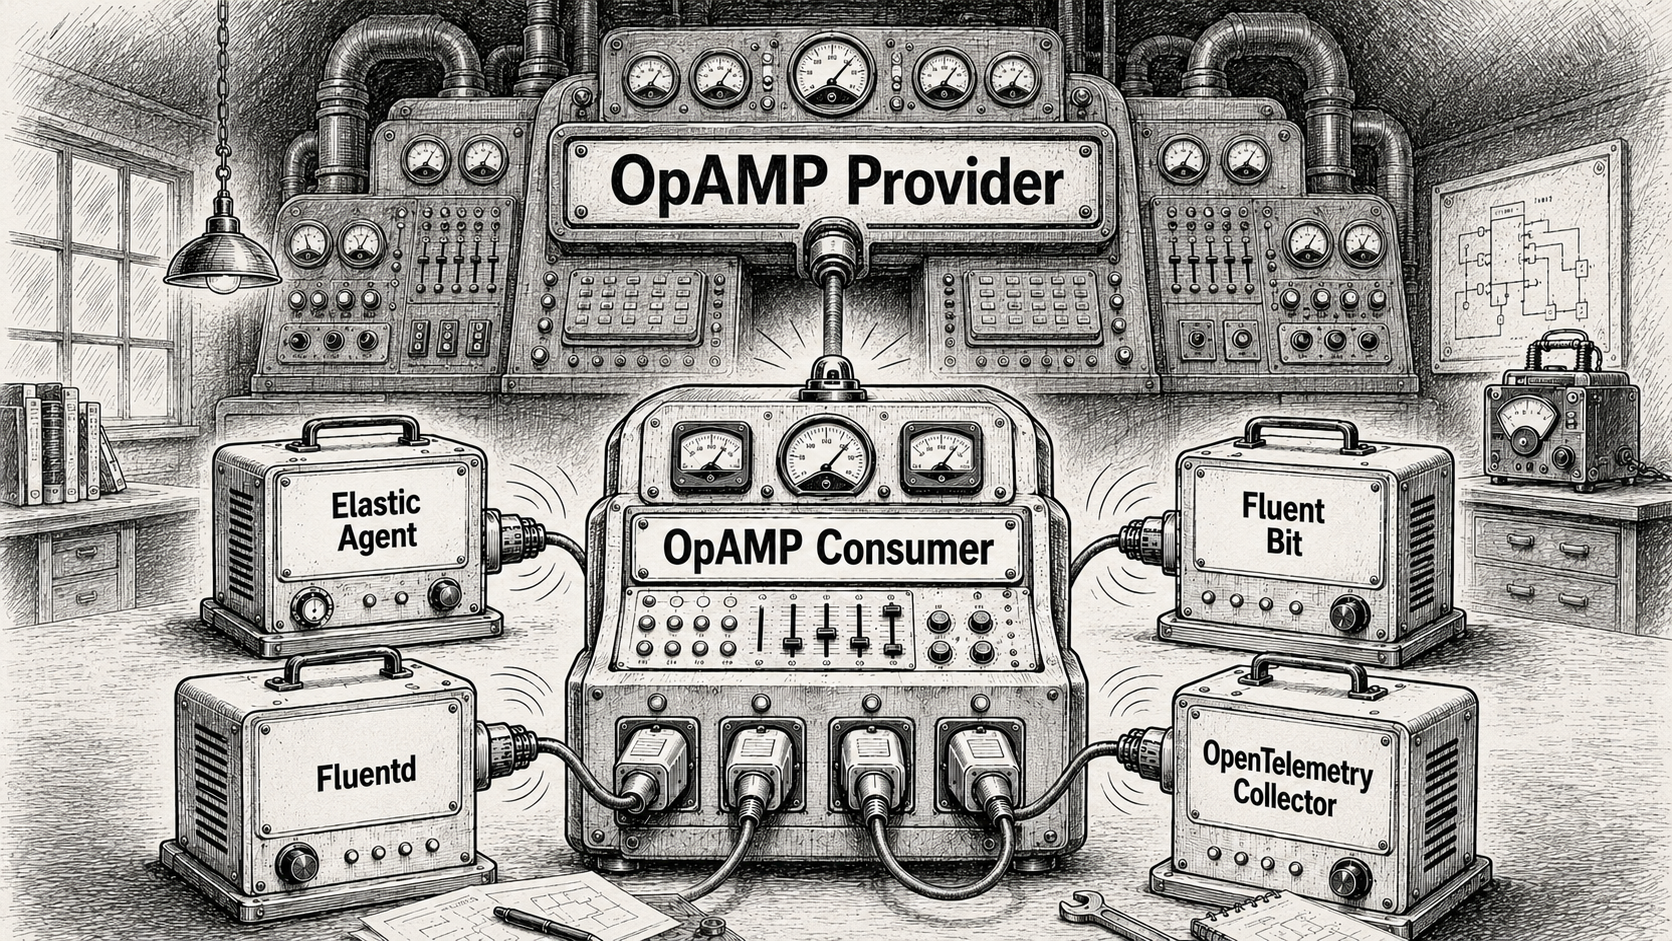
That is where this project sits. We’re implementing the OpAMP specification to support Fluent Bit (and later Fluentd).
In this implementation, we have:
a provider (the OpAMP server), and
a consumer acting as a supervisor to manage Fluent Bit deployments.
Right now, we are focused on Fluent Bit first. That is deliberate: it keeps scope practical while we validate the framework. The same framework is being shaped so it can evolve to support Fluentd as well.
The provider/server is the control plane endpoint. It tracks clients, accepts status, queues commands, and returns instructions using OpAMP payloads over HTTP or WebSocket.
The consumer/supervisor handles the local execution and reporting. It launches Fluent Bit, polls local health/status endpoints, sends heartbeat and metadata to the provider, and handles inbound commands (including custom ones). The server and supervisor can be deployed independently, which is important for real-world rollout patterns.
Because they follow the OpAMP protocol model, clients and servers can be interchanged with other OpAMP-compliant implementations (although we’ve not yet tested this aspect of the development).
Together, they give us a manageable, spec-aligned path to coordinating distributed Fluent Bit nodes without hard-coding one-off control logic into every environment.
Deployment options and scripts
There are a few practical ways to get started quickly:
Deploy just the server/provider using scripts/run_opamp_server.sh (or scripts/run_opamp_server.cmd on Windows).
Deploy just the client/supervisor using scripts/run_supervisor.sh (or scripts/run_supervisor.cmd on Windows).
Run both components either together in a single environment or independently across different hosts.
The scripts will set up a virtual environment and retrieve the necessary dependencies.
If you want an initial MCP client setup as part of your workflow, there are helper scripts for that too:
mcp/configure-codex-fastmcp.sh and mcp/configure-codex-fastmcp.ps1
mcp/configure-claude-desktop-fastmcp.sh and mcp/configure-claude-desktop-fastmcp.ps1
Server screenshots
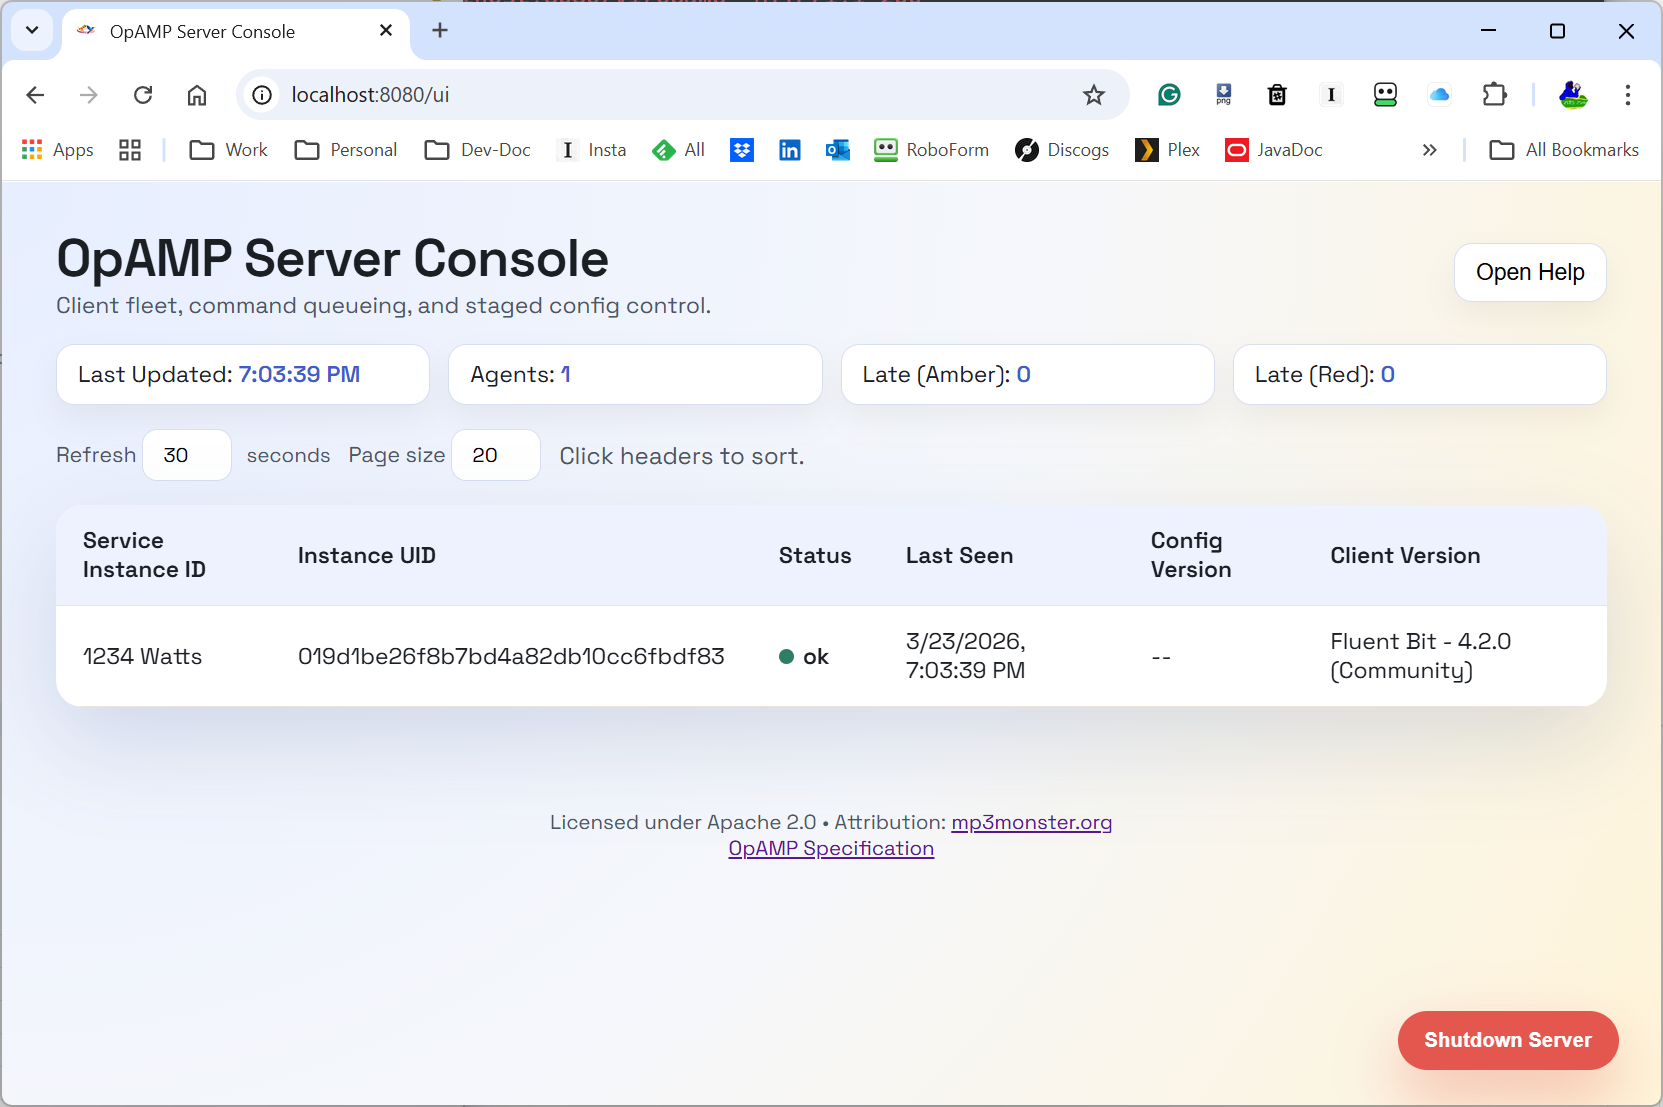
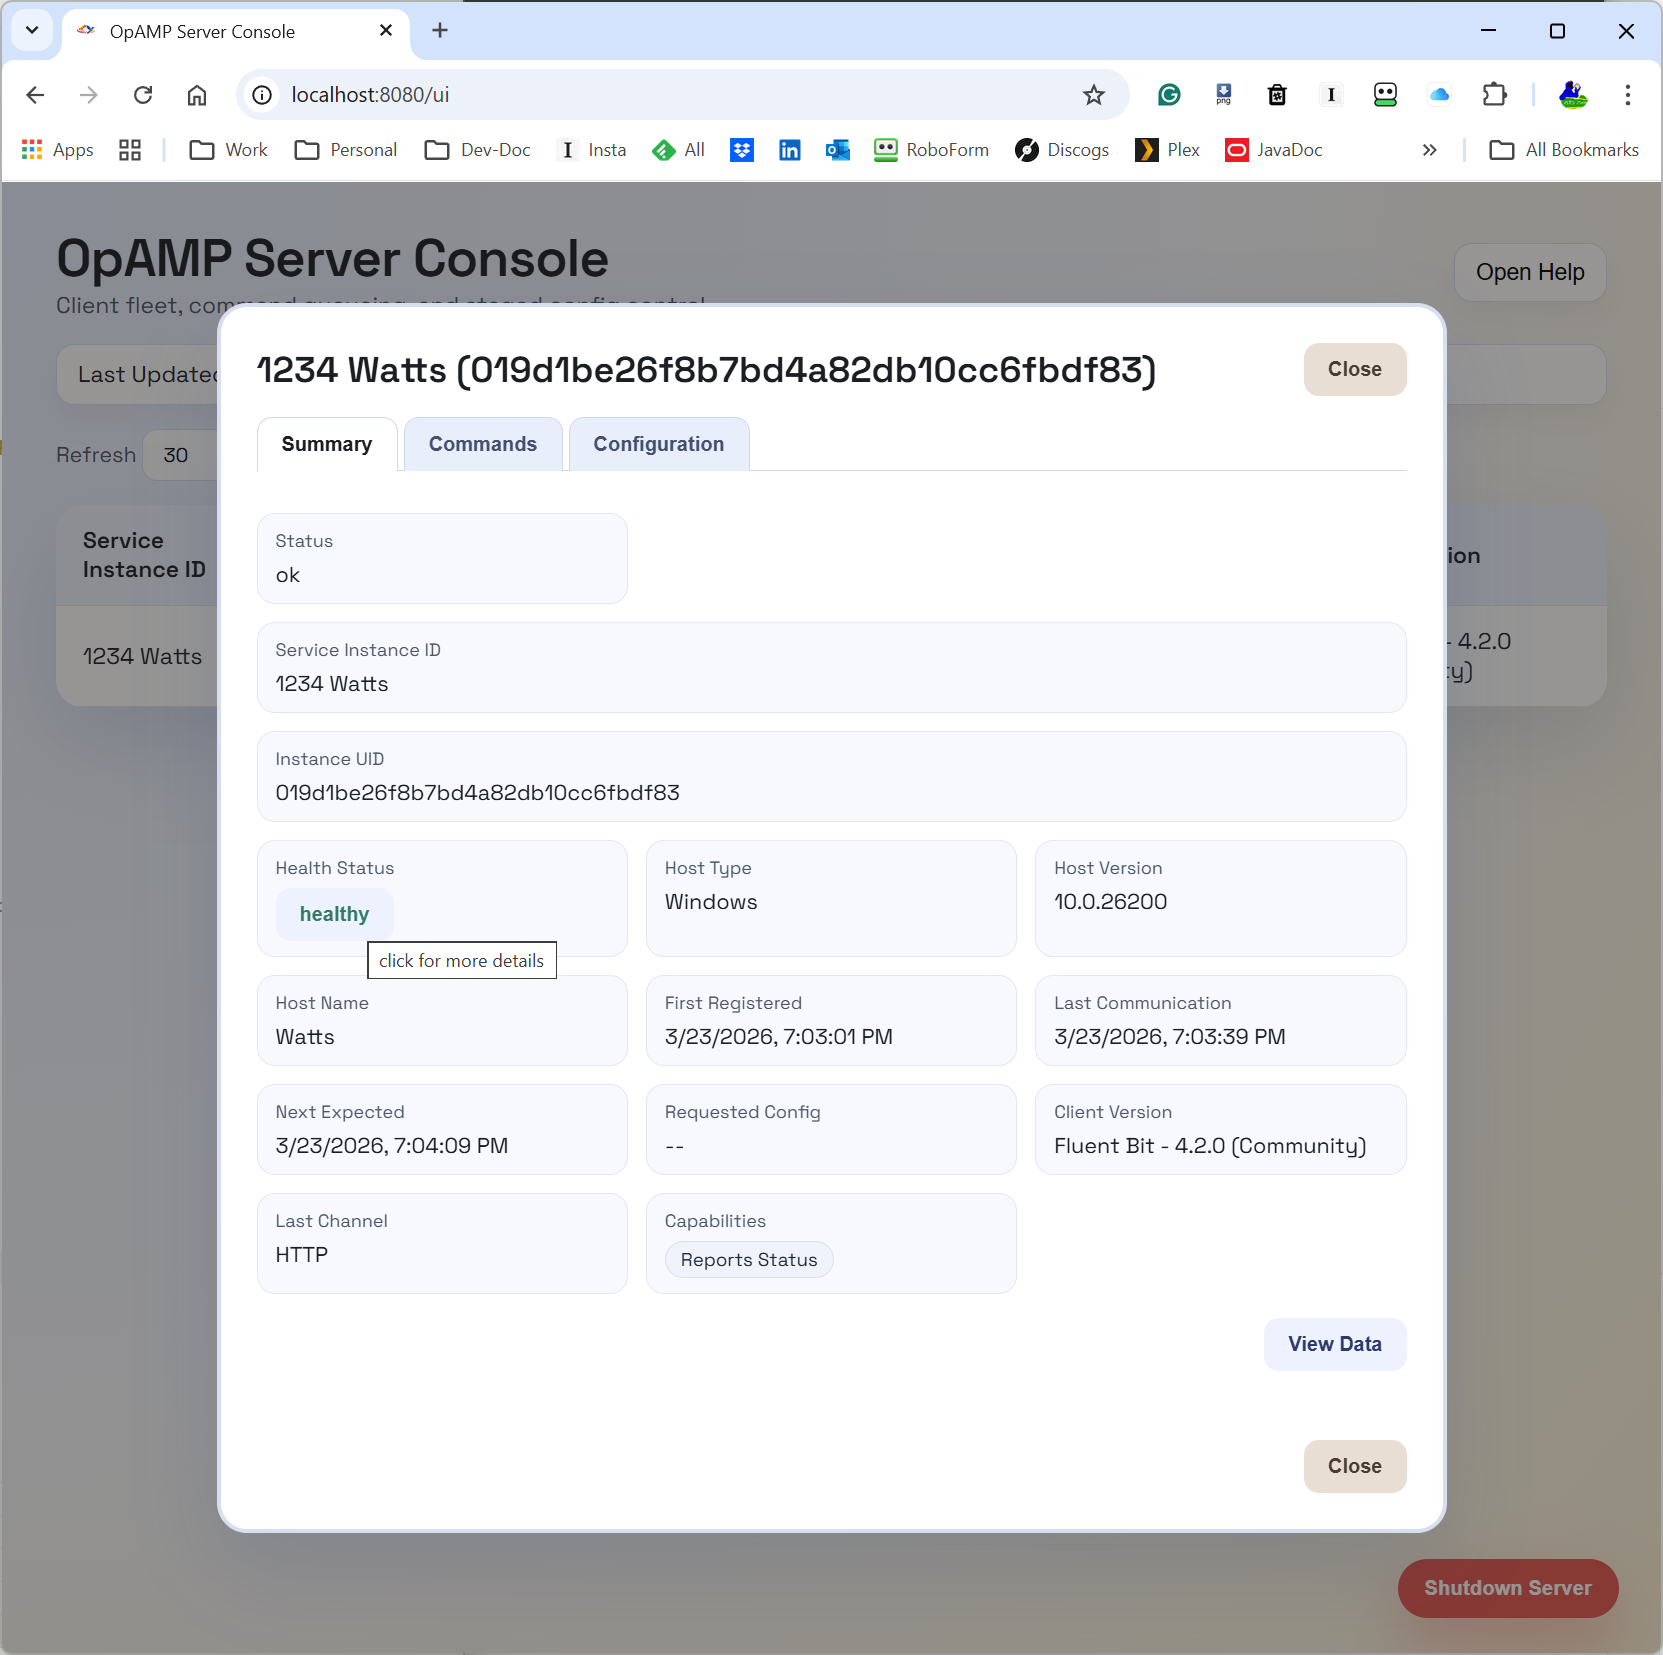
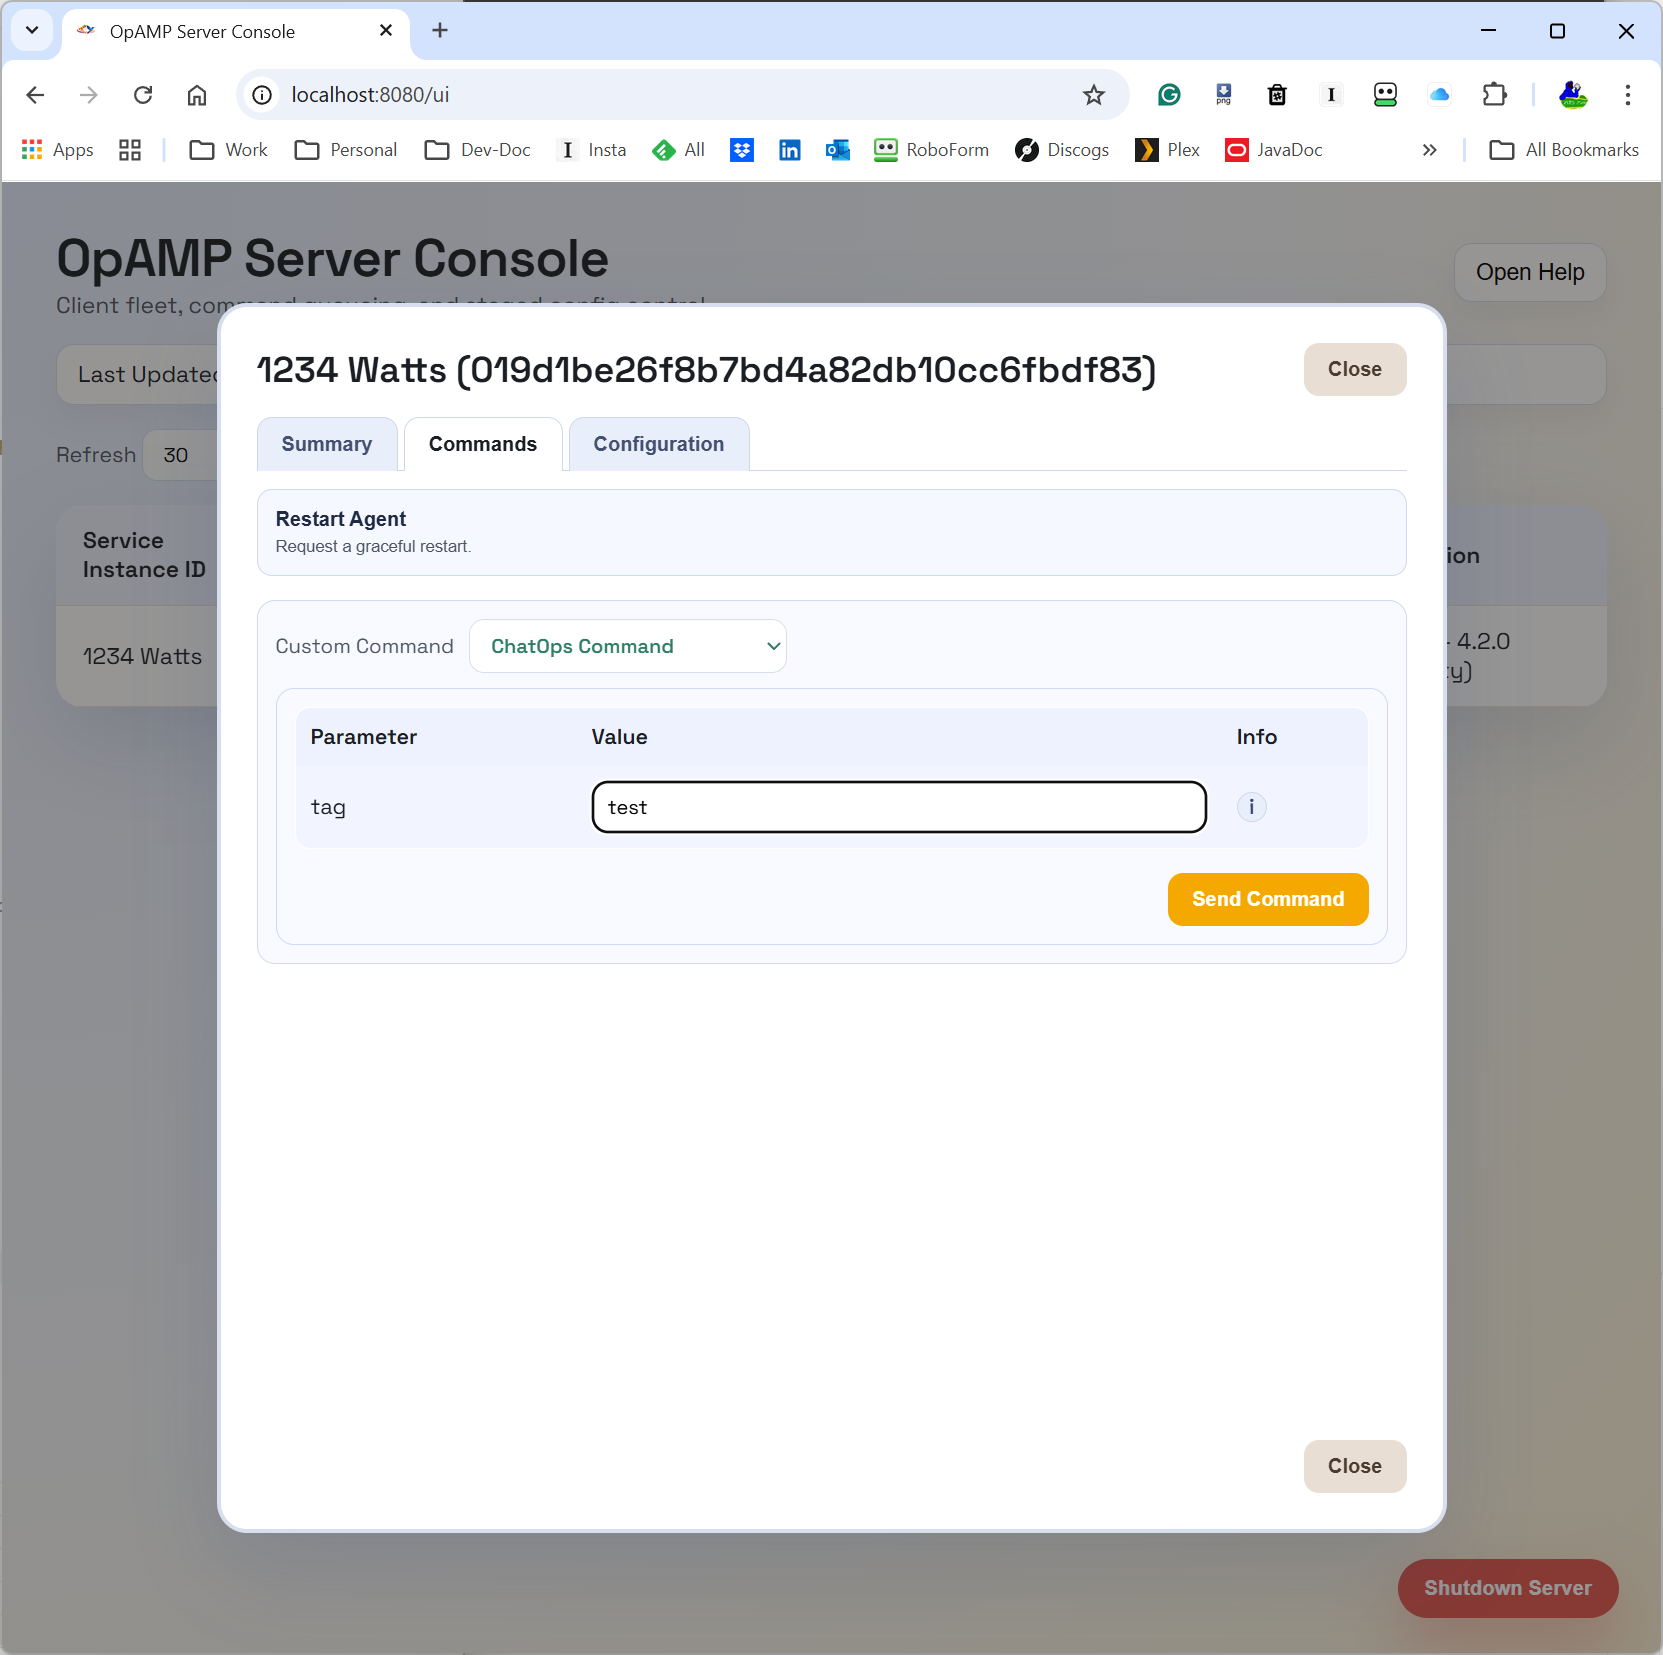
Here is a first server view we can include in the post:
The Server Console with a single Agent
The UI is still evolving, but this gives a concrete picture of the provider side control plane we are discussing.
What the OpAMP server (provider) does
The provider is responsible for the shared view of fleet state and intent.
Today it provides:
OpAMP transport endpoints (/v1/opamp) over HTTP and WebSocket.
API and UI endpoints to inspect clients and queue actions.
In-memory command queueing per client.
Emission of standard command payloads (for example, restart).
Emission of custom message payloads for custom capabilities.
Discovery and publication of custom capabilities supported by the server side command framework.
Operationally, this means we can queue intent once at the server and let the next client poll/connection cycle deliver that action in protocol-native form.
What the supervisor (consumer) does for Fluent Bit
The supervisor is the practical glue between OpAMP and Fluent Bit:
Starts Fluent Bit as a local child process.
Parses Fluent Bit config details needed for status polling.
Polls Fluent Bit local endpoints on a heartbeat loop.
Builds and sends AgentToServer messages (identity, capabilities, health/status context).
Receives ServerToAgent responses and dispatches commands.
Handles custom capabilities and custom messages through a handler registry.
So for Fluent Bit specifically, the supervisor gives us a way to participate in OpAMP now, even before native in-agent OpAMP support is universal.
And to be explicit: this is the current target. Fluentd support is a planned evolution of this same model, not a separate rewrite.
Where ChatOps fits
ChatOps is where this gets interesting for day-2 operations.
In this implementation, ChatOps commands are carried as OpAMP custom messages (custom capability org.mp3monster.opamp_provider.chatopcommand). The provider queues the custom command, and the supervisor’s ChatOps handler executes it by calling a local HTTP endpoint on the configured chat_ops_port.
That gives us a cleaner control path:
Chat/user intent can go to the central server/API.
The server routes to the right node through OpAMP.
The supervisor performs the local action and can return failure context when local execution fails.
This is a stronger pattern than directly letting chat tooling call every node individually, and it opens the door to better auditability and policy controls around who can trigger what.
Reality check: we are still testing
This is important: we are still actively testing functionality.
Current status is intentionally mixed:
Core identity, sequencing, capabilities, disconnect handling, and heartbeat/status pathways are in place.
Some protocol fields are partial, todo, or long-term backlog.
Custom capabilities/message pathways are implemented as a practical extension point and are still being hardened with test coverage and real-world runs.
So treat this as a working framework with proven pieces, not a finished all-capabilities implementation.
What is coming next (based on docs/features.md)
Near-term priorities include:
stricter header/channel validation,
heartbeat validation hardening,
payload validation against declared capabilities,
server-side duplicate websocket connection control behaviour.
Broader roadmap themes include:
authentication/security model for APIs and UI,
persistence in the provider,
richer UI controls for node/global polling and multi-node config push,
certificate and signing workflows,
packaging improvements.
And yes, a key strategic direction is evolving the framework abstraction so it can support Fluentd in due course, not only Fluent Bit. Some feature areas (like package/status richness) make even more sense in that broader collector ecosystem.
Why this matters
OpAMP gives us a standard envelope for control-plane interactions; the server/supervisor split gives us pragmatic deployment flexibility; and ChatOps provides a human-friendly control surface.
Put together, this becomes a useful pattern for managing telemetry agents in real environments where fleets are mixed, rollout velocity matters, and “just redeploy everything” is not always an option.
If you are evaluating this right now, the right mindset is: useful today, promising for tomorrow, and still under active verification as we close feature gaps.
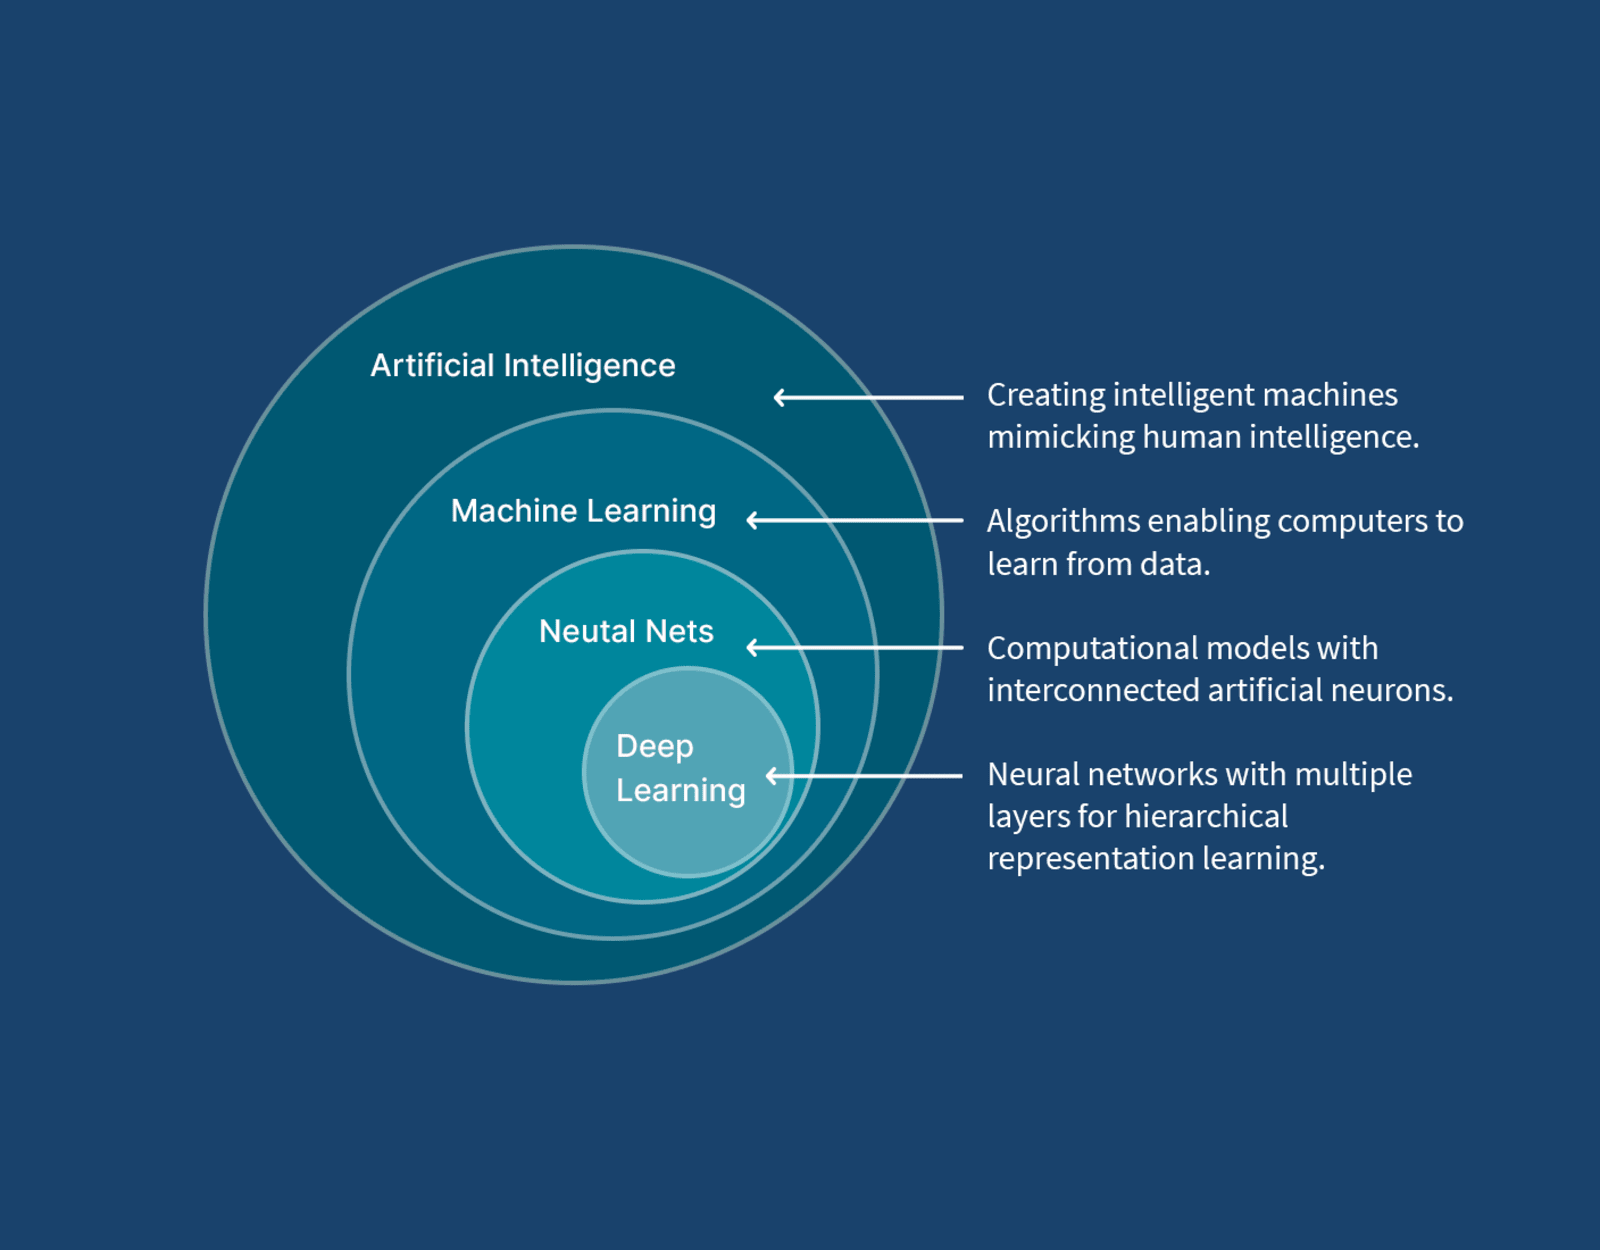
These days, everywhere you look, there are references to Generative AI, to the point that what have Fluent Bit and GenAI got to do with each other? GenAI has the potential to help with observability, but it also needs observation to measure its performance, whether it is being abused, etc. You may recall a few years back that Microsoft was trailing new AI features for Bing, and after only having it in use for a couple of days, it had been recorded generating abusive comments and so on (Microsoft’s Tay is such an example).
But this isn’t the aspect of GenAI (or the foundations of AI with Machine Learning (ML)) I was thinking about. Fluent Bit can be linked to GenAI through its TensorFlow plugin. Is this genuinely of value or just a bit of ‘me too’?
There are plenty of backend use cases once the telemetry has been incorporated into an analytics platform, for example:
Making it easy to query and mine the observability data, such as natural language searching – to simplify expressing what is being looked for.
Outlier / Anomaly detection – when signals, particularly metrics, diverge from the normal patterns of behavior, we have the first signs of a problem. This is more Machine Learning than generative AI.
Using AI agents to tune monitoring thresholds and alerting scenarios
But these are all backend, big data style use cases and do not center on Fluent Bit’s core value of getting data sources to appropriate destination systems for such analysis or visualization.
To incorporate AI into Fluent Bit pipelines, we need to overcome a key issue – AI tends to be computationally heavy – making it potentially too slow for streams of signals being generated by our applications and too expensive given that most logs reflecting ‘business as usual’ are, in effect, low value.
There are some genuine use cases where lightweight AI can deliver value. First, we should be a little more precise. The TensorFlow plugin is the TensorFlow Lite version, also known as LiteRT. The name comes from the fact that it is a lite-weight solution intended to be deployable using small devices (by AI standards). This fits the Fluent Bit model of having a small footprint.
So, where can we put such a use case:
Translating stack traces into actionable information can be challenging. A trained ML or AI model can help classify and characterize the cause of a stack trace. As a result, we can move from the log to triggering appropriate actions.
Targeted use cases where we’ve filtered out most signal data to help analyze specific events – for example, we want to prevent the propagation of PII data downstream. Some PII data can be easily isolated through patterns using REGEX. For example, credit card IDs are a pattern of 4 digits in 4 groups. Phone numbers and email addresses can also be easily identified. However, postal addresses aren’t easy, particularly when handling multinational addresses, where the postal code/zip code can’t be used as an indicative pattern. Using AI to help with such checks means we must filter out signals to only examine messages that could accidentally carry such information.
When adopting AI into such scenarios, we have to be aware of the problems that can impact the use of ML and AI. These use cases are less high profile than the issues of hallucinations but just as important. As we’re observing software, which will change over time. As a result, payloads or data shifts (technically referred to as data drift) and the detection rate can drop. So, we need to measure the efficacy of the model. However, issues such as data drift need to be taken into account, as the scenario being detected may change in volume, reflecting changes in software usage and/or changes in how the solution works.
There are ways to help address such considerations, such as tracking false positive outcomes, and if the model can provide confidence scoring, is there a trend in the score?
Conclusion
There are good use cases for using Machine Learning (and, to an extent, Artificial Intelligence) within an observability pipeline – but we have to be selective in its application as:
The cost of the computation can outweigh the benefits
The execution time for such computation can be notably slower than our pipeline, leading to risks of back pressure if applied to every event in the pipeline.
The effectiveness and how much data drift might occur (we might initially see very good results, but then things can fall off).
Possibly, the most useful application is when the AI/ML engine has been trained to recognize patterns of events that preceded a serious operational issue (strictly, this is the use of ML).
Forward-looking
The true potential for Gen AI is when we move beyond isolating potential faults based on pattern recognition to using AI to help recommend or even trigger remediation processes.
The hyper scaler cloud vendors all offer Logging and monitoring capabilities. But they tend to focus on supporting their native services. If you’re aware of Oracle’s Cloud (OCI) messaging, then you’ll know that there is a strong recognition of the importance of multi-cloud. This extends not only to connecting apps across clouds but also to be able to observe and manage cloud-spanning solutions. Ultimately, most organizations want to headline observability-related views of their solutions.
Late last year, I presented these ideas, illustrating the ideas with the use of Fluent Bit and OCI’s Observability and Management products to visualize and analyze what is happening. I finally found the time to write how the very basic demo was built from a clean sheet over on the Oracle Devs blog on Medium.
This also highlights the fact that the Fluent Bit book, while I believe, once completed, will be through, can’t cover everything – and certainly not build end-to-end use cases like the Oracle Observability & Management example. To help address this, the book includes an appendix of helpful additional information, some of which I have included here, along with other content that we encounter – all of which can be found at Fluentd & Fluent Bit Additional stuff.




 Phil (aka MP3Monster)'s Blog
You must be logged in to post a comment.